

Abstract
Chloramine is a secondary disinfectant used to maintain microbial control throughout public water distribution systems. This study investigated the relationship between chloramine concentration, heterotrophic bacteria, and specific Mycobacterium species. Sixty-four water samples were collected at four locations within the utility’s distribution network on four occasions. Water samples were analyzed for total chlorine and monochloramine. Traditional culture methods were applied for heterotrophic bacteria and nontuberculous mycobacteria (NTM), and specific quantitative polymerase chain reaction (qPCR) assays were used to detect and quantify Mycobacterium avium, M. intracellulare, and M. abscessus. Total chlorine and monochloramine concentrations decreased between the distribution entry point (4.7 mg/L and 3.4 mg/L as Cl2, respectively) to the maximum residence time location (1.7 mg/L and 1.1 mg/L as Cl2, respectively). Results showed that heterotrophic bacteria and NTM counts increased by two logs as the water reached the average residence time (ART) location. Microbiological detection frequencies among all samples were: 86% NTMs, 66% heterotrophic bacteria, 64% M. abscessus, 48% M. intracellulare, and 2% M. avium. This study shows that heterotrophic bacteria and NTM are weakly correlated with disinfectant residual concentration, R2=0.18 and R2=0.04, respectively. Considering that specific NTMs have significant human health effects, these data fill a critical knowledge gap regarding chloramine’s impact on heterotrophic bacteria and Mycobacterial species survival within public drinking water distribution systems.
Keywords: Distribution, Drinking Water, Haloacetic Acids, Heterotrophic Bacteria, Monochloramine, Nontuberculous Mycobacterium, Trihalomethanes
1. Introduction
Secondary chemical disinfectants are used in drinking water as a treatment barrier to maintain microbial control. However, chemicals known as disinfection byproducts (DBP) could be formed as the disinfectant decays and reacts with organic matter. In the United States (US), chloramines are the second most used secondary disinfectant after free chlorine (AWWA 2018). In drinking water, chloramines are formed when hypochlorous acid (HOCl) reacts with ammonia (NH3), producing monochloramine as its primary reaction product. Chloramines are more stable than free chlorine (the sum of HOCl and hypochlorite ion (OCl−); therefore, chloramines persist longer in water (Jafvert and Valentine 1992).
Chloramines, specifically monochloramine, have biocidal activity. However, chloramines are not as effective as free chlorine in reducing microbial contamination (Ward et al., 1984). Additionally, research investigating chloramines (monochloramine) impact on biofilm showed that although monochloramine could penetrate biofilm better than free chlorine, it took longer to inactivate the biofilm than free chlorine (Lee et al., 2018). Depending on the source water quality and what bacterial species are present, chloramine’s contact time required for 99.9 % (3 logs) microbial reduction can vary from a few minutes to several days (Berman et al., 1988, Luh et al., 2008, Ward et al., 1984).
In the early 2000s, Falkinham et al., (2001) and Pryor et al., (2004) investigated NTM changes in utilities that altered their secondary disinfectant to monochloramine (Falkinham et al., 2001, Pryor et al., 2004). After changing to monochloramine, some bacterial species decreased while other bacterial genera like nontuberculous mycobacterium (NTM) increased in the distributed water. Since then, others like Gomez-Alvarez et al., (2012), Waak et al. (2019), and Haig et al., (2020), using various molecular techniques, have provided data that supported NTM tolerance in chloraminated water. However, not all NTM species are associated with human health effects (Griffith et al., 2007).
In the US, there are approximately eleven clinically relevant NTM species (Griffith et al., 2007). Of the eleven NTM species, the top three NTM species most associated with disease and could require medical treatment are M. avium, M. intracellulare [both species belong to the M. avium complex (MAC)] and M. abscessus (Billinger et al., 2009, Prevots et al., 2010). From the 1980s to 2015, the US disease prevalence rate associated with NTM species increased from 1.3 to 6.8 per 100,000 persons (O’Brien et al., 1987, Winthrop et al., 2020). Annually, 50,000 to 80,000 individuals are affected by NTM infections in the US (Donohue 2018, Henkle et al., 2015). The US spends approximately 1.5 billion dollars per year on hospitalization and treatment of these infections (Collier et al., 2021).
Mycobacterium avium and M. intracellulare are slow-growing NTM species. The recovery of these NTM species from environmental samples can require culture plates to be held for > 6 weeks. NTM culture media are only semi-selective and typically require pre- or post-treatment to reduce competing bacteria. Despite these efforts to mitigate bacterial competitors (both non- and other- NTM species), growth of M. avium and M. intracellulare could be suppressed or obscured. The long hold times increase the culture plates’ liability to bacillus and mold contamination, resulting in data loss. Though the environmental recovery of M. avium and M. intracellulare is ideal, culture testing is a presence/absence test only and cannot be used to determine the quantity. Mycobacterium avium and M. intracellulare amounts can be determined using quantitative molecular methods such as qPCR (Pfaller et al., submitted). In vitro inactivation studies using culture stocks of M. avium and M. intracellulare show that 99.9% inactivation requires high chloramine concentration (>4.0 mg CL2/L) and long contact times (CT; days to weeks, depending on strain) compared to other disinfectants such as chlorine dioxide and free chlorine (Jacangelo et al., 2002, Taylor et al., 2000).
Currently, the United States Environmental Protection Agency (US EPA) regulates two DBP classes: trihalomethanes (THM) and haloacetic acids (HAA). Trihalomethanes and HAA are disinfection byproducts formed when the disinfectants react with organic matter in water (Berman et al., 1988, Zhang et al., 2013). In 1998, the US EPA promulgated the Stage 1 Disinfectants/Disinfection Byproducts Rule (DBPR) to control DBPs at public water systems (US EPA 1998). The US EPA regulates four THMs (chloroform, bromodichloromethane, chlorodibromomethane, and bromoform) and five HAAs (monochloroacetic acid, dichloroacetic acid, trichloroacetic acid, monobromoacetic acid, and dibromoacetic acid). The Stage 1 DBPR rule also established the regulatory Maximum Contaminant Levels (MCLs) of 80 μg/L and 60 μg/L for the four THMs (THM4) and five HAAs (HAA5), respectively (US EPA 1998). Recently, US EPA has shown interest in understanding the occurrence of four additional brominated HAAs (bromochloroacetic acid, bromodichloroacetic acid, chlorodibromoacetic acid, and tribromoacetic acid) which when added to HAA5 are referred to as HAA9 (US EPA 2016). Furthermore, a result of US EPA’s third six-year review of drinking water regulations was to list HAA5 as a candidate for revision, to evaluate adding additional HAAs to regulate (e.g., expanding the regulation to HAA9)(US EPA 2017).
In the years preceding the Stage 1 DBPR, evidence suggested that THM4 and HAA5 included several potential carcinogens, which could account for some bladder and liver cancer cases in communities where drinking water was treated with chlorine. In addition, monitoring data collected at that time demonstrated that all nine DBP chemicals could be present at levels exceeding the regulatory guidelines at some public water systems (PWSs)(Coffin et al., 2000, Dunnick and Melnick 1993, Herren-Freund et al., 1987, IARC 1991, Jolley et al., 1990, US EPA 1998).
In the early 2000s, many utilities started using chloramines as a secondary disinfectant to prevent DBP violations (AWWA 2013). Since both THM/HAA and specific species of NTM have human health effects, it is of interest to understand the DBP and the microbial trade-offs in response to monochloramine. The current study investigated the relationship between chloramine concentrations and heterotrophic bacteria, NTM, and three clinically relevant Mycobacterium sp. detection frequencies at four PWSs in the United States. Samples were collected quarterly at four locations throughout each distribution system. Sampling sites were chosen to determine if microbial growth was either localized or systemic within each distribution network. Traditional agar plate methods for heterotrophic bacteria and NTMs, along with specific qPCR assays for M. avium, M. intracellulare, and M. abscessus, were used to assess the bacteria’s response to the chloramine concentration.
2. Materials and Methods
2.1. Study design
From December 2017 to September 2018, four chloraminated PWSs in the United States were sampled quarterly at four locations throughout their respective distribution network. Table 1 lists each system’s characteristics and its treatment techniques. Three systems used surface water (SW) as a source, and one system used groundwater (GW).
Table 1.
System Characteristic Summary
| System Notation | SW1 | SW2 | SW3 | GW |
| Source Water | Surface Water | Surface Water | Surface Water | Groundwater |
| Population Served | 31,000 | 97,000 | 234,000 | 4,000 |
| System Size Category | Large | Large | Very Large | Small |
| Treatment | Coagulation | Coagulation | Coagulation | Coagulation |
| Sedimentation | Sedimentation | Sedimentation | Sedimentation | |
| Filtration | Filtration | Filtration | Filtration Ion Exchange |
|
| GAC | GAC | PAC | ||
| Sand Filters | Sand Filters | Anthracite Sand Filters |
||
| Corrosion Control | Orthophosphate | Orthophosphate | ||
| Pre-Oxidant | Permanganate Chlorine Dioxide |
Chlorine Dioxide | Permanganate | |
| Primary Disinfectant | Free Chlorine | Free Chlorine | Free Chlorine | Free Chlorine (Chloramines)a |
| Secondary Disinfectant | Chloramines | Chloramines | Chloramines | Chloramines |
| Distribution System Storage Tanks | 7 | 13 | 8 | 0b |
system has naturally occuring ammonia in the source water
system only has storage tanks at the treatment plant
ART – average residence time sample; EP – entry point sample; GAC – granular activated carbon; MRT – maximum residence time sample; PAC – Powder Activated Carbon; TANK – near water storage tank sample
The surface water systems (SW1, SW2, and SW3) were sampled along a linear section of their distribution network at four locations. These locations were the (1) system’s entry point (EP) where treated water enters the distribution network, (2) average residence time (ART) near the midpoint of the distribution network, (3) very near- or downstream to a storage tank (TANK), and (4) maximum residence time (MRT) near the point of oldest water age in the system. The sampling locations followed the treated water in a linear line from EP (start) to the MRT (stop), with the ART and TANK locations in between the start and stop endpoints (Fig. 1A). The GW system had EP and MRT sampling locations but did not have a TANK location within the distribution; therefore, two ART locations (ART1 and ART2) were used. The two ART locations were two trunk water lines that ran parallel, moving treated water to the same MRT location (Fig. 1A).
Figure 1.

A. Sampling locations layout by system (utility). B. Average monochloramine concentration percent change through distribution by system. aEstimated distance from EP based on surface distance between locations by car.
2.2. Drinking water system characteristics
The PWSs that participated in this survey served populations ranging from 4,000 to 230,000 people. Public water system SW3 is classified as very large, serving water to more than 100,000 persons. SW1 and SW2 are large systems, serving water to 10,000 – 100,000 persons. The GW utility is considered a small system, serving water to less than 10,000 persons. SW3 and GW applied orthophosphate for corrosion control. SW1 and SW2 used chlorine dioxide as a pre-oxidant before the addition of chlorine. All SW systems used free chlorine for primary disinfection. However, all the SW systems added ammonia, converting the free chlorine to chloramines for secondary disinfection. The GW system had naturally occurring ammonia in their aquifer; thus, some chlorine was converted to chloramine. The SW1 system added permanganate for manganese control. The GW system utilized ion exchange for arsenic control and water softening. All systems, except the GW system, utilized storage tanks throughout their distribution network. The TANK samples for SW1 and SW2 were taken at a point downstream to an elevated tank. The sample for the SW3 TANK was taken before entry into a ground storage tank.
2.3. Sampling
Samples were collected four times throughout one year: December 2017 and March, June, and September 2018. The utilities’ sampling locations were taps connected directly to the main water trunkline in a particular area. A 1- to 5-minute flush time was applied before water collection. The flush time was dependent on the length of pipe used to access the water main. After the line was flushed, the water for microbial analysis was collected in three, 1-liter, sterile high-density polypropylene (HDPP) Nalgene bottles (Thermo Fisher Scientific, Waltham, MA). The water for THM and HAA analysis was collected in a 500 mL amber glass bottle. The samples were packed in an ice chest and shipped on ice overnight to EPA in Cincinnati, OH.
2.4. Water quality measurements
Water temperature was measured at the time of collection with a digital traceable lollipop thermometer (Thermo Fisher Scientific). Total chlorine and monochloramine concentrations were measured colorimetrically using the N, N-diethyl-p-phenylenediamine method (DPD Total Chlorine: Hach Company, Loveland, CO) and the indophenol method (Monochlor F reagents: Hach Company), respectively. Waters et al., (2021) provided helpful insights into the indophenol chemistry of the Monochlor F test. The analyses were performed at all sample locations for each sampling event using either a Hach Pocket Colorimeter II or SL-1000 (Hach Company). A sample’s pH, free-ammonia, and nitrite concentrations were measured by the SL-1000’s free-ammonia and nitrite Chemkeys (Hach Company). All manufacturer’s instructions were followed.
2.5. Microbial Analysis
2.5.1. Heterotrophic plate counts
Upon the sample’s arrival in the laboratory, two 100 μl aliquots were removed for heterotrophic plate count (HPC) analysis (Standard Method 9215B)(AWWA 2017). For each water sample, a 100 μL aliquot of water was aseptically spread-plated onto an R2A agar plate (Becton, Dickinson and Company, Franklin Lakes, NJ) and incubated at 29°C for seven days in the dark. The limit of detection for the HPC method is 1 colony forming unit (CFU)/100 μl. CFU were counted and recorded on day seven.
2.5.2. Nontuberculous mycobacterium culture
A one-liter sample was split into two 500 mL aliquots and decontaminated with 0.04% cetylpyridinium chloride (CPC) (Millipore Sigma Corp. Burlington, MA) for 30 min at room temperature. Both 500 mL samples were vacuum filtered through two 0.45 μm pore size black grid HABG04700-mm membranes (Millipore Sigma Corp) in a biological safety cabinet. Bottles and filter units were thoroughly rinsed with autoclaved ultrapure water to remove the CPC residual. The membrane filter was then transferred aseptically onto Middlebrook 7H10 agar plates (Becton, Dickinson, and Company), containing Middlebrook OADC enriched media (Becton, Dickinson, and Company), Mycobactin J (Allied Monitor, Fayette, MO), and 500 mg of cycloheximide (Millipore Sigma Corp.) per liter. Plates were sealed in gas permeable bags and incubated at 37°C with 10% CO2. Visual inspection of the plates occurred every week for up to two months. NTM CFUs were counted and recorded for each sample. The NTM culture method detection limit is 1 CFU/ 500mL. Isolates on each plate were selected based on the colony morphologies commonly associated with NTM. The isolates were subcultured onto Middlebrook 7H10 agar slants (Becton, Dickinson, and Company), and incubated at 37°C with 10% CO2 for subsequent Sanger sequencing. The supplemental file contains the procedures for DNA extraction for Sanger sequencing, sequence analysis, and isolate identification. One hundred and twenty-two sequences were submitted to GenBank and were given accession numbers MW207680–MW207802.
2.5.3. Mycobacterium avium, M. intracellulare, and M. abscessus qPCR Assays
The procedures used for qPCR sample filtration, qPCR DNA extraction, and qPCR controls were previously published (Donohue et al., 2019), and placed into supplemental files.
2.5.3.1. qPCR assays and conditions.
See the previously published instructions for the preparation of DNA standards for the following qPCR method (Donohue et al., 2019). Three primer-probe sets were used to detect and quantify M. avium (MA), M. intracellulare (MI), and M. abscesses (MAb) in the extracted DNA samples (Supplemental Table 1) (Pfaller et al., submitted, Steindor et al., 2015). The details for all three primer-probe set conditions are included in previous publications (Donohue et al., 2019).
For the MA, MI, and MAb assays, amplification was performed using 10 μL DNA extract, 12.5 μL TaqMan® Environmental Master Mix 2.0 (Applied Biosystems, Foster City, CA), 2.5 μL Exogenous IPC mix (Applied Biosystems), 0.5 μL Exogenous IPC DNA (Applied Biosystems), 1.0 μL 0.5 mg/mL bovine serum albumin, 900 nM each primer, and 200 nM probe in a total volume of 35 μL. All reactions were carried out in triplicate using an ABI Model QuantStudio™ 6 Real-Time PCR detection system (Applied Biosystems). Thermocycler conditions consisted of 95°C for 10 min, 40 cycles of 95°C for 15 sec, and 60°C for 1 min. Data were analyzed with the cycle quantification (Cq) threshold set at 0.04.
2.6. THM and HAA analysis
EPA Method 551.1 was followed to measure THM4: chloroform, chlorodibromomethane, bromodichloromethane, and bromoform. EPA Method 552.3 was used to measure the five regulated HAAs (HAA5): monochloroacetic acid, dichloroacetic acid, trichloroacetic acid, monobromoacetic acid, dibromoacetic acid, and four the unregulated HAAs: bromochloroacetic acid, bromodichloroacetic acid, chlorodibromoacetic acid, and tribromoacetic acid.
2.7. Data and Statistical Analysis
Heterotrophic plate counts and NTM plate counts that exceed 500 CFU/plate were given a default value of 600 CFU/uL for HPC or 600 CFU/500mL for NTM. The qPCR results were interpreted as follows: first, a sample was considered positive for a specific microorganism if two or more of the triplicate Cq values were less than 40 Cq; next, each positive sample’s Cq values were averaged and transformed to a genomic unit (GU) value using a master standard-curve equation; then, the genomic target concentration was adjusted to represent a 500 mL volume.
Percentage, mean, and median were calculated in Excel (Microsoft Corporation, Redmond, WA). Regression, ANOVA analysis, and 95% confidence intervals were performed in Sigma Plot 14.0 (Systat Software Inc, San Jose, CA). A significance level of 0.05 was used.
3. Results
3.1. Monochloramine residual inside the distribution network
As expected, SW system samples from the MRT locations had the lowest measured monochloramine concentration. The average monochloramine concentrations for SW1, SW2, and SW3 at the MRT were 1.3 ± 0.7, 2.2 ± 0.2, and 1.0 ± 0.3 mg Cl2/L, respectively (Table 2). The SW1, SW2, and SW3 MRT location distances were 18.5, 36.6, and 20.0 miles away from the EP location (Fig. 1A). Water samples that had the greatest monochloramine concentration were from the EP location. The largest decline in the chloramine residual concentration occurred between the EP and ART locations (Fig. 1B). The ART locations were about 7.6, 16.4, and 3.4 miles from the EP, for SW1, SW2, and SW3, respectively. At the SW’s ART locations, the average monochloramine residual concentration was between 33% to 66% lower than the EP monochloramine residual concentration on the day of sampling (Fig. 1B). SW1 downstream of a TANK sample had a 23% residual gain due to a chlorination booster near the sampling location. SW2 and SW3’s TANK samples showed a 23 to 30% loss of residual, approximately 0.3 to 0.4 mg/L of Cl2.
Table 2.
Disinfectant residual concentration and microorganism recovery and detection frequency summary by system and sample location
| System | Sample Location | Disinfectant Residual | Microorganisms | ||||||
|---|---|---|---|---|---|---|---|---|---|
| Total Cl2 Avg ± SD (mg Cl2/L) | NH2Cl Avg ± SD (mg Cl2/L) | (%) | HPC Culture No. Samples Positive | NTM Culture No. Samples Positive | MAb Culture [qPCR] No. Samples Positive | MI Culture [qPCR] No. Samples Positive | MA [qPCR] No. Samples Positive | ||
| SW1 | EP | 3.7 ± 0.5 | 3.2 ± 0.3 | 86 | 1 | 4 | [1] | ||
| ART | 1.7 ± 0.8 | 1.3 ± 0.7 | 76 | 4 | 4 | [4] | [2] | ||
| TANK | 1.8 ± 0.4 | 1.6 ± 0.7 | 89 | 4 | 4 | 1 [4] | [1] | ||
| MRT | 0.9 ± 0.4 | 0.7 ± 0.3 | 78 | 4 | 4 | [4] | [1] | ||
| SW2 | EP | 3.9 ± 0.2 | 3.3 ± 0.2 | 85 | 2 | 3 | 1 [3] | ||
| ART | 2.7 ± 0.2 | 2.2 ± 0.2 | 81 | 3 | 4 | [4] | [1] | ||
| TANK | 2.1 ± 0.3 | 1.7 ± 0.2 | 81 | 4 | 4 | [4] | 1 [4] | [1] | |
| MRT | 1.4 ± 0.3 | 0.8 ± 0.8 | 57 | 4 | 4 | [4] | [3] | ||
| SW3 | EP | 3.5 ± 0.4 | 2.9 ± 1.3 | 83 | 2 | 4 | [2] | [2] | |
| ART | 1.4 ± 0.6 | 1.0 ± 0.3 | 71 | 2 | 4 | [2] | 1 [4] | ||
| TANK | 1.1 ± 0.5 | 0.7 ± 0.3 | 64 | 4 | 4 | 2 [1] | [4] | ||
| MRT | 1.2 ± 0.7 | 0.7 ± 0.5 | 58 | 3 | 4 | [3] | [3] | ||
| GW | EP | 5.4 ± 0.9 | 4.4 ± 0.6 | 81 | 1 | 3 | |||
| ART1 | 1.7 ± 1.7 | 0.9 ± 0.8 | 53 | 4 | 3 | [1] | |||
| ART2 | 3.4 ± 0.8 | 2.6 ± 0.9 | 76 | 0 | 1 | [1] | [3] | ||
| MRT | 3.3 ± 0.9 | 2.2 ± 1.0 | 67 | 1 | 1 | [1] | |||
SW – Surface Water; GW – Groundwater; Monochloramine -NH2CL; HPC - heterotrophic plate counts; NTM – nontuberculous mycobacterium, MAb - M. abscessus, MI -M. intracellulare, and MA – M. avium, ART – average residence time sample; EP – entry point sample; GAC – granular activated carbon; MRT – maximum residence time sample
In the State where these systems were located, a total chlorine minimum of 0.5 mg of Cl2/L was recommended to be maintained within the utility’s distribution network. A total chlorine residual of less than 0.5 mg Cl2/L was measured in 8% (4/48) of the samples, and the number of samples with a monochloramine residual less than 0.5 mg Cl2/L was 17% (8/48).
The greatest total chlorine residual concentration at the GW system occurred at the EP (6.4 mg Cl2/L), and the lowest measurement was at ART1 (0.1 mg Cl2/L). The two ART locations were 4.9 and 4.4 miles away from the EP on separate branches of the distribution system. On average, ART 1 and ART2 monochloramine concentrations were 80% and 41% lower, respectively, compared to the EP monochloramine concentrations (Fig. 1B).
Table 2 provides the average residual (total chlorine and monochloramine) concentration by the system’s sampling location and the culture recovery or molecular detection of each microorganism monitored. Interestingly, among all the MRT locations, the GW’s MRT experienced the least disinfectant loss (approximately 49% of the EP value). The GW system has a small service area, with the MRT only 7.2 miles away from the EP location, leading to faster turnover of the water in distribution. Hence it is probable that the disinfectant in the GW system stays intact and forms fewer DBPs. Additionally, GW systems can have less organic matter in their source water. These characteristics help the GW system maintain a higher disinfectant throughout its distribution.
3.2. Monochloramine impact on microorganisms
Chloramine’s microbial control performance was measured by monitoring three microbial populations: heterotrophic bacteria, NTMs, and three mycobacterial species. Heterotrophic bacteria are a group of bacterial genera that are responsive to chemical disinfectants. Nontuberculous Mycobacteria are highly tolerant to chloramine disinfection (Taylor et al., 2000). The Mycobacterial species, M. avium, M. intracellulare, and M. abscessus, are clinically significant NTM species (Griffith et al., 2007, Perkins et al., 2019).
Microorganisms were detected and quantified using the following approaches: culture for heterotrophic bacteria and NTM, and qPCR for M. intracellulare, M. abscessus, and M. avium. The microorganism detection frequency from the water samples was as follows: heterotrophic bacteria 66% (42/64), NTM 86% (55/64), M. intracellulare 48% (31/64), M. abscessus 64% (41/64), and M. avium 2% (1/64). For the SW systems, bacteria were detected in samples from each sample location despite a total chlorine concentration greater than 1.0 mg Cl2/L. In each case, monochloramine represented 53% to 89% of the total chlorine residual concentration (Table 2). At the GW system, bacteria were recovered at the EP and ART1 locations, despite a total chlorine residual concentration greater than 1.0 mg Cl2/L. In general, the residual (total chlorine or monochloramine) concentrations beyond the EP location had little bearing on the water’s microbiological quality, as indicated by the HPC and NTM results (Table 2).
3.2.1. Heterotrophic bacteria and NTM response to monochloramine
A one-way ANOVA determined that HPC and NTM variance between the PWSs were not significant; ANOVA: HPC, P=0.954, and NTM, P=0.442. Therefore, the data was combined, and Figs. 2A and 2B summarize the heterotrophic bacteria and the NTM CFU/500 mL versus the monochloramine residual concentration associated with each sample location. The locations are designated as EP (X), ART (triangle), TANK (square), and MRT (circle). The EP (X) samples gave the lowest CFU/500 mL with the greatest concentration of total chlorine or monochloramine. Note that at monochloramine concentrations greater than 3.5 mg Cl2/L, none of the samples had an HPC count >500 CFU/mL). At lesser monochloramine concentrations, the HPC concentrations increased at locations beyond the EP (Fig. 2A). Twenty-seven percent (13/48) of samples contained HPC concentrations greater than 500 CFU/mL or 250,000 CFU/500 mL. NTM counts also increased at sampling points located farther away from the EP location. Forty-eight percent (23/48) of samples exceeded the NTM method’s upper quantification limit of 500 CFU/500 mL (Fig. 2B).
Figure 2.

A.) Heterotrophic bacteria (culture) and B.) NTM (culture) by monochloramine concentration and by sample location. In Figure 2A, the solid line threshold is representative of the HPC: 500 CFU/mL National Primary Drinking Water Regulation (NPDWR) MCL at “entry point”. In Figure 2B, the dashed line is at 600 NTM CFU/500 mL method upper quantification limit.
To examine monochloramine’s impact on the microbial population, a regression analysis was conducted using all samples except those from the EP (n=48). The HPC verses monochloramine regression analysis was significant (P= <0.006) and showed that monochloramine had a slight impact on the heterotrophic bacterial population. However, the presence of monochloramine only explains 18% of the bacterial concentration variability (adjusted R2 =0.179). For every 1 mg Cl2/L of monochloramine, the HPC concentration decreased by about 0.45 log (95% CI: 0.42–0.47 log CFU/500mL). The NTM were inferred to be monochloramine-tolerant based on the regression analysis indicating that there was no significant effect due to the monochloramine concentrations, P=0.134 and the adjusted R2= 0.037. Only about 4% of the variability of the NTM counts was explained by the monochloramine residual. The analysis also shows that for every 1 mg Cl2/L, the average theoretical NTM reduction was 0.2 log (95% CI: 0.05–0.28 CFU/500 mL). Overall, monochloramine concentration had a slight to no impact on maintaining or reducing HPC and NTMs levels in the distribution water. Monochloramine’s theoretical reduction of viable HPC and NTMs was determined to be 1.75 mg Cl2/L (95% CI: 1.25–3.5 mg Cl2/L) and 4.5 mg Cl2/L (95% CI: 2.5- > 6.0 mg Cl2/L), respectively. Although this study does not have a free-chlorine system as a point of comparison, the observation that so little of the HPC and NTM concentration variability was explained by the monochloramine residual suggests that other factors such as biofilm and total organic carbon could be influencing monochloramine’s impact on HPC and NTM.
3.2.2. NTM isolate identification
Of the 147 colonies chosen for Sanger sequencing identification, 74% (109/147) of isolates were identified as a Mycobacterium sp., 9% (13/147) of isolates were species other than Mycobacteria, and 17% (25/147) of isolates failed to produce a 16S sequence. Seventy-six percent (83/109) of the Mycobacterium sp. isolates were identified as M. mucogenicum/phocaicum. Four isolates from three plates were identified as M. abscessus. These isolates came from the SW1 March, SW3 June and SW3 September TANK samples. There were three isolates of M. intracellulare belonging to the subspecies chimaera designation; two of the three isolates were from the SW2’s March and September sampling at the EP and TANK locations; the third isolate was recovered from the SW3’s December ART sample. Supplementary Table 2 provides the NTM isolate identification data (Sanger sequencing) by the system, sample location, and sampling event.
3.2.3. Mycobacterium abscessus, M. intracellulare, and M. avium response to monochloramine
Quantitative PCR analysis was performed to detect and quantify M. abscessus, M. intracellulare, andM. avium. The detection rates for the SW systems were 79% (38/48), 58% (28/48), and 2% (1/48) for M. abscessus, M. intracellulare, and M. avium, respectively (Fig. 3). As the monochloramine residual decreased, M. abscessus concentrations increased at the SW2 and SW3 systems (Fig. 3A). At SW1 and GW, the monochloramine residual concentrations appeared to have little impact on M. abscessus at concentrations <1×10² genomic units (GU) /500 mL. The SW2 and SW3 samples had concentrations of M. abscessus that were two to three logs greater than the concentrations measured in the SW1 and GW systems.
Figure 3.

A) M. abscessus and B.) M. intracellulare molecular concentration (genomic unit (GU)/ 500 mL) by monochloramine concentration and by utility system. The dotted line represents the upper quantification limit of the NTM culture method (600 NTM CFU/500 mL).
Fig. 3B shows M. intracellulare response to monochloramine by PWS. An interesting observation regarding M. intracellulare positive samples was that concentrations were location specific. The samples from a specific location were clustered around the same concentration range, irrespective of the month of sampling. This observation was especially evident at SW2 and SW3 (Fig. 3B). The M. intracellulare concentrations at SW1 and GW systems demonstrated no relationship to the monochloramine residual concentration, but the M. intracellulare concentrations observed were lower than those at SW2 and SW3. In general, among the four systems, the median M. abscessus concentration was (1.9×10³ GU/500 mL) and was a log greater than the median concentration of the M. intracellulare positive samples (1.1×10² GU/500 mL).
3.3. Spatial and Seasonal Analysis of Heterotrophic Bacteria, NTM, and Specific Mycobacteria Species
Figure 4 depicts microbial persistence (detection frequency) and the sample location with the system’s greatest concentration for each microbe. In Fig. 4, microbial persistence is reflected in the box’s pattern (see legend for details). An asterisk depicts the location experiencing the greatest microbial concentration for each microbe. Within the SW systems, both heterotrophic bacteria and NTMs persisted from the ART to MRT locations. In addition, M. abscessus and M. intracellulare were detected at locations throughout each of the SW system’s distribution networks.
Figure 4.

Microbial persistence (as measured by detection frequency) by sample location. For each system, the asterisks * designates the locations that experienced the highest microbial concentrations.
Viable bacteria (heterotrophic bacteria and NTM) were cultured from every sample location at all the SW systems. The greatest CFU counts varied across the sample locations for each system. At SW1, the largest HPC and NTM count values occurred at the ART and MRT sample locations. For SW2, the largest NTM counts were observed at ART, TANK, and MRT sample locations. For SW3, the largest HPC counts occurred at the TANK and MRT sample locations. The NTM counts were consistently high (avg 380 NTM CFU/500 mL) from the ART sample location and through to the TANK and MRT sample locations.
At the GW system, heterotrophic bacteria were cultured from 38% (6/16) of the samples. Interestingly, most culture positive samples came from the ART1 location. Nontuberculous mycobacterium species were recovered from 50% (8/16) of the EP and ART1 samples. At the GW utility, only the ART1 branch had viable bacteria, while the ART2 branch did not, indicating that the microbiological activity was location specific.
Mycobacterium abscessus was persistently detected at all SW systems and all sample locations from the ART to MRT. For SW1 and SW3, M. intracellulare was persistently detected from the EP to the MRT sample locations. SW2 samples randomly produced four detections of M. intracellulare at different sampling locations and times. At the GW system, M. abscessus and M. intracellulare were detected at some of the sample locations, and there were no detections of M. avium. Among the three species-specific mycobacterium assays, the M. abscessus concentrations were highest, followed by M. intracellulare, and lastly, M. avium.
The potential for seasonal changes in HPC, NTM, M. abscessus and M. intracellulare concentrations (CFU/500mL and GU/500mL) was investigated. HPC, NTM, M. abscessus, and M. intracellulare concentrations from the four systems were evaluated by the month of sample collection (December, March, June, and September). The average monthly temperature amongst the four utilities were: December 18.5°C ± 2.7 (65.3 F), March 19.3°C ± 2.6 (66.7°F), June 27.7°C ± 2.1 (81.9°F), and September 26.3°C ± 3.8 (79.3°F). The month of sampling did not have a statistically significant effect on the microbial concentrations; ANOVA: HPC, P=0.59, NTM, P=0.40, M. abscessus, P=0.07, and M. intracellulare, P=0.58.
3.4. Monochloramine relationship to Microorganisms and THM/HAAs
Fig. 5 compares viable heterotrophic bacteria CFU/500mL and THM4, HAA5, and HAA9 by monochloramine residual. In all four utilities, as the residual concentration decreased the number of viable heterotrophic bacteria increased. However, the THMs and HAAs experienced different responses among the four utilities as the residual degraded in distribution. The THM4, HAA5, and HAA9 in SW1 increased as the residual degraded. In SW2, both the THM and HAA concentrations reduced as the residual diminished. In SW3, the THM4 concentration decreased, but the HAAs increased at the lower disinfectant residual. The GW system DBPs experienced a 6 percent gain at lower residual levels. A potential explanation for the diverging DBP profiles could be THM cometabolism and HAA biodegradation (Bayless and Andrews 2008, Wahman et al., 2006). Cometabolism provides a biological mechanism to potentially decrease THM/HAA formation with increasing water age (Bayless and Andrews 2008, Wahman et al., 2006).
Figure 5.
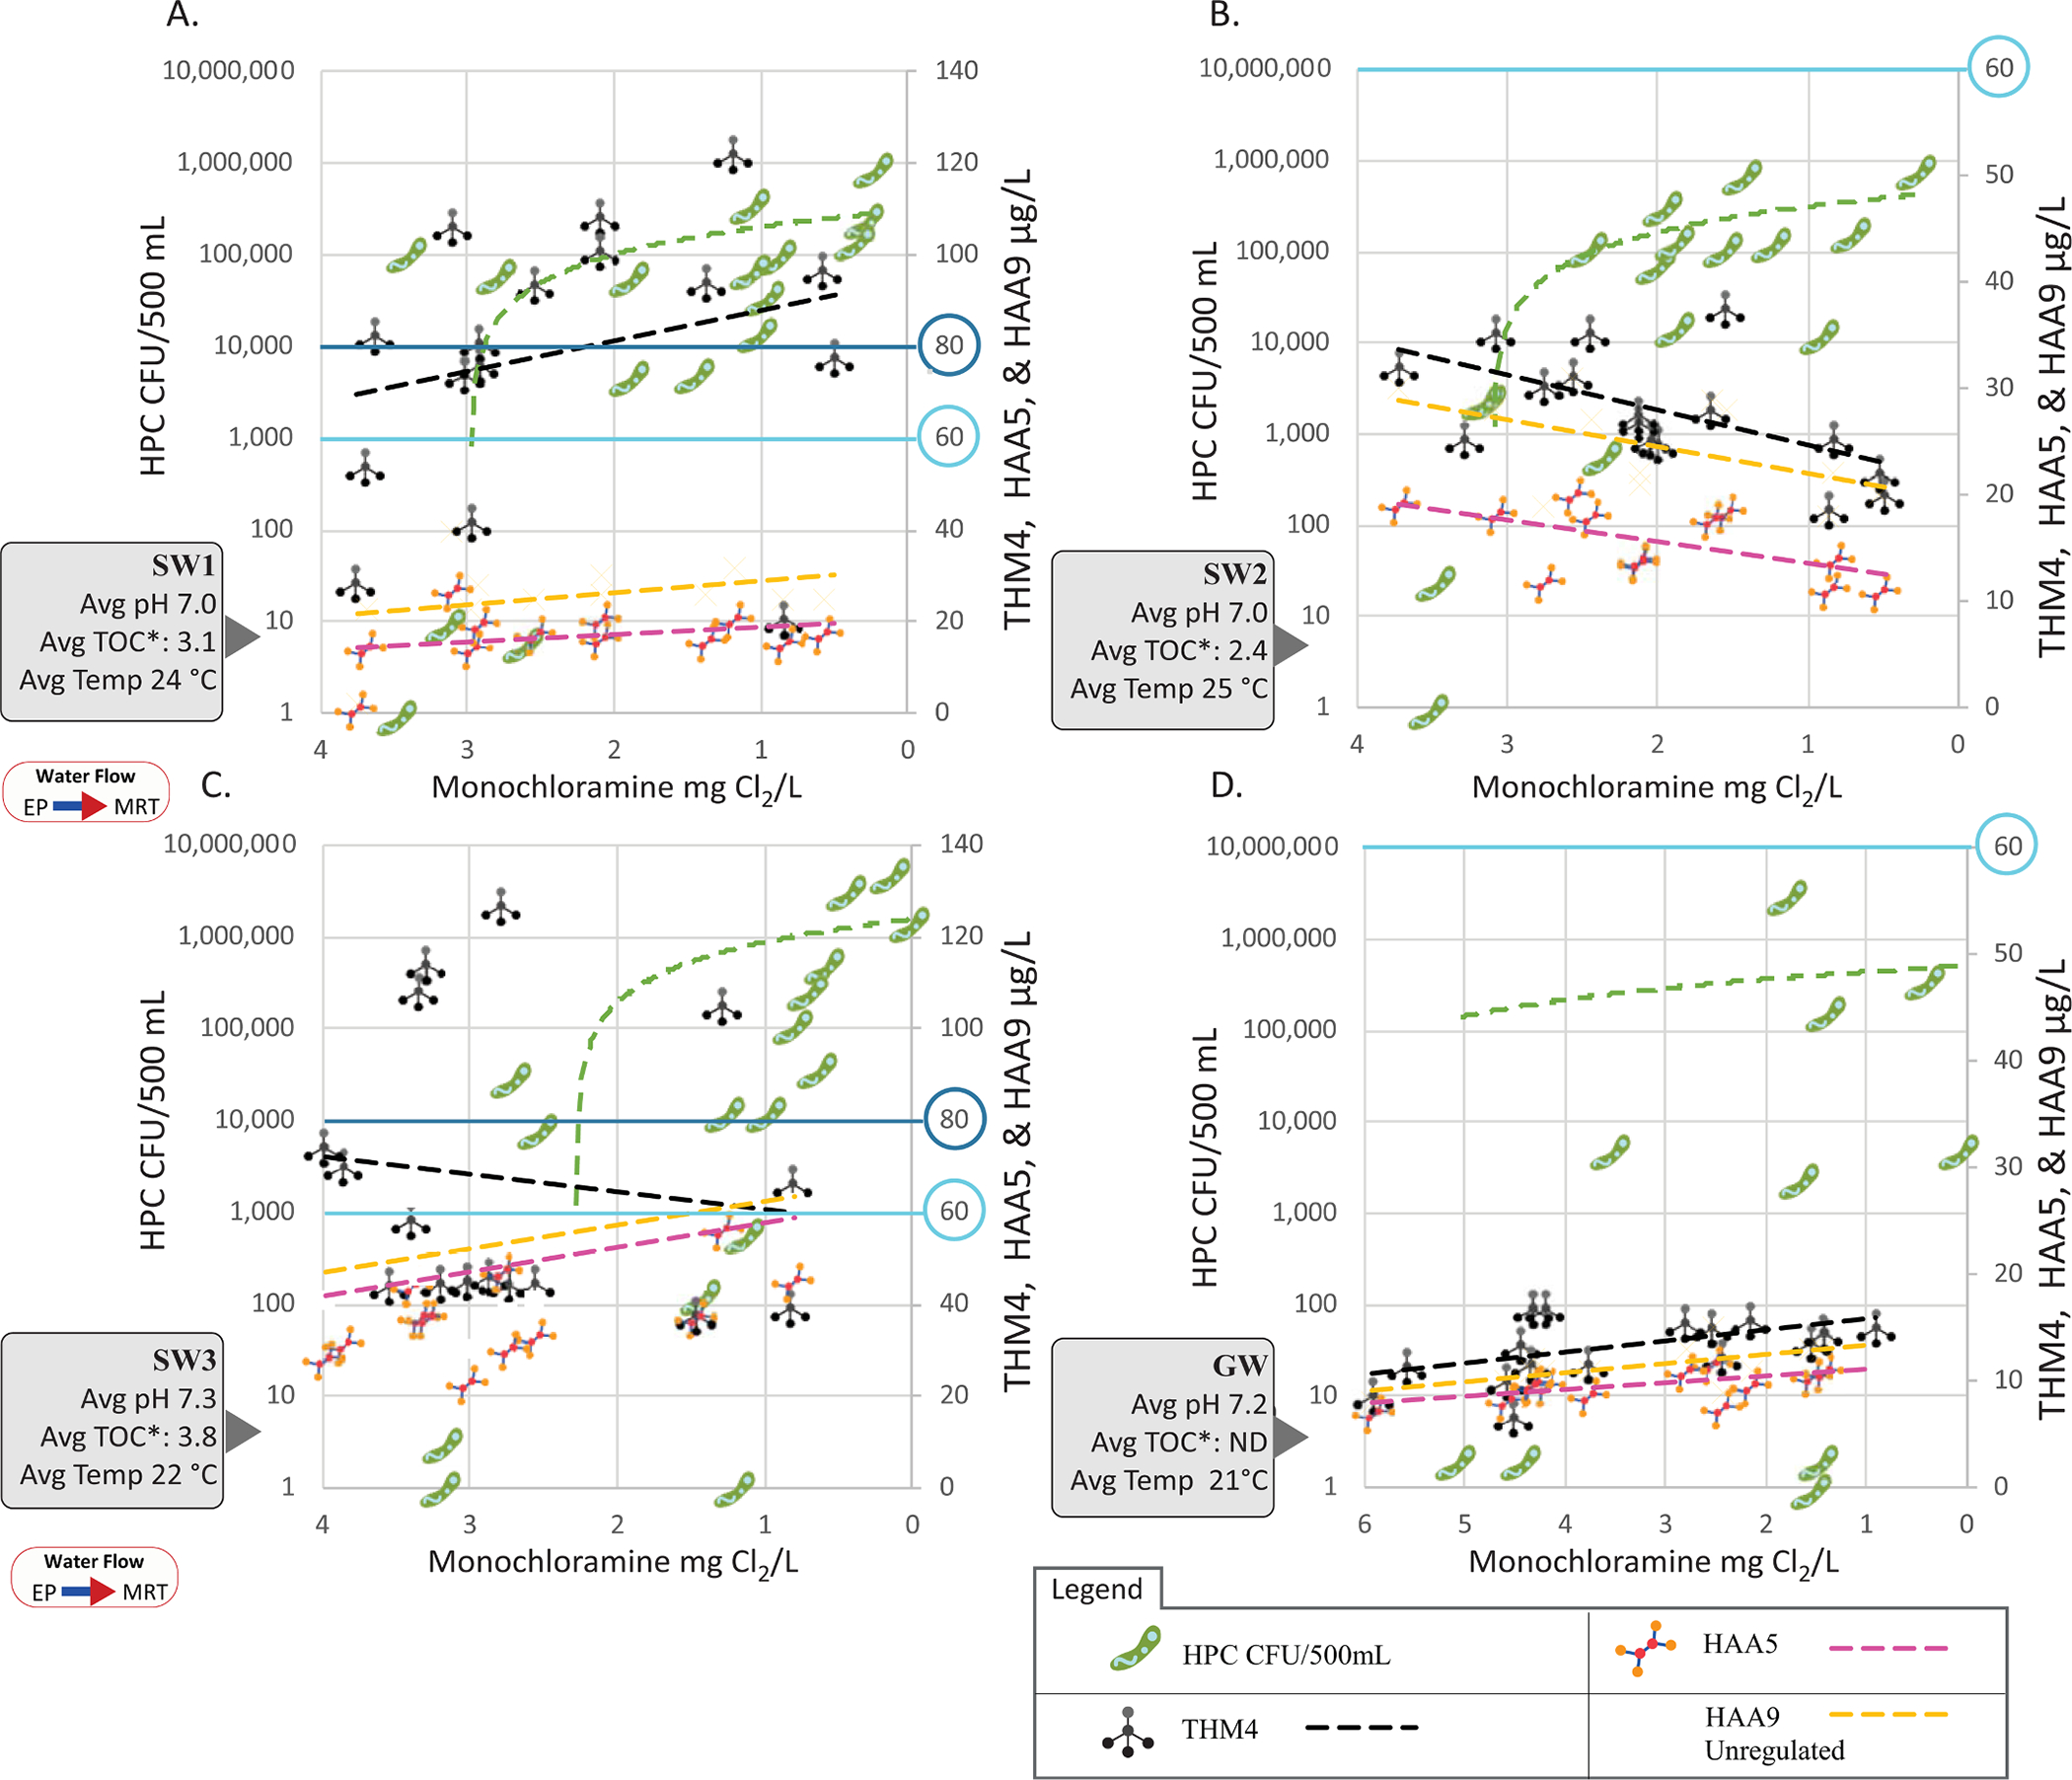
Shows monochloramine residual by heterotrophic bacteria CFU/500mL, and THM4, HAA5, and HAA9 μg/L. A.) SW1, B.) SW2, C.) SW3, and D.) GW. * TOC values were obtained from the utility’s compliance testing at the “entry point” location. THM4 and HAA5’s MCL 80 and 60 μg/L are emphasized in blue.
Unlike microbial detection, which started occurring at the ART sample location, the average THM4, HAA5, and HAA9 (unregulated) concentration percent changes between the EP and MRT sample locations were smaller (−5 to 35%) than the concentrations at the EP location. This indicated that 65% to 100% of the average THM/HAA formation occurred before the EP sample location at the treatment plant.
4. Discussion
The US EPA’s Safe Drinking Water Act (SDWA) and National Primary Drinking Water Regulations (NPDWR) contain several rules to provide drinking water guidance (US EPA 1989). The drinking water requirements on disinfectant residual and microbiological quality are in the Surface Water Treatment Rule (SWTR). In the SWTR, heterotrophic plate count (HPC) testing is an alternative method for residual testing and is used to confirm residual efficacy. The NPDWR requires drinking water systems to monitor for residuals (or HPC testing) at the same location in the distribution system and at the same time as total coliform monitoring. At the distribution “entry point,” the treated water must have a disinfectant residual of 0.2 mg Cl2/L of either total or free-chlorine. Or, if the alternative HPC testing is used, the water should have no more than 500 bacterial colonies per milliliter (≤500 CFU/mL). Otherwise, a treatment technique violation may be issued (US EPA 1989).
As the water enters the distribution system and moves to sites beyond the “entry point,” such as the ART, TANK, and MRT, the Revised Total Coliform Rule (RTCR) provides water quality criteria on total coliforms and E. coli to determine the microbiological health of the distribution network (US EPA 2013). The SWTR requirement is to maintain a “detectable” residual within the distribution system. Due to vague “detectable” terminology in the SWTR, many States have established their own enforceable residual level for water within distribution. Depending on the State, the required total- or free-chlorine residual minimum concentration can range from “detectable” to 1.5 mg Cl2/L (Wahman and Pressman 2015). This study’s utilities have a State regulatory distribution residual requirement of ≥0.5 mg Cl2/L of either total- or free-chlorine.
4.1. Residual Testing
In 1989, the NPDWR was promulgated. The McCabe et al. (1970) and Buelow and Walton (1971) studies supported the decision that measuring the disinfectant residual would be a good surrogate to gauge the microbiological water quality (Buelow and Walton 1971, McCabe et al., 1970). However, free chlorine was the major disinfectant used during this timeframe, and chloramine usage was not as common.
Monochloramine is a weaker disinfectant than free chlorine; it requires higher concentrations and longer contact times for comparable microbial inactivation (Ward et al. 1984). This study’s monochloramine average concentration at the entry point was 3.5 mg Cl2/L. All the samples taken from the EP had total-chlorine or monochloramine concentrations >0.2 mg Cl2/L. However, as expected at sampling sites beyond EP, the total-chlorine and monochloramine concentrations do decline. Only a few samples (4/36) from the TANK and MRT locations had a total-chlorine amount that fell below 0.5 mg Cl2/L, and there were eight samples’ whose monochloramine levels dropped below 0.5 mg Cl2/L. These samples were collected on the September sampling date.
This study shows that the total-chlorine and monochloramine residuals decay after entry into the distribution system. The residual degradation directly impacts the disinfectant ability to control potential waterborne pathogens. Maintaining a disinfectant residual within a distribution system is considered a treatment barrier for microbial growth. Residual testing could help the utility to i.) determine if the distribution system is properly maintained, ii.) limit the growth of heterotrophic bacteria and other microbes within the distribution system, and iii.) provide a quantitative limit that would trigger remedial action such as a unidirectional flushing event.
4.2. Residual efficacy on microorganisms
It is a long-standing practice to use HPC testing as a surrogate for overall microbial water quality (US EPA 1989). Heterotrophic bacteria are not a human health concern but serve as a useful metric for systems when evaluating microbial water quality and disinfectant efficacy; the greater the number of HPC bacteria present in the water, the poorer the microbiological water quality (Bartram et al., 2003). The SWTR’s alternative testing method criterion for HPC requires no more than 500 CFU/mL (US EPA 1989). In the EP water samples, the total chlorine and monochloramine amounts as well as the HPC counts indicated that the water’s microbiological quality met the regulatory requirements. Forty two percent (5/12) of EP samples produced culturable heterotrophic bacteria, but no EP sample had heterotrophic bacteria counts exceeding 500 CFU/mL, in SW systems. At sampling locations within distribution, 89% (32/36) of samples produced culturable heterotrophic bacteria, with 31% (11/36) of samples exceeding 500 CFU/mL. Within distribution, the average monochloramine residual was 1.9 ±0.8 mg Cl2/L (SW systems). Once the water passed the EP sample location, the disinfectant could not sufficiently prevent the growth of heterotrophic bacteria and NTM (Fig 4).
In this study, water samples whose total chlorine or monochloramine concentration was >1.5 mg Cl2/L had a 17% (5/30) or 11% (2/18) chance of exceeding the HPC 500 CFU/mL threshold. The residual and microbiological quality difference is exacerbated by viable NTM counts. Water samples with total chlorine or monochloroamine concentrations >1.5 mg Cl2/L, had a 36% (11/30) or 39% (7/18) chance of having NTM counts that exceed the NTM method’s upper limit of quantification.
NTMs are tolerant to some chemical disinfectants, especially chloramines (Jacangelo et al., 2002, Le Dantec et al., 2002, Taylor et al., 2000). Many of the NTM culture plates from sampling locations beyond the EP were Too Numerous to Count (TNTC) with isolates (>500 NTM CFU/500mL). This result strengthens the evidence that NTM grows and could have higher abundance within distribution, as reported by (Falkinham et al., 2001, Haig et al., 2020, Pryor et al., 2004, Waak et al., 2019b). Many NTM isolates were identified as M. mucogenicum and M. phocaicum, two species that are rapid-growing NTM (Supplementary Table 2). These NTM species are not strongly associated with human diseases (Griffith et al., 2007). However, these species can affect individuals who are immunocompromised (Griffith et al., 2007). The dominance of the NTM rapid growers was expected. This experience was encountered in previous US EPA NTM studies, (King et al., 2016) and (Donohue et al., 2015), especially in places where chloramine was the secondary (i.e., residual) disinfectant.
Few studies have identified NTM isolates at the species level or quantified clinically relevant NTMs such as M. abscessus and M. intracellulare in distributed water. In this study, the clinically relevant NTM species were isolated from six water samples (out of 64) using the culture method. Three samples were positive for M. abscessus and three were positive for M. intracellulare. These positive samples were at various SW systems and locations (EP, ART, and TANK) and at different sampling time points (December, March, June, and September). The molecular occurrence data showed that M. abscessus was detected in 41 samples and M. intracellulare was detected in 31 samples. Although the culture results indicated that many viable NTMs were present, it was not practicable to identify all of them at the species level. The molecular detection method was a more time- and cost- effective choice (albeit with limitations) to specifically evaluate M. abscessus and M. intracellulare occurrence and concentration (density).
A limitation with NTM culture identification is the small number of isolates per plate chosen for genomic identification. Thus, typically, only the most abundant NTM species are identified. If rapid-growing NTM species are present, they will outcompete and overtake the available agar space before any of the slow-growing clinically relevant NTM species can grow. In this study, 96% (105/109) of the isolates identified were rapid growing species, and 4% (4/109) of the isolates identified are considered slow-growing NTM species (M. intracellulare subsp. chimera and M. kansasii). (Pfaller et al., submitted) present further information on the limitations of culturing MAC organisms from environmental samples.
Fig. 6 places the M. abscessus and M. intracellulare qPCR concentrations (density) into the context of other studies that have used the same methods. Interestingly, the M. intracellulare EP median-mean concentration range aligns with another study’s reported levels (King et al., 2016). Moreover, it is noticed in Fig. 6 that for some systems, their M. abscessus and M. intracellulare ”within distribution” concentrations are on par with the concentration observed at distal end-use (Donohue et al., 2019) (Pfaller et al., submitted). Fig 6 illustrates that M. abscessus and M. intracellulare could be an issue in both distribution and premise plumbing. This current study fills a critical knowledge gap regarding where microbial growth could be occurring within distribution systems.
Figure 6.

A.) Mycobacterium abscessus and B.) M. intracellulare GU/L median-mean range (diamond) from EP and into distribution. The shaded green rectangles represent the median-mean range from other studies.
4.3. Chloramine interplay between viable bacteria and THM/HAA formation
Often, chloramines are chosen to meet the THM4 and HAA5 MCL requirements of 80 μg/L and 60 μg/L, respectively (AWWA 2018). Fig. 5 shows that each utility experienced a different THM/HAA formation or decomposition beyond EP, despite the SW systems having similar pH, TOC, and temperature measurements. The THM/HAA data illustrate that more chemical details, such as other nitrogen-containing chemicals, are needed to understand their formation within treatment and beyond into distribution. Abulikemu et al. (submitted) Abulikemu et al. (submitted) have compiled more DPB details such as non-organic chloramine formation. Nonetheless, this study’s results revealed the need to consider both microbiological and DBP aspects when disinfectant selection and treatment options are considered, since specific NTM species such as M. abscessus, M. intracellulare, and DBPs have human health effects.
5. Conclusions
The US public water landscape has changed over the past three decades. Concepts and trends observed twenty years ago might not hold true in our current environment. In addition, as utilities make decisions in response to environmental changes, population demands, or regulatory requirements, unintended consequences might not be fully realized until after the fact.
One of these unintended events might be the increased occurrence of MAC and M. abscessus in potable water. In 2006, the Stage 2 DBPR was promulgated (US EPA 2006). Mycobacterium avium Complex and M. abscessus infection report rates before and after 2006 have increased 264% and 417%: MAC rate, 3.4 (1994) to 9.0 (2014) per 100,000 persons and the M. chelonae-abscessus rate, 0.4 (1994) to 1.67 (2014) per 100,000 persons (Donohue 2018). More work is needed to fully understand if changes in potable water affect the increases in MAC and M. abscessus infectious rates. Also, other variables such as aging population demographics, soil exposure, or watershed exposure need to be evaluated. However, potable water should not be ruled out as a potential contributor to MAC disease prevalence due to a recent study linking shower usage to higher MAC disease incidence (Tzou et al., 2020). As we look to the future, microbial and DBP risks need to be examined and balanced to provide clean and safe drinking water to the communities that rely on public water supply.
6. Disclaimer
The United States Environmental Protection Agency through its Office of Research and Development funded and managed the research described here. It has been subjected to the Agency’s administrative review and approved for publication. Mention of trade names or commercial products does not constitute endorsement or recommendation for use.
Supplementary Material
Acknowledgements
The authors wish to thank the participating systems for providing valuable data for this study. The United States Environmental Protection Agency (US EPA) through its Office of Research and Development funded and conducted the research described here [Regional Applied Research Effort Program (US EPA Region 6 RARE #1645) and Safe and Sustainable Water Resources (SSWR 7.2.1)].
Footnotes
Declaration of Competing Interest
The authors declare that they have no known competing financial interests or personal relationships that could have appeared to influence the work reported in this paper.
Supplementary materials
Supplementary material associated with this article can be found, in the online version, at doi:10.1016/j.watres.2021.117689.
References
- Abulikemu G, Mistry JH, Wahman DG, Alexander MT, Kennicutt AR, Bollman JD and Pressman JG (Submitted) Investigation of chloramines, DBPs, and nitrification in chloraminated drinking water distribution systems. [DOI] [PMC free article] [PubMed]
- AWWA, 2013. Nitrification Prevention and Control in Drinking Water: American Water Works Association. American Water Works Association, Dever, CO. [Google Scholar]
- AWWA, 2017. Standard methods for the examination of water and wastewater, American Public Health Association. American Water Works Association, Washington, DC. Water Environmental Federation. [Google Scholar]
- AWWA (2018) 2017 Water Utility Disinfection Survey Report. [Google Scholar]
- Bartram J, Cotruvo JA, Exner M, Fricker C, Glasmacher A, 2003. Heterotrophic Plate Counts and Drinking-water Safety: The Significance of HPCs for Water Quality and Human Health. IWA Publishing. [Google Scholar]
- Bayless W, Andrews RC, 2008. Biodegradation of six haloacetic acids in drinking water. J Water Health 6 (1), 15–22. 10.2166/wh.2007.002. [DOI] [PubMed] [Google Scholar]
- Berman D, Rice EW, Hoff JC, 1988. Inactivation of Particle-Associated Coliforms by Chlorine and Monochloramine. Applied and Environmental Microbiology 54 (2), 507–512. 10.1128/Aem.54.2.507-512.1988. Doi. [DOI] [PMC free article] [PubMed] [Google Scholar]
- Billinger ME, Olivier KN, Viboud C, de Oca RM, Steiner C, Holland SM, Prevots DR, 2009. Nontuberculous mycobacteria-associated lung disease in hospitalized persons, United States, 1998–2005. Emerg Infect Dis 15 (10), 1562–1569. 10.3201/eid1510.090196. [DOI] [PMC free article] [PubMed] [Google Scholar]
- Buelow RW, Walton G, 1971. Bacteriological Quality Vs Residual Chlorine. Journal American Water Works Association 63 (1), 28–&. [Google Scholar]
- Coffin JC, Ge R, Yang S, Kramer PM, Tao L, Pereira MA, 2000. Effect of trihalomethanes on cell proliferation and DNA methylation in female B6C3F1 mouse liver. Toxicol Sci 58 (2), 243–252. 10.1093/toxsci/58.2.243. [DOI] [PubMed] [Google Scholar]
- Collier SA, Deng L, Adam EA, Benedict KM, Beshearse EM, Blackstock AJ, Bruce BB, Derado G, Edens C, Fullerton KE, Gargano JW, Geissler AL, Hall AJ, Havelaar AH, Hill VR, Hoekstra RM, Reddy SC, Scallan E, Stokes EK, Yoder JS, Beach MJ, 2021. Estimate of Burden and Direct Healthcare Cost of Infectious Waterborne Disease in the United States. Emerg Infect Dis 27 (1), 140–149. 10.3201/eid2701.190676. [DOI] [PMC free article] [PubMed] [Google Scholar]
- Donohue MJ, 2018. Increasing nontuberculous mycobacteria reporting rates and species diversity identified in clinical laboratory reports. BMC Infect Dis 18 (1), 163. 10.1186/s12879-018-3043-7. [DOI] [PMC free article] [PubMed] [Google Scholar]
- Donohue MJ, Mistry JH, Donohue JM, O’Connell K, King D, Byran J, Covert T, Pfaller S, 2015. Increased Frequency of Nontuberculous Mycobacteria Detection at Potable Water Taps within the United States. Environmental Science & Technology 49 (10), 6127–6133. 10.1021/acs.est.5b00496. [DOI] [PubMed] [Google Scholar]
- Donohue MJ, Vesper S, Mistry J, Donohue JM, 2019. Impact of Chlorine and Chloramine on the Detection and Quantification of Legionella pneumophila and Mycobacterium Species. Appl Environ Microbiol 85 (24). 10.1128/AEM.01942-19. [DOI] [PMC free article] [PubMed] [Google Scholar]
- Dunnick JK, Melnick RL, 1993. Assessment of the Carcinogenic Potential of Chlorinated Water - Experimental Studies of Chlorine, Chloramine, and Trihalomethanes. Journal of the National Cancer Institute 85 (10), 817–822. 10.1093/jnci/85.10.817. [DOI] [PubMed] [Google Scholar]
- Falkinham JO 3rd, Norton CD, LeChevallier MW, 2001. Factors influencing numbers of Mycobacterium avium, Mycobacterium intracellulare, and other Mycobacteria in drinking water distribution systems. Appl Environ Microbiol 67 (3), 1225–1231. 10.1128/AEM.67.3.1225-1231.2001. [DOI] [PMC free article] [PubMed] [Google Scholar]
- Gomez-Alvarez V, Revetta RP, Santo Domingo JW, 2012. Metagenomic analyses of drinking water receiving different disinfection treatments. Appl Environ Microbiol 78 (17), 6095–6102. 10.1128/AEM.01018-12. [DOI] [PMC free article] [PubMed] [Google Scholar]
- Griffith DE, Aksamit T, Brown-Elliott BA, Catanzaro A, Daley C, Gordin F, Holland SM, Horsburgh R, Huitt G, Iademarco MF, Iseman M, Olivier K, Ruoss S, von Reyn CF, Wallace RJ Jr., Winthrop K, Subcommittee ATSMD, American Thoracic S, Infectious Disease Society of A, 2007. An official ATS/IDSA statement: diagnosis, treatment, and prevention of nontuberculous mycobacterial diseases. Am J Respir Crit Care Med 175 (4), 367–416. 10.1164/rccm.200604-571ST. [DOI] [PubMed] [Google Scholar]
- Haig SJ, Kotlarz N, Kalikin LM, Chen T, Guikema S, LiPuma JJ, Raskin L, 2020. Emerging investigator series: bacterial opportunistic pathogen gene markers in municipal drinking water are associated with distribution system and household plumbing characteristics. Environmental Science-Water Research & Technology 6 (11), 3032–3043. 10.1039/d0ew00723d. [DOI] [Google Scholar]
- Henkle E, Hedberg K, Schafer S, Novosad S, Winthrop KL, 2015. Population-based Incidence of Pulmonary Nontuberculous Mycobacterial Disease in Oregon 2007 to 2012. Ann Am Thorac Soc 12 (5), 642–647. 10.1513/AnnalsATS.201412-559OC. [DOI] [PMC free article] [PubMed] [Google Scholar]
- Herren-Freund SL, Pereira MA, Khoury MD, Olson G, 1987. The carcinogenicity of trichloroethylene and its metabolites, trichloroacetic acid and dichloroacetic acid, in mouse liver. Toxicol Appl Pharmacol 90 (2), 183–189. 10.1016/0041-008x(87)90325-5. [DOI] [PubMed] [Google Scholar]
- IARC, 1991. Chlorinated drinking-water; Chlorination byproduts. International Agency for Research on Cancer, Lyon, France. [Google Scholar]
- Jacangelo JG, Patania NL, Trussel RR, Haas CN, C, G., 2002. Inactivation of waterborne emerging pathogens by selected disinfectants. The Water Reseach Foundation, Denver, CO. [Google Scholar]
- Jafvert CT, Valentine RL, 1992. Reaction Scheme for the Chlorination of Ammoniacal Water. Environmental Science & Technology 26 (3), 557–586. 10.1021/es00027a022doi/pdf/. [DOI] [Google Scholar]
- Jolley RL, Condie LW, Johnson DJ, Katz S, Minear RA, Mattice JS, Jacobs VA, 1990. Water chlorination: Chemistry, Envronmental Impact and Health Effect. Lewis Publisher, Michigan. [Google Scholar]
- King DN, Donohue MJ, Vesper SJ, Villegas EN, Ware MW, Vogel ME, Furlong EF, Kolpin DW, Glassmeyer ST, Pfaller S, 2016. Microbial pathogens in source and treated waters from drinking water treatment plants in the United States and implications for human health. Sci Total Environ 562, 987–995. 10.1016/j.scitotenv.2016.03.214. [DOI] [PubMed] [Google Scholar]
- Le Dantec C, Duguet JP, Montiel A, Dumoutier N, Dubrou S, Vincent V, 2002. Chlorine disinfection of atypical mycobacteria isolated from a water distribution system. Appl Environ Microbiol 68 (3), 1025–1032. [DOI] [PMC free article] [PubMed] [Google Scholar]
- Lee WH, Pressman JG, Wahman DG, 2018. Three-Dimensional Free Chlorine and Monochloramine Biofilm Penetration: Correlating Penetration with Biofilm Activity and Viability. Environmental Science & Technology 52 (4), 1889–1898. 10.1021/acs.est.7b05215. [DOI] [PMC free article] [PubMed] [Google Scholar]
- Luh J, Tong N, Raskin L, Marinas BJ, 2008. Inactivation of Mycobacterium avium with monochloramine. Environmental Science & Technology 42 (21), 8051–8056. [DOI] [PubMed] [Google Scholar]
- McCabe LJ, Symons JM, Lee RD, Robeck GG, 1970. Survey of Community Water Supply Systems. Journal American Water Works Association 62 (11), 670–&. [Google Scholar]
- O’Brien RJ, Geiter LJ, Snider DE Jr., 1987. The epidemiology of nontuberculous mycobacterial diseases in the United States. Results from a national survey. Am Rev Respir Dis 135 (5), 1007–1014. [DOI] [PubMed] [Google Scholar]
- Perkins KM, Reddy SC, Fagan R, Arduino MJ, Perz JF, 2019. Investigation of healthcare infection risks from water-related organisms: Summary of CDC consultations, 2014–2017. Infect Control Hosp Epidemiol 40 (6), 621–626. 10.1017/ice.2019.60. [DOI] [PMC free article] [PubMed] [Google Scholar]
- Pfaller S, King D, Mistry JH and Donohue MJ (Submitted). Occurrence Revisited: Mycobacterium avium and Mycobacterium intracellulare in Potable Water in the United States. [DOI] [PMC free article] [PubMed]
- Prevots DR, Shaw PA, Strickland D, Jackson LA, Raebel MA, Blosky MA, Montes de Oca R, Shea YR, Seitz AE, Holland SM, Olivier KN, 2010. Nontuberculous mycobacterial lung disease prevalence at four integrated health care delivery systems. Am J Respir Crit Care Med 182 (7), 970–976. 10.1164/rccm.201002-0310OC. [DOI] [PMC free article] [PubMed] [Google Scholar]
- Pryor M, Springthorpe S, Riffard S, Brooks T, Huo Y, Davis G, Satter SA, 2004. Investigation of opportunistic pathogens in municipal drinking water under different supply and treatment regimes. Water Science and Technology 50 (1), 83–90. [PubMed] [Google Scholar]
- Steindor M, Nkwouano V, Mayatepek E, Mackenzie CR, Schramm D, Jacobsen M, 2015. Rapid detection and immune characterization of Mycobacterium abscessus infection in cystic fibrosis patients. PLoS One 10 (3), e0119737. 10.1371/journal.pone.0119737. [DOI] [PMC free article] [PubMed] [Google Scholar]
- Taylor RH, Falkinham JO 3rd, Norton CD, LeChevallier MW, 2000. Chlorine, chloramine, chlorine dioxide, and ozone susceptibility of Mycobacterium avium. Appl Environ Microbiol 66 (4), 1702–1705. [DOI] [PMC free article] [PubMed] [Google Scholar]
- Tzou CL, Dirac MA, Becker AL, Beck NK, Weigel KM, Meschke JS, Cangelosi GA, 2020. Association between Mycobacterium avium Complex Pulmonary Disease and Mycobacteria in Home Water and Soil. Ann Am Thorac Soc 17 (1), 57–62. 10.1513/AnnalsATS.201812-915OC. [DOI] [PMC free article] [PubMed] [Google Scholar]
- US EPA, 1989. National Primary Drinking water Regulation; Filtration, Disinfection, Turbidity, Giardia lambia, Viruses, Legionella, and Heterotrophic Bacteria. Federal Register, Washington DC, p. 27486. [Google Scholar]
- US EPA, 1998. National Primary Drinking Water Regulations: Disinfectant and Disinfection by Product. Final Rule. Federal Rigister, Washington DC, p. 69390. [Google Scholar]
- US EPA, 2006. National Primary Drinking Water Regulations: Stage 2 Disinfectants and Disinfection Byproducts Rule; Final Rule. Federal Rigister, Washington DC, pp. 387–493. [Google Scholar]
- US EPA, 2013. National Primary Drinking Water Regulations: Revisions to the Total Coliform Rules (RTCR); Final Rule. Federal Rigister, Washington DC. [Google Scholar]
- US EPA, 2016. Revisions to the Unregulated Contaminant Monitoring Rule (UCMR 4) for Public Water Systems and Announcement of Public Meeting. Federal Rigister, Washington DC. [Google Scholar]
- US EPA, 2017. National Primary Drinking Water Regulations; Announcement of the Results of EPA’s Review of Existing Drinking Water Standards and Request for Public Comment and/or Information on Related Issues. Federal Registery, Washington DC. [Google Scholar]
- Waak MB, Hozalski RM, Halle C, LaPara TM, 2019a. Comparison of the microbiomes of two drinking water distribution systems-with and without residual chloramine disinfection. Microbiome 7 (1), 87. 10.1186/s40168-019-0707-5. [DOI] [PMC free article] [PubMed] [Google Scholar]
- Waak MB, LaPara TM, Halle C, Hozalski RM, 2019b. Nontuberculous Mycobacteria in Two Drinking Water Distribution Systems and the Role of Residual Disinfection. Environ Sci Technol 53 (15), 8563–8573. 10.1021/acs.est.9b01945. [DOI] [PubMed] [Google Scholar]
- Wahman DG, Henry AE, Katz LE, Speitel GE Jr., 2006. Cometabolism of trihalomethanes by mixed culture nitrifiers. Water Research 40 (18), 3349–3358. 10.1016/j.watres.2006.07.033. [DOI] [PubMed] [Google Scholar]
- Ward NR, Wolfe RL, Olson BH, 1984. Effect of pH, application technique, and chlorine-to-nitrogen ratio on disinfectant activity of inorganic chloramines with pure culture bacteria. Appl Environ Microbiol 48 (3), 508–514. [DOI] [PMC free article] [PubMed] [Google Scholar]
- Waters TE, Alexander MT, Wahman DG, 2021. Temperature impact on monochloramine, free ammonia, and free chlorine indophenol methods. Water Pract Technol 16 (1), 135–145. 10.2166/wpt.2020.104. [DOI] [PMC free article] [PubMed] [Google Scholar]
- Winthrop KL, Marras TK, Adjemian J, Zhang H, Wang P, Zhang Q, 2020. Incidence and Prevalence of Nontuberculous Mycobacterial Lung Disease in a Large U.S. Managed Care Health Plan, 2008–2015. Ann Am Thorac Soc 17 (2), 178–185. 10.1513/AnnalsATS.201804-236OC. [DOI] [PMC free article] [PubMed] [Google Scholar]
- Zhang Y, Ye H, Zhou L, Hu L, 2013. Influence of chlorine-to-nitrogen ratio on the inactivation of heterotrophic bacteria in bulk water during chloramination. Water Environ Res 85 (6), 568–573 doi: 10.2175/106143013×13596524516932. [DOI] [PubMed] [Google Scholar]
Associated Data
This section collects any data citations, data availability statements, or supplementary materials included in this article.