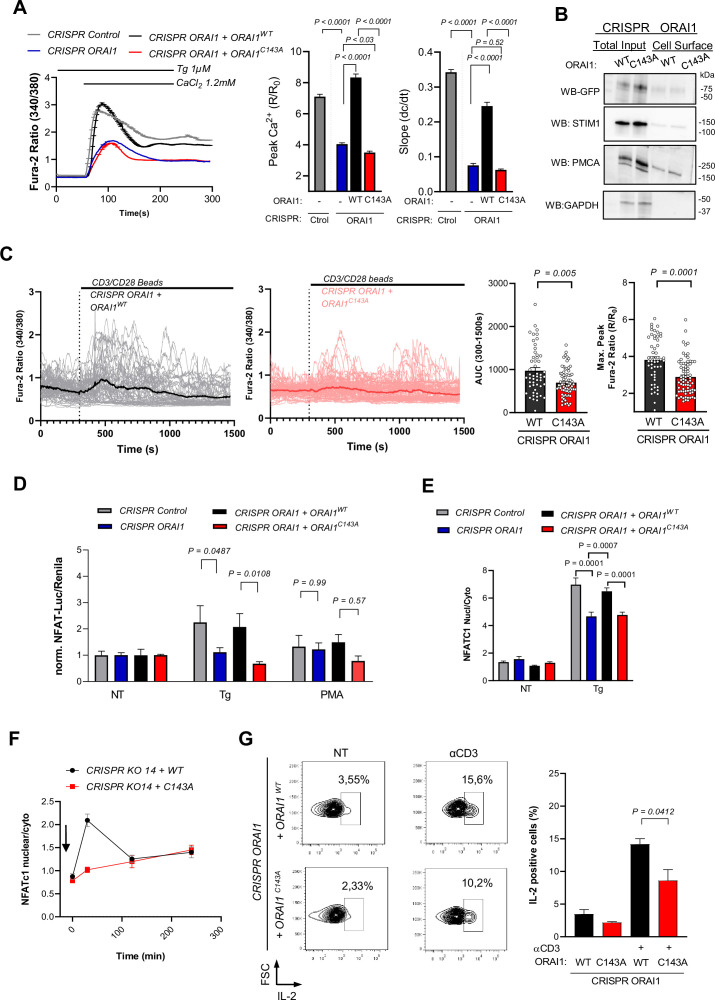
Figure 5. ORAI1 S-acylation promotes Jurkat T cell activation.
(A) Averaged fura-2 responses, their peak amplitude (middle graph bar) and slope (right graph bar) evoked by Ca2+ re-addition in Tg treated (1 µM, 8 min) Jurkat cells lines generated by CRISPR with control or ORAI1-targeted guiding sequences and stably re-expressing either WT or C143A ORAI1-YFP. Data are mean ± SEM of 210 (Control), 242 (KO), 189 (WT), and 203 (C143A) cells from three independent experiments (B) Western blot showing the amount of biotinylated GFP immunoreactivity in the PM in Jurkat CRISPR ORAI1 cells reconstituted with WT or C143A ORAI1-YFP. Representative of 2 independent experiments. (C) Individual (thin lines) and averaged (thick line) fura-2 recordings of Jurkat CRISPR ORAI1 cells reconstituted with WT or C143A ORAI1-YFP, exposed to CD3/CD28-coated beads in Ca2+ containing solution (left). Averaged peak and integrated responses evoked by CD3/CD28 beads in individual cells during the recording period (right). Data are from 52 cells (WT) and 72 cells (C143A) from three independent experiments. (D) Relative changes in NFATC-Luciferase vs. housekeeping- Renilla luminescence evoked in 4 h by Tg (1 µM) and PMA (100 nM) in the indicated cell lines. Data are mean ± SEM of 8–12 biological replicates from three independent experiments. (E) Endogenous NFATC1 translocation evoked in 4 hr by Tg (1 µM) in the indicated cell lines, measured by immunofluorescence. Data are mean ± SEM of the nuclear to cytosol NFATC1 intensity ratio of 58–161 cells from four independent experiments. (F) Time-course of NFATC1 translocation evoked by plates coated with CD3 (OKT3 1 µg/ml). Data are mean ± SEM of 86–161 cells from five independent experiments. (G) IL-2 production evoked by untreated (NT) or surface coated CD3 (OKT3 1 µg/ml). Left, Representative density dot plots of Jurkat cells stained for IL-2. Graph bars represent the mean ± SEM of three independent experiments. One-way ANOVA Dunnett’s multiple comparisons test (A), Sidak multiple comparisons test (D and E), two-tailed unpaired Student’s t-test (C and G).
Figure 5—figure supplement 1. Sequences of genomic DNA used to generate the CRISPR ORAI1 Jurkat T cell lines (top) and FLAG or ORAI1 immunoblot of Jurkat T cells expressing FLAG-tagged Cas9 (bottom), WB are representative of two independent experiments.
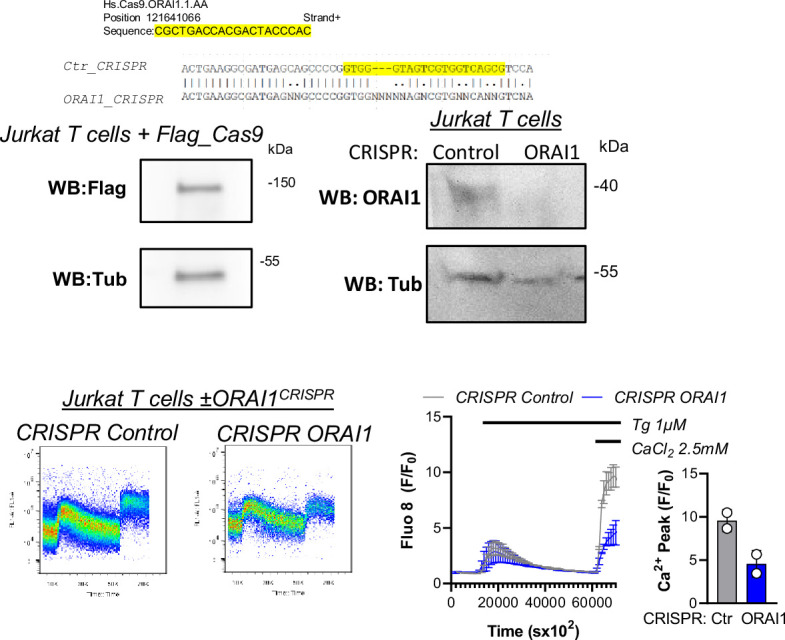
Figure 5—figure supplement 2. Fluorescence intensity profiles of CRISPR ORAI1 cells reconstituted with WT and C143 ORAI1-YFP measured by flow cytometry (N = 4).
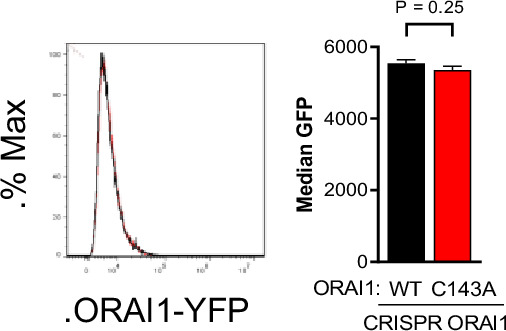
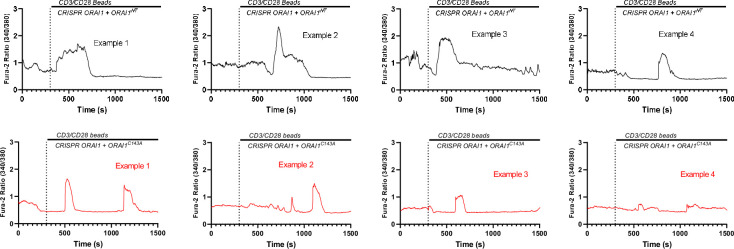
Figure 5—figure supplement 3. Representative Fura2 recordings of the responses evoked by CD3/CD28-coated beads in Jurkat CRISPR ORAI1 cells reconstituted with WT or C143A ORAI1-YFP (from Fig.Figure 5C).
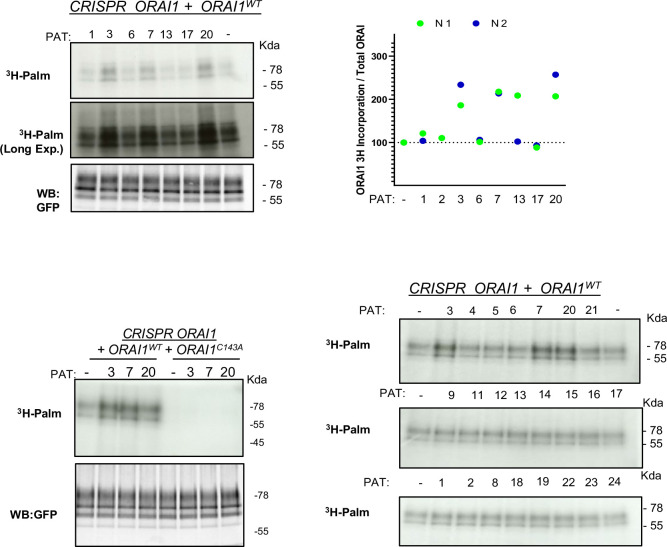
Figure 5—figure supplement 4. Top left blot indicates the3H-palmitate incorporation in ORAI1-deficient Jurkat T cells reconstituted with WT ORAI1-YFP transiently expressing the indicated PAT isoforms.
Figure 5—figure supplement 5. Averaged SOCE responses (left) and peak SOCE amplitude (middle) measured with YC3.6 in WT or ORAI1-deficient Jurkat T cells expressing PAT20 or a control plasmid.
Figure 5—figure supplement 6. NFATC1 immunoreactivity of ORAI1-deficient Jurkat T cells reconstituted with WT and C143 ORAI1-YFP treated with Tg 1 µM for 4 hr to induce nuclear translocation of NFATC1.
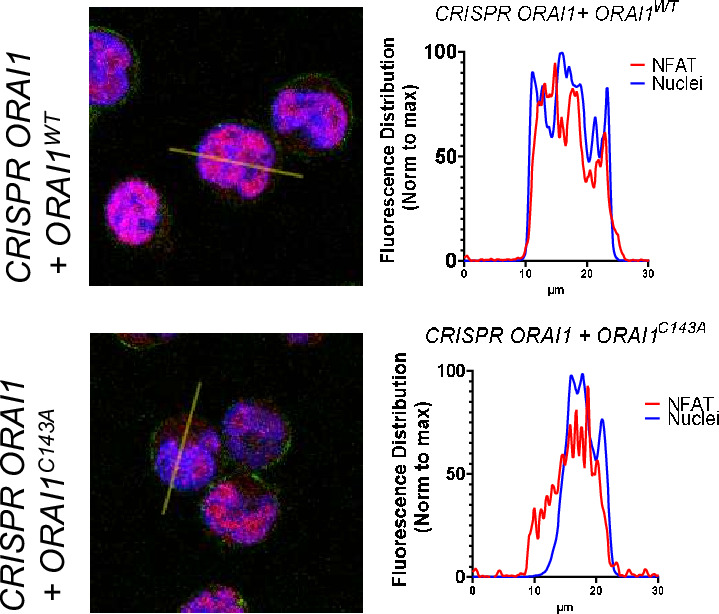
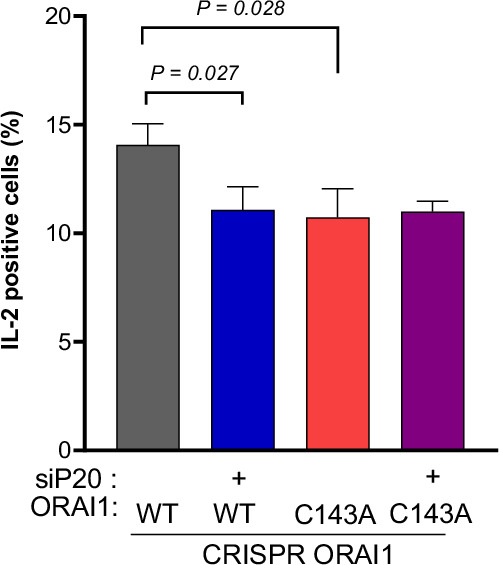
Figure 5—figure supplement 7. Fraction of IL-2 positive ORAI1-deficient Jurkat T cells reconstituted with WT or C143A ORAI1-YFP and transfected with si-Scr and si-PAT20 adhered 24 hr on plates coated with CD3 (1 µg/ml).
