

Abstract
Tuberculosis (TB) is the leading infectious cause of death among people living with HIV (PLHIV). PLHIV are more susceptible to contracting Mycobacterium tuberculosis (Mtb) and often have worsened TB disease. Understanding the immunologic defects caused by HIV and the consequences it has on Mtb co-infection is critical in combating this global health epidemic. We previously showed in a model of simian immunodeficiency virus (SIV) and Mtb co-infection in Mauritian cynomolgus macaques (MCM) that SIV/Mtb co-infected MCM had rapidly progressive TB. We hypothesized that pre-existing SIV infection impairs early T cell responses to Mtb infection. We infected MCM with SIVmac239 followed by co-infection with Mtb Erdman 6 months later. While similar TB progression was observed in both SIV+ and SIV-naïve animals at six weeks post-Mtb infection, longitudinal sampling of the blood (PBMC) and airways (BAL) revealed a significant reduction in circulating CD4+ T cells and an influx of CD8+ T cells in airways of SIV+ animals. At sites of Mtb infection (i.e. granulomas), SIV/Mtb co-infected animals had a higher proportion of CD4+ and CD8+ T cells expressing PD-1 and TIGIT. In addition, there were fewer TNF-producing CD4+ T cells in granulomas of SIV/Mtb co-infected animals. Taken together, we show that concurrent SIV infection alters T cell phenotypes in granulomas during the early stages of TB disease. As it is critical to establish control of Mtb replication soon after infection, these phenotypic changes may distinguish the immune dysfunction that arises from pre-existing SIV infection which promotes TB progression.
Introduction
Tuberculosis (TB) is a major global health concern, especially among people living with HIV (PLHIV). TB, caused by the bacterium Mycobacterium tuberculosis (Mtb), is the leading cause of death worldwide among PLHIV, accounting for one-third of AIDS deaths (1). PLHIV are incredibly susceptible to Mtb and have a 20-fold greater risk of developing TB than HIV-naïve individuals (1). PLHIV have a greater risk of both developing active TB disease or reactivating a latent TB infection (2, 3). The risk for contracting bacterial infections, including Mtb, is higher in PLHIV even before circulating CD4+ T cell counts fall (4–7), although susceptibility rapidly increases as CD4+ T cell counts decline (8). Furthermore, the TB risk remains elevated even after individual are put on antiretroviral therapy (9). Thus, there is a critical need to identify more precisely the underlying mechanisms by which pre-existing HIV infection impairs the immune response to Mtb.
Knowledge gaps remain in our understanding of early immune events following Mtb infection (10). T cells are an important component of the adaptive immune response and play a critical role in controlling Mtb (11, 12). In both humans (13) and non-human primates (NHP) (14), T cell responses to Mtb take several weeks to fully develop (13). However, early responses to Mtb and how they are affected by HIV is difficult to study in humans as the exact time points of both HIV and/or Mtb infection are often unknown. NHP are an ideal model in which to study interactions between HIV and TB. NHP are susceptible to SIV infection, a simian surrogate for HIV, and they closely recapitulate key features of TB disease in humans (15–20). They offer wider access to tissues often inaccessible in human studies and provide insight into localized immunologic responses that are not necessarily reflected in blood (21–24).
Several NHP studies of the effect of SIV infection on reactivation of latent TB infection showed that SIV decreased CD4+ T cells in lungs, dysregulated cytokine responses, increased Mtb dissemination and elevated rates of TB reactivation (25–31). However, fewer studies have investigated the effects of pre-existing SIV infection on the outcome of Mtb co-infection. In animals with an acute SIV infection (6 weeks) followed by Mtb co-infection, TB disease was more severe and SIV+ animals succumbed to their disease much earlier than their counterparts infected with Mtb only (32). Early mortality in SIV-infected animals also has been reported following M. bovis co-infection (33, 34). SIV infection, whether in the context of pre-existing latent TB infection or prior to Mtb co-infection, impairs the immune system and leads to more extensive and severe TB disease. However, the precise nature of this immunologic impairment, as well as the mechanisms by which it occurs, have yet to be fully elucidated.
We recently established a model of SIV and Mtb co-infection in Mauritian cynomolgus macaques (MCM) (35). We showed that animals with a pre-existing SIV infection exhibited rapid TB progression upon co-infection with Mtb and reached clinical endpoint considerably sooner (9 – 13 weeks post-Mtb co-infection) than SIV-naïve animals. Strikingly, the number of pulmonary granulomas detected by PET/CT imaging increased significantly between 4 and 8 weeks following Mtb co-infection in SIV+ animals, while the numbers remained more stable SIV-naïve animals (35). This timeframe also corresponds to the period when the T cell response to Mtb infection of NHP develops fully (14). We thus hypothesized that the period between 4 and 8 weeks after Mtb co-infection may be the critical window during which immunologic defects associated with pre-existing SIV infection manifest to alter the trajectory of the TB disease.
Here, we characterized differences in conventional CD4+ and CD8+ T cell responses at 6 weeks after Mtb infection in SIV-naïve and SIV+ MCM, at a time that corresponds to when the trajectory of TB disease began to diverge in SIV-naïve and SIV+ MCM (35). By 6 weeks post-infection, the adaptive immune response against Mtb has developed (14, 19) and granulomas are just beginning to acquire mycobacterial killing capacity (36). This time point also precedes the appearance of extensive necrosis and other immunopathologies associated with advanced TB that would confound immunologic analysis of T cell responses. We investigated changes in conventional T cells across several compartments: the airways, where Mtb is first encountered; blood, a reflection of cell trafficking and circulating immune cells that is easily sampled; and lung tissue including individual granulomas, as local sites of Mtb infection. We observed a decrease in the CD4:CD8 ratio across all these compartments in SIV+ animals. SIV infection led to T cell activation in mucosal tissue as indicated by increased frequencies of PD-1 and TIGIT expression on CD4+ T cells and, to a lesser extent, on CD8+ T cells, in lung tissue and granulomas. Lastly, there were fewer TNF-producing CD4+ T cells in granulomas from SIV/Mtb co-infected animals compared to animals infected with Mtb alone. Taken together, these data provide novel insights into the mechanism by which SIV dysregulates the adaptive immune response to Mtb infection that may promote TB progression.
Materials and Methods
Animal care
Adult (>4 years of age) Mauritian cynomolgus macaques (Macaca fascicularis; MCM) were obtained from Bioculture, Ltd. (Mauritius). MCM with at least one copy of the M1 MHC haplotype were selected for this study (37–39).
MCM that underwent Mtb infection (n=19) were handled and cared for at the University of Pittsburgh (U.Pitt.). MCM were housed in a BSL2+ animal facility during SIV infection and then moved into a BSL3+ facility within the U.Pitt. Regional Biocontainment Laboratory for Mtb infection. Animal protocols and procedures were approved by the U.Pitt. Institutional Animal Care and Use Committee (IACUC) which adheres to guidelines established in the Animal Welfare Act and the Guide for the Care and Use of Laboratory Animals, and the Weatherall report (8th Edition). The university is fully accredited by AAALAC (accreditation number 000496), and its OLAW animal welfare assurance number is D16-00118. The U.Pitt. IACUC reviewed and approved the IACUC study protocols 18032418 and 15035401, under Assurance Number A3187-01.
Four additional MCM were infected with SIV alone at the Wisconsin National Primate Research Center (WNPRC), where they were cared for in accordance with the regulations, guidelines, and recommendations outlined in the Animal Welfare Act, the Guide for the Care and Use of Laboratory Animals, and the Weatherall Report. The University of Wisconsin-Madison (UW-Madison), College of Letters and Science and Vice Chancellor for Research and Graduate Education Centers IACUC-approved the NHP research covered under IACUC protocol G005507. The UW-Madison Institutional Biosafety Committee approved this work under protocol B00000205.
SIV and Mtb infection of MCM
At U. Pitt., animals in the SIV/Mtb co-infection group (n = 8; all male) were infected intrarectally with 3,000 TCID50 of SIVmac239, as before (35). After 6 months, the animals were co-infected with a low dose (3 – 19 CFU) of Mtb (Erdman strain) via bronchoscopic instillation, as described previously (40). Animals in the SIV-naïve group (n =11; 7 males and 4 females) were infected similarly with Mtb alone. Six weeks post-Mtb infection animals were humanely euthanized as described above.
At UW-Madison, 4 MCM (all male) were infected intrarectally with 3,000 TCID50 SIVmac239. Six months after infection, animals were humanely euthanized as above.
Clinical and microbiological monitoring
All animals were assessed twice daily for general health. Upon infection (or co-infection) with Mtb, animals were monitored closely for clinical signs of TB (coughing, weight loss, tachypnea, dyspnea, etc.). Monthly gastric aspirates and bronchoalveolar lavage (BAL) samples were tested for Mtb growth. Blood was drawn at regular intervals to measure erythrocyte sedimentation rate (ESR) and to serve as a source of peripheral blood mononuclear cells (PBMC) as well as plasma. In this study, no animal reached our humane endpoint criteria that included weight loss of >10%, prolonged cough, sustained increased respiratory rate or effort, and/or marked lethargy.
Bacterial burden
To determine the number of live Mtb bacilli present in the lungs of each animal, a systematic approach (41) was used to plate tissue homogenates from every lung lesion, including both individual granulomas and complex pathologies such as consolidations, as well as from random pieces of grossly unaffected lung. Homogenates were plated on 7H11 medium agar (BD Difco), and Mtb CFU were enumerated after 21 days of incubation at 37°C and 5% CO2. Total lung bacterial load was calculated as described previously (41). The total thoracic lymph node bacterial load was determined by harvesting all thoracic lymph nodes, regardless of whether pathology was grossly apparent, and plating as described above. The CFU from each sample were summed to yield total thoracic lymph node bacterial load. Summing the total lung and total thoracic lymph node CFU provided the total thoracic bacterial burden (41).
Sample collection
PBMC were isolated from whole blood drawn into Vacutainer tubes with EDTA (Becton Dickenson) at regular time points. Whole blood was centrifuged and plasma saved at −80°C for viral load analysis. Pellets were resuspended in phosphate-buffered saline (PBS; Lonza BioWhittaker) and layered over an equal volume of Ficoll (GE Healthcare). After centrifugation, the buffy coat was separated and washed with PBS. Contaminating red blood cells were lysed with Pharm Lyse (BD Biosciences). PBMC were resuspended in freezing medium containing 10% dimethyl sulfoxide and fetal bovine serum.
BAL was performed at time points throughout the course of SIV and/or Mtb infection by lavaging the airways up to four times with 10 mL of saline. The recovered sample was pelleted and BAL fluid was saved at −80°C. Pellets were resuspended in PBS, cells were enumerated using a hemocytometer and then immediately used for flow cytometry staining.
Necropsies were performed as previously described (35) at 6 weeks after Mtb infection. Within 3 days of necropsy, a final FDG PET/CT scan was performed to document disease progression and to provide a “roadmap” for collecting individual granulomas (41). Animals were heavily sedated with ketamine, maximally bled, and humanely euthanized using sodium pentobarbital (Beuthanasia, Schering-Plough, Kenilworth, NJ). Granulomas matched to the final PET/CT images were harvested along with other TB pathologies (e.g., consolidations and pneumonia), thoracic and extrathoracic lymph nodes, and lung tissue (uninvolved or involved as determined post facto by Mtb culture), as well as portions of liver, spleen, mesenteric lymph nodes, ileum, and colon. Quantitative gross pathology scores were calculated to reflect overall TB disease burden for each animal (41). Tissue samples were divided and a portion was fixed in 10% neutral buffered formalin for histopathology and the remainder was homogenized to a single-cell suspension as described previously (41). Total cell counts of these single-cell suspensions were determined using a hemocytometer.
Flow cytometry
To assess conventional CD4+ and CD8+ T cells, cells from PBMC, BAL, lung tissue, lymph nodes, and granulomas were stained as previously described (42). Cell markers and antibodies are listed in Table I. To assess frequencies of circulating T cell subsets, cryopreserved PBMC were used for staining. Corresponding whole blood samples were sent to the clinical hematology laboratory at the University of Pittsburgh Medical Center for complete blood counts (CBC). We used the flow cytometry data to convert the total lymphocyte numbers from the CBC to total CD4+ and CD8+ T cells/microliter of blood.
Table I.
Antibodies used in staining panels for flow cytometry.
| Marker | Clone | Fluorochrome(s) | Panel | Surface/Intracellular |
|---|---|---|---|---|
| CD45 | D058-1283 | BV786 | Necropsy | Surface |
| CD3 | SP34-2 | BV650 | PBMC Stimulation, Necropsy | Surface |
| CD3 | SP34-2 | AF700 | PBMC Phenotype, BAL Phenotype | Surface |
| CD3 | SP34-2 | V500 | BAL Stimulation | Surface |
| CD4 | OKT4 | PE-Cy7 | PBMC Phenotype, BAL Stimulation, Necropsy | Surface |
| CD4 | L200 | BV510 | BAL Phenotype | Surface |
| CD4 | L200 | BV786 | PBMC Stimulation | Surface |
| CD8 | DK25 | PacBlue | BAL Phenotype, BAL Stimulation | Surface |
| CD8 | SK1 | BV510 | PBMC Stimulation | Surface |
| CD8 | RPA-T8 | BV711 | Necropsy | Surface |
| CD8 | RPA-T8 | BV786 | PBMC Phenotype | Surface |
| CD206 | 19.2 | PE-Cy5 | BAL Phenotype, BAL Stimulation, Necropsy | Surface |
| HLA-DR | G46-6 | BV650 | PBMC Stimulation | Surface |
| CD39 | eBioA1 (A1) | FITC | BAL Phenotype | Surface |
| CD25 | BC96 | BV605 | PBMC Stimulation | Surface |
| CD69 | TP1.55.3 | ECD | PBMC Stimulation | Surface |
| ki67 | B56 | AF647 | PBMC Phenotype, BAL Phenotype, Necropsy | Intracellular |
| TIGIT | MBSA43 | FITC | Necropsy | Surface |
| TIGIT | MBSA43 | PerCP-eFluor710 | PBMC Stimulation | Surface |
| PD1 | EH12.2H7 | BV605 | PBMC Stimulation, BAL Phenotype, Necropsy | Surface |
| CTLA-4 | 14D3 | PE-Cy7 | PBMC Stimulation | Surface |
| IFNg | 4S.B3 | FITC | PBMC Stimulation, BAL Stimulation | Intracellular |
| IFNg | 4S.B3 | BV510 | Necropsy | Intracellular |
| TNFa | Mab11 | AF700 | PBMC Stimulation, BAL Stimulation, Necropsy | Intracellular |
| IL-17A | BL168 | PE | Necropsy | Intracellular |
| CD107a | H4A3 | APC | BAL Stimulation | Surface |
| Live/Dead | -- | near-IR | PBMC Phenotype, PBMC Stimulation, BAL Phenotype, BAL Stimulation, Necropsy | Surface |
For analysis of BAL samples, freshly isolated cells were stained. Cells were resuspended in media (RPMI 1640 supplemented with 10% human albumin, 1% L-glutamine, and 1% HEPES) and divided for a phenotype flow panel and a stimulation flow panel (Table I). The staining procedure for both panels were identical, except for the antibody cocktails used (Table I). Approximately 1 × 10⁶ cells were stained per condition. Stimulated samples were stimulated with a mixture of peptides from the Mtb antigens ESAT-6/CFP-10 (1ug/mL pooled peptide each), or Escherichia coli (10 CFU) for stimulating MAIT cells (42), for 5 hours at 37°C, 5% CO2. Brefeldin A, monensin, and CD107a-APC were added 1 hour after the addition of stimuli. Following stimulation, cells were resuspended in 500 nM dasatinib (Thermo Fisher Scientific; Cat No. NC0897653) and stained with 0.25ug Mamu MR1 5-OP-RU or Ac-6-FP tetramer (PE-conjugated) for 1 hour (NIH Tetramer Core Facility, Atlanta, GA). Cells were washed with PBS + dasatinib and stained with Live/Dead™ near-IR (Thermo Fisher Scientific; Cat No. L10119) for 20 minutes in the dark at room temperature. Cells were washed with PBS + dasatinib and stained with the surface antibody cocktail (Table I) for 20 minutes in the dark at room temperature. Cells were washed with FACS buffer (PBS + 1% FBS) supplemented with dasatinib and fixed overnight in 1% paraformaldehyde. For intracellular staining, cells were washed twice with FACS buffer and permeabilized with BD Cytofix/Cytoperm™ (BD; Cat No. 554714) for 10 minutes at room temperature, washed twice with BD Perm/Wash™ buffer, and stained with the intracellular cocktail (Table I) for 20 minutes at room temperature.
To stain tissues obtained at necropsy, freshly isolated tissue homogenates were used. Approximately 1 × 10⁶ cells were stained when possible; granuloma homogenates often had < 1 × 10⁶ cells. Cells were resuspended in media as described above and were either left unstimulated or stimulated with phorbol 12,13-dibutyrate (PDBu) and ionomycin for 3 hours at 37°C, 5% CO2. The stimulators described above and brefeldin A were added simultaneously. Cells were then resuspended in 500 nM dasatinib and stained using the same procedure as the BAL samples (described above). Surface and intracellular antibody cocktails for necropsy tissues are described in Table I.
Flow cytometry was performed on a BD LSR II (Becton Dickinson; Franklin Lakes, NJ), and the data were analyzed using FlowJo software for Macintosh (version 9.9.3 or version 10.1). The previously reported gating strategy for necropsy tissues was applied (42). We typically acquired approximately 50,000 events in the lymphocyte gate, although this event threshold varied depending on the specimen (i.e. granulomas were often lower). Because cell numbers were often limited for granulomas, an event threshold was used to exclude samples with collected CD3 event counts ≤ 100. For calculating total number of cells in lung tissue and granulomas obtained at time of necropsy, total cell counts using a hemocytometer were multiplied by the specified population frequency relative to the lymphocyte gate. Lung tissue cell counts were reported as cells per gram of tissue, back-calculated from the sample weight at the time of collection. Granulomas with a cell count less than the limit of detection of the hemocytometer (5×10⁴ cells) were assigned a value of 4.5×10⁴ cells before correcting for the dilution factor as done previously (23). For stimulation assays, stimulated conditions were background-adjusted by subtracting cytokine frequencies of unstimulated conditions (media only) from those of stimulated conditions. To correct for negative values, a threshold of the absolute value of the 75th-percentile of values below zero was used and data was adjusted accordingly (43).
Statistical analysis
Due to their outbred nature, NHP studies are often hindered by substantial variation between individual animals. To avoid data bias by any one animal, medians of samples from individual animals were reported. The Shapiro-Wilk normality test was used to check for normal distribution of data. Pair-wise analysis of normally distributed data was performed using the unpaired t test. Nonnormally distributed data were analyzed with the Mann-Whitney test. For comparisons between multiple groups, the Kruskal-Wallis test was used. A Dunn’s multiple comparisons follow-up test was used to compare mean ranks of groups to the mean rank of SIV/Mtb co-infected animals. Statistical analysis for longitudinal data (PBMC and BAL) was performed in JMP 14 statistical software (version 14.0; SAS Institute). Statistical tests for all other data were performed in Prism (version 8.2.1; GraphPad). All tests were two-sided, and statistical significance was designated at a p value of < 0.05. p values between 0.05 and 0.10 were considered trending and p values of >0.1 were considered not significant.
Results
No difference in TB disease pathology or bacterial burden in SIV+ and SIV-naïve animals at 6 weeks post-Mtb infection.
We previously observed rapid progression of TB disease as measured by 2-deoxy-2-(18F) fluorodeoxyglucose (FDG) PET/CT imaging beginning 4 – 8 weeks after Mtb co-infection of SIV+ MCM (35). This suggests that this period is critical in determining the trajectory of TB disease- either bacterial containment and TB control or bacterial dissemination and progressive TB. In the current study, we investigated the immunologic defect caused by SIV that increases Mtb susceptibility by comparing two experimental groups: MCM infected with Mtb only and SIV+ MCM co-infected with Mtb. Additionally, data from a small subset of MCM (n=4) infected only with SIV was included as a comparator for some analyses (Fig 1A). Necropsies were conducted 6 weeks after Mtb infection and, as expected, neither overall TB pathology (p = 0.6714) nor total thoracic bacterial burden (p = 0.3079) differed between the two groups (Fig 1B, C). Nor were differences observed in TB pathology and bacterial burden in individual compartments, including lung, thoracic lymph nodes, and extrapulmonary organs (S1 Fig A–E). There also was no observable difference in the frequency of Mtb culture-positive granulomas (S1 Fig F), indicating that granulomas had not yet developed substantial Mtb killing capacity at 6 weeks post-Mtb infection, regardless of the animals’ SIV status. This is not surprising as the total bacterial burden in Chinese cynomolgus macaques peaks between 4 and 6 weeks post-Mtb and is then subsequently reduced as mycobactericidal activity develops (36, 44). Taken together, these data suggest that TB disease state in MCM with chronic SIV infection resembles that in SIV-naïve animals at 6 weeks post-Mtb infection, even though TB disease trajectory soon diverges in SIV+ animals (35). Thus, 6 weeks post-Mtb represents an ideal time point to compare the conventional T cell response between SIV+ and SIV-naïve MCM - a time when adaptive immunity to Mtb appears but prior to the development of extensive immunopathology in SIV+ animals which confounds analysis (35).
Fig 1. No difference in overall Necropsy (Nx) score and total thoracic CFU.
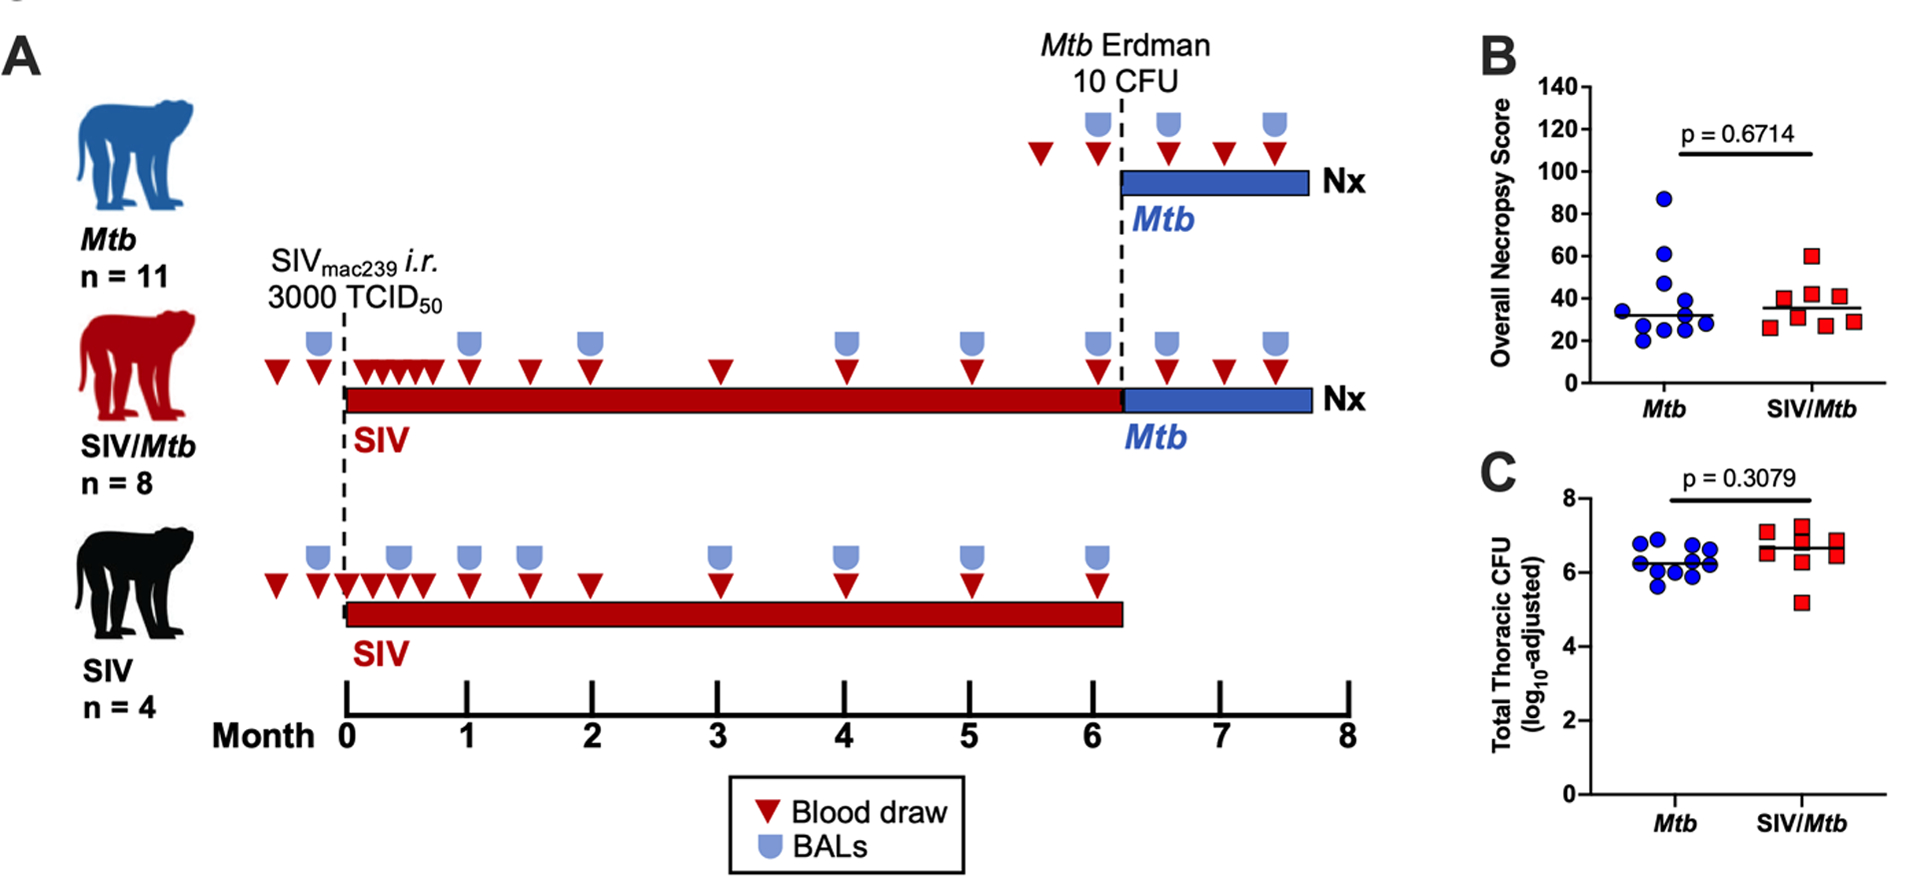
A.) Experimental design. Three cohorts of animals: Mtb only (blue, n = 11); SIV/Mtb (red, n = 8); and SIV only (black, n = 4). B.) Nx samples from Mtb-infected animals were scored and compiled to quantify TB pathology. Medians are shown. Mtb only (blue) and SIV/Mtb (red). Mann-Whitney tests were used to determine statistical significance. C.) Total Thoracic CFU combined CFU from lung tissue, thoracic lymph nodes, and granulomas from Mtb-infected animals. Medians are shown. An unpaired t test was used to determine statistical significance.
Pre-existing SIV infection decreases the CD4:CD8 T cell ratio across multiple tissue compartments.
A hallmark of HIV infection is the loss of CD4+ T cells, resulting in a decreased CD4:CD8 T cell ratio (45, 46). The CD4:CD8 ratio of circulating T cells in SIV+ animals was significantly decreased, both pre- and post-Mtb co-infection (Fig 2A; pre-Mtb, p = 0.0287; 2 wks, p = 0.1752; 4 wks, p = 0.0225; 6 wks, p = 0.0409). Similarly, the CD4:CD8 T cell ratio in airways of SIV+ animals was significantly lower over the course of Mtb co-infection than compared to SIV-naïve animals (Fig 2B; pre-Mtb, p = 0.1877; 2 wks, p = 0.0022; 5 wks, p = 0.0014). In tissue samples harvested at necropsy, CD4:CD8 ratios were significantly lower in randomly collected lung tissue and in individual granulomas (Fig 2C, p = 0.0427; Fig 2D, p = 0.123). The CD4:CD8 T cell ratio in lung tissue from the 4 MCM infected with SIV alone was similar to that observed in the SIV/Mtb animals (Fig 2C, p = 0.6527), suggesting that the altered ratio was a consequence of SIV, rather than the Mtb co-infection. Thus, the CD4:CD8 ratio was lower in SIV+ animals across all tissue compartments measured.
Fig 2. Pre-existing SIV systemically decreases CD4:CD8 ratios.
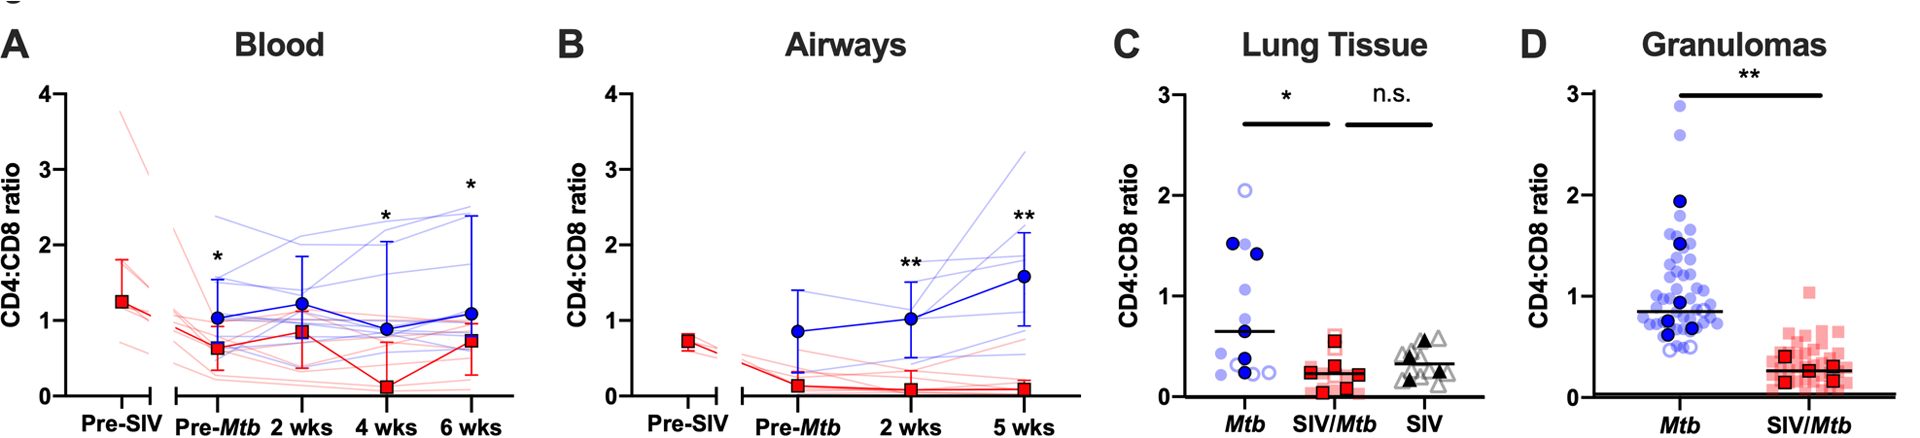
Blood (A.) and airway (B.) samples were collected over the course of the study and cells were stained for flow cytometry. Data from Mtb-only animals is shown in blue; and SIV/Mtb co-infected animals are in red. Solid lines indicate median with interquartile range. Lighter lines indicate CD4:CD8 ratios of individual animals. Mann-Whitney tests were performed at each time point between SIV+ and SIV-naïve groups to determine statistical significance. Lung tissue (C.) and granulomas (D.) were collected at necropsy and stained for flow cytometry. Mtb-only animals are in blue, SIV/Mtb co-infected animals in red, and SIV-only animals in black. Darker symbols represent the median of each animal and the lighter symbols are individual samples. Closed symbols represent CFU+ tissue and open symbols are sterile (CFU−) tissue. For lung tissue, a Kruskal-Wallis test was performed with a Dunn’s multiple comparison follow-up test comparing mean ranks to SIV/Mtb. For granulomas, a Mann-Whitney test was performed to determine statistical significance. Statistical significance indicated: n.s. p > 0.1; * p < 0.05; ** p < 0.01.
SIV alters the number of T cells in circulation, in the airways, and in granulomas.
Since a lower CD4:CD8 ratio itself does not differentiate whether the change is due to decreased CD4+ T cells or increased CD8+ T cells, we determined the absolute numbers of these two cell types in different tissue compartments. Over the course of HIV infection in humans, circulating CD4+ T cell counts can decline to ≤ 200 CD4+ T cells/μL blood, an AIDS-defining criterion (47). In our MCM model, the SIV+ macaques had fewer circulating CD3+ T cells than SIV-naïve animals, both before and after Mtb co-infection (Fig 3A; pre-Mtb, p = 0.0328; 2 wks, p = 0.426; 4 wks, p = 0.0280; 6 wks, p = 0.0691). This decrease was largely due to significantly fewer circulating CD4+ T cells in the SIV+ animals (Fig 3B; pre-Mtb, p = 0.0121; 2 wks, p = 0.0426; 4 wks, p = 0.0070; 6 wks, p = 0.0159). CD8+ T cell counts in the blood were also lower, but not statistically significantly (Fig 3C). Prior to infection with either Mtb (SIV-naïve animals) or SIV (SIV/Mtb animals), there was no significant difference in the number of CD3+ (p = 0.6574), CD4+ (p = 0.2060), and CD8+ (p = 0.9039) T cells in the blood (Fig 3).
Fig 3. SIV decreases peripheral T cell populations prior to Mtb challenge and impairs their expansion following Mtb challenge.
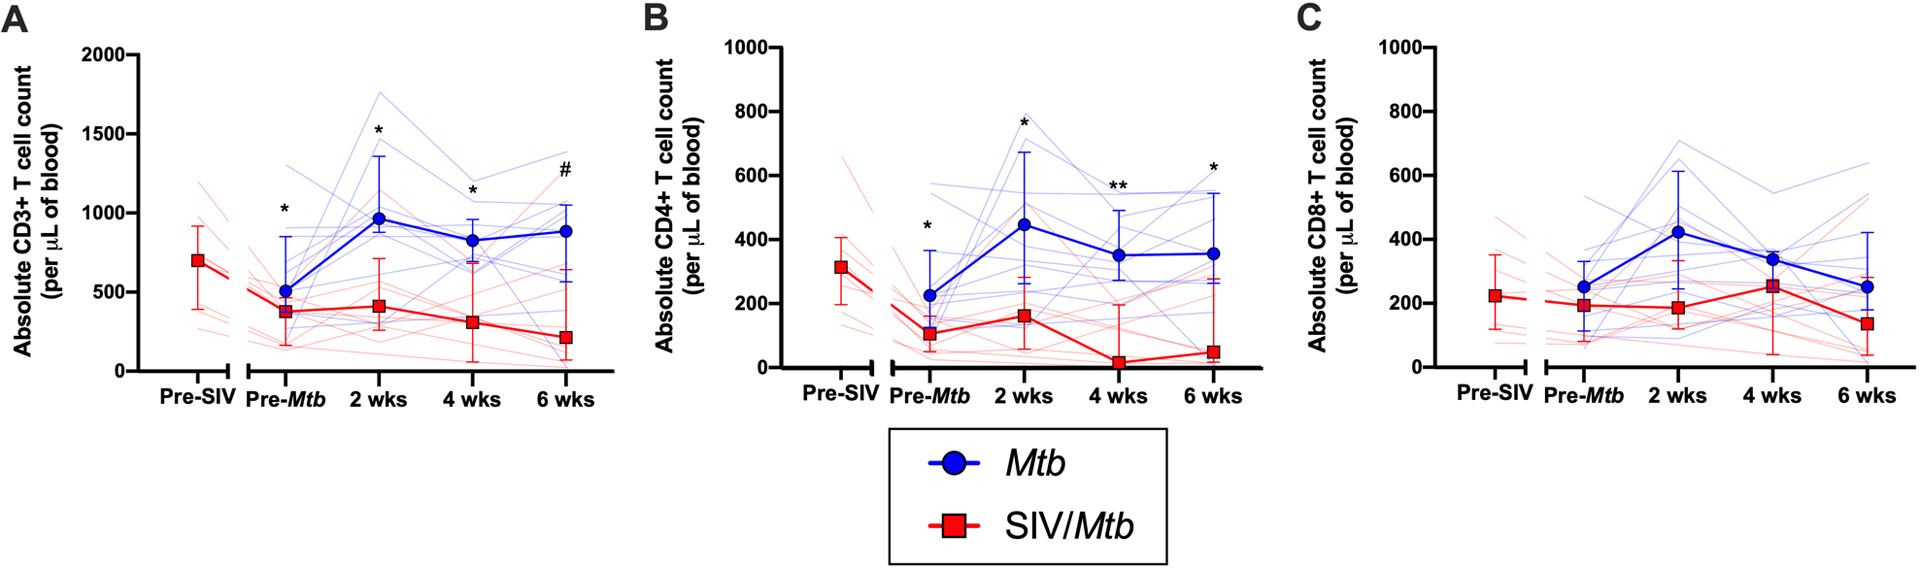
PBMC were collected throughout the course of SIV and Mtb infection. Mtb-only animals are in blue; SIV/Mtb co-infected animals in red. Solid lines indicate median with interquartile range. Lighter lines indicate absolute cell counts of individual animals. Mann-Whitney tests were performed to determine statistical significance between SIV+ and SIV-naïve groups at indicated time points. A.) Absolute CD3+ T cells counts in PBMC. B.) Absolute CD4+ T cell counts in PBMC. C.) Absolute CD8+ T cell counts in PBMC. Statistical significance indicated: # 0.05 < p < 0.1; * p < 0.05; ** p < 0.01.
There were slightly more total CD3+ T cells in the airways of SIV+ animals following Mtb co-infection than in airways of animals infected with Mtb only (~0.4 log10 difference at 2 and 5 weeks, p = 0.0740 and p = 0.0128, respectively; Fig 4A). Interestingly, the significant decrease in the airway CD4:CD8 ratio observed in SIV+ animals (Fig 2B), was not due to a loss of CD4+ T cells (Fig 4B) but rather a significant increase in CD8+ T cells (~0.7–0.8 log10 difference at 2 and 5 weeks post-Mtb infection, p = 0.0513 and p = 0.0015, respectively; Fig 4C). An influx of SIV-specific CD8+ T cells into airways has been reported in acute SIV infection (48). Although we did not measure SIV-specificity here, it is likely that the CD8+ T cells accumulating in the airways of SIV+ MCM are SIV-specific. The number of T cells in the lung tissue did not differ between SIV/Mtb co-infected animals and those infected with Mtb alone (Fig 5A). However, granulomas from SIV/Mtb animals showed an increase in the number of CD8+ T cells present at 6 weeks post-Mtb infection when compared to SIV-naïve animals, although this observation was a trend (p = 0.0552; Fig 5B).
Fig 4. SIV increases CD8+ T cells in the airways following Mtb challenge.
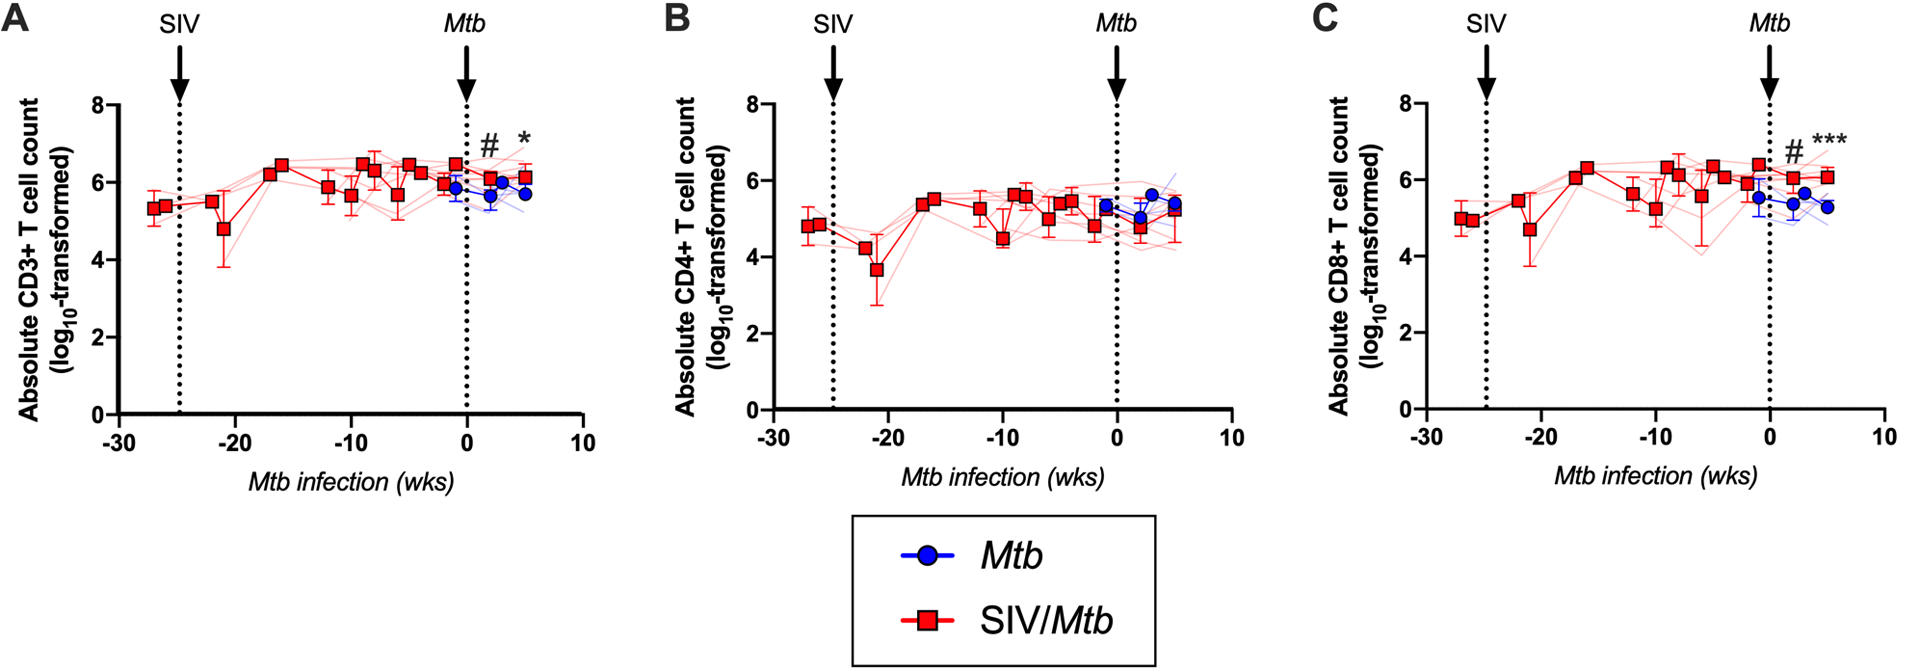
Cells from airways were collected by BAL throughout the course of SIV and Mtb infection. Mtb-only animals (blue); SIV/Mtb co-infected animals (red). Solid lines indicate median with interquartile range. Lighter lines indicate absolute cell counts of individual animals. A.) Absolute CD3+ T cells counts in BALs. B.) Absolute CD4+ T cell counts in BALs. C.) Absolute CD8+ T cell counts in BALs. Combined 2- and 3-week time points for the Mtb-only animals were used for statistical analysis. Mann-Whitney tests were performed at indicated time points between SIV+ and SIV-naïve groups to determine significance; # 0.05 < p < 0.1; * p < 0.05; *** p < 0.001.
Fig 5. No significant differences in absolute T cells counts in lung tissue of SIV/Mtb animals, however CD8+ T cells are increased in granulomas.
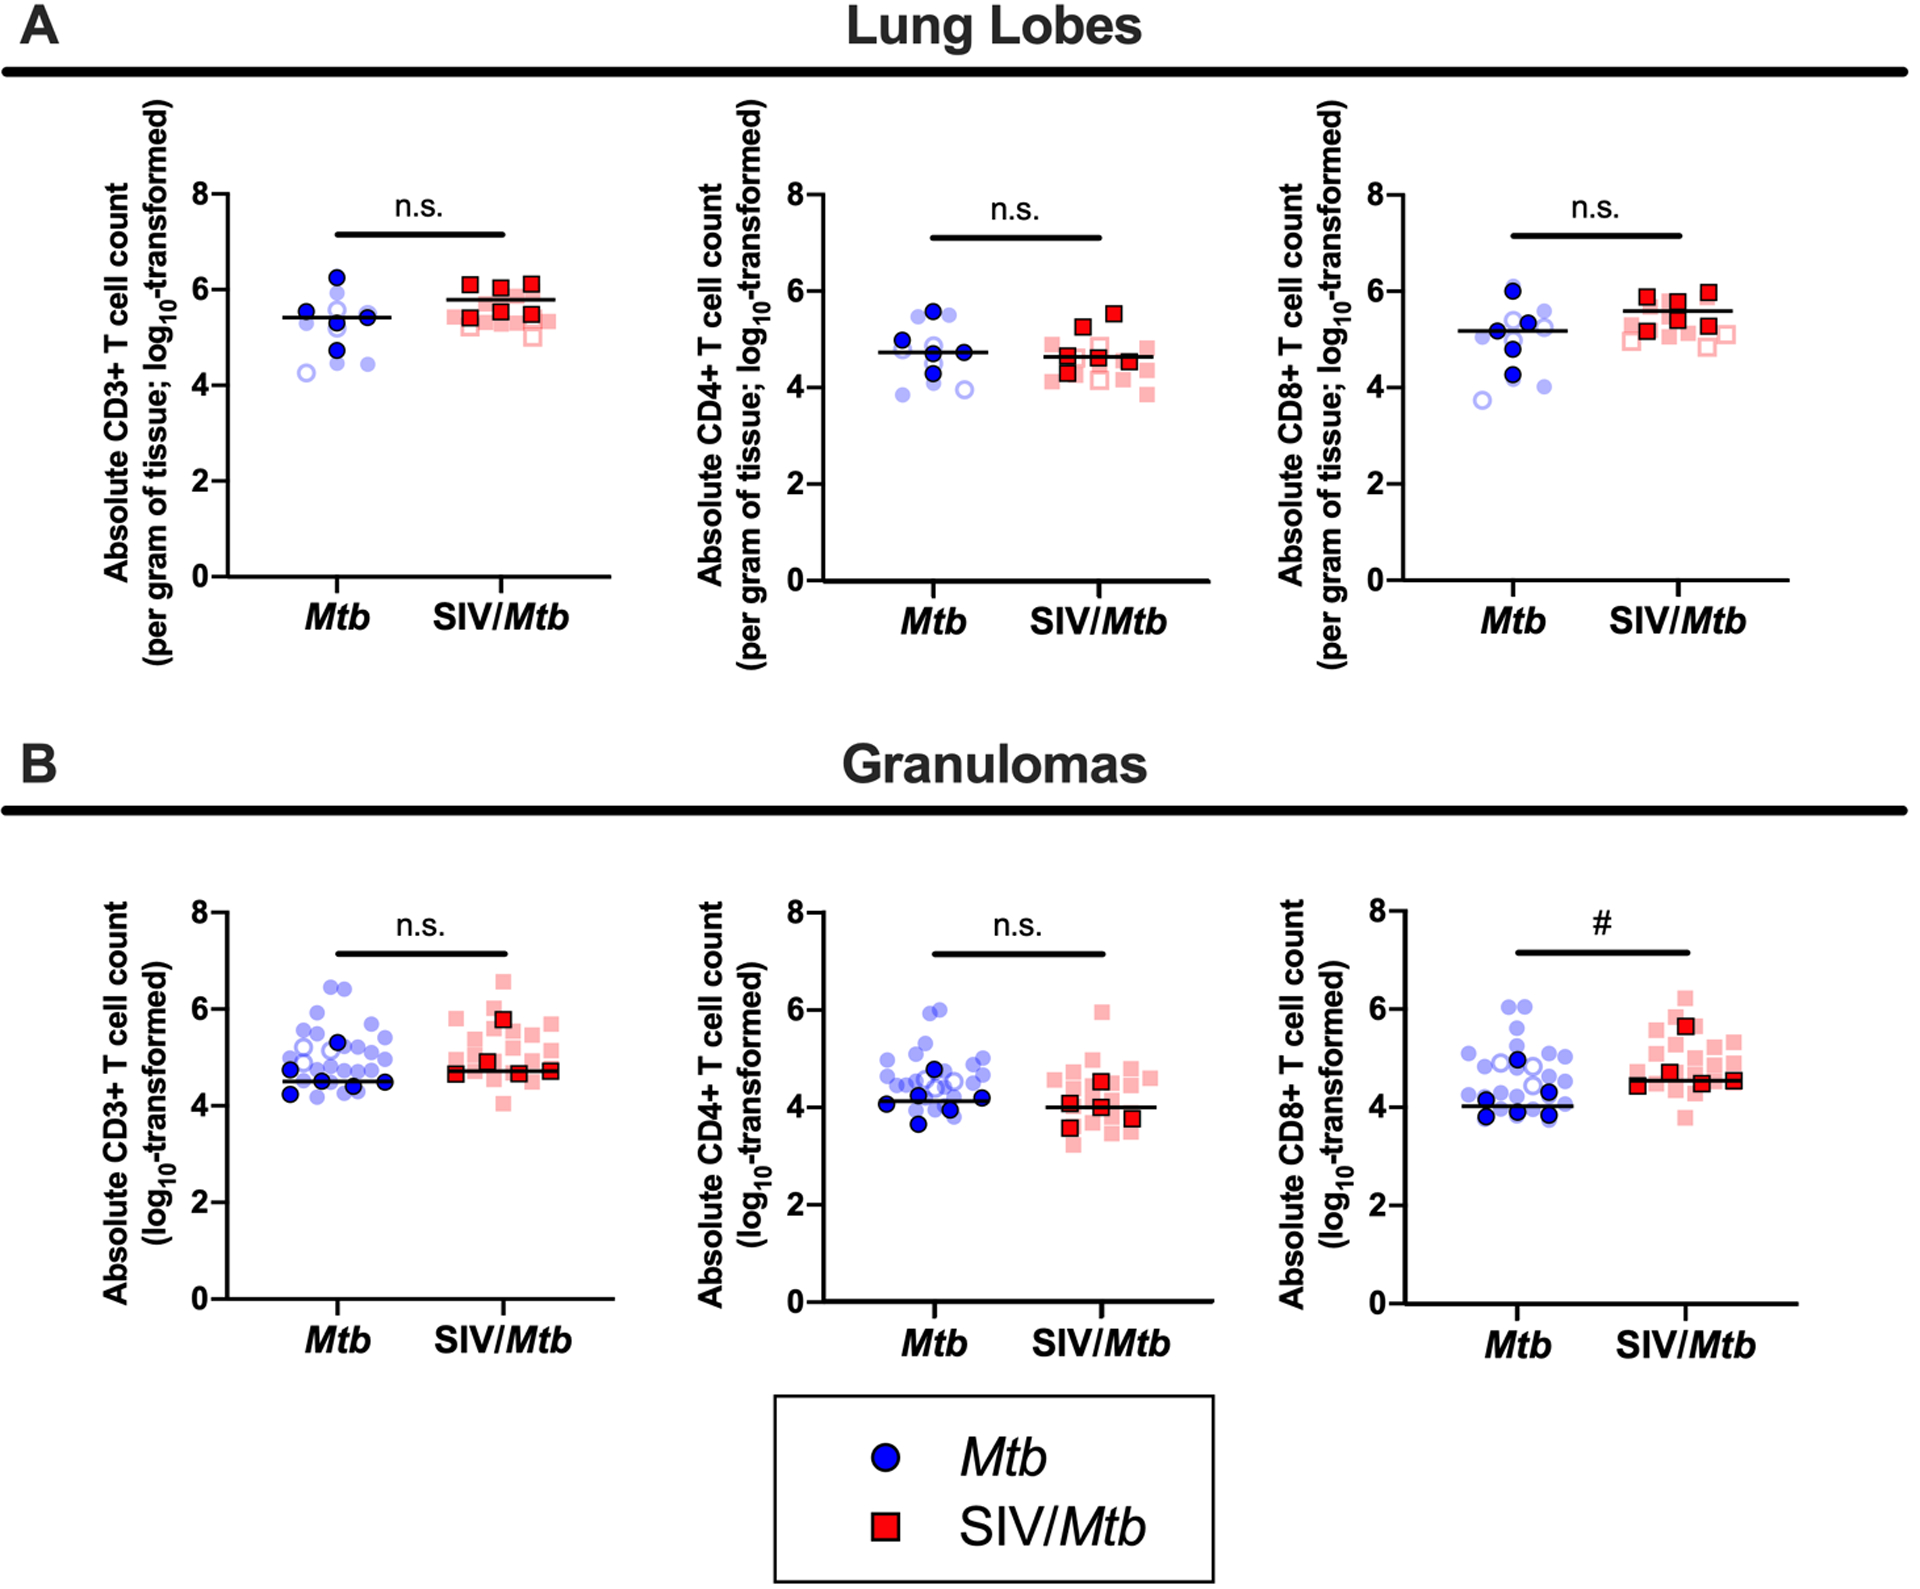
Lung tissue and granulomas were collected at necropsy and stained for flow cytometry. Mtb-only animals are in blue; SIV/Mtb co-infected animals are in red. Darker symbols represent the median of each animal and the lighter symbols are individual samples. Closed symbols represent CFU+ tissue and open symbols are sterile (CFU−). A.) Absolute T cells counts per gram of lung tissue. B.) Absolute T cell counts in granulomas. Mann-Whitney tests were performed to determine statistical significance between SIV+ and SIV-naïve groups; n.s. p > 0.1, # 0.05 < p < 0.1.
Circulating CD4+ and CD8+ T cells are more activated in SIV+ animals post-Mtb infection.
Having compared CD4+ and CD8+ T cell frequencies in various compartments following Mtb infection of SIV+ and SIV-naïve MCM, we then assessed phenotypic differences of these cells circulating in blood from these two groups of animals. We measured several T cell activation markers including CD69, PD-1, CTLA-4, and TIGIT. The frequencies of CD4+ T cells expressing PD-1 or CD69 were similar between SIV+ and SIV-naïve animals prior to Mtb infection but significantly increased in the SIV+ animals during the 6 weeks following Mtb infection (Fig 6A, B). In contrast, the frequencies of CD8+ T cells expressing PD-1 or CD69 were higher in SIV+ animals even prior to Mtb infection and remained elevated during Mtb co-infection (Fig 6C, D). These data suggest that circulating CD4+ T cells express surface markers consistent with activation following Mtb infection, while the expression of activation markers on CD8+ T cells is likely a consequence of SIV infection. We did not detect a consistent pattern of other proteins associated with activation, such as TIGIT, CTLA-4, HLA-DR, or ki67, on CD4+ or CD8+ T cells in PBMC from SIV+ animals compared to SIV-naïve animals over the course of Mtb infection (S2 Fig). However, prior to Mtb challenge, CD8+ T cells from SIV+ animals had higher frequencies of TIGIT (p = 0.0949), HLA-DR (p = 0.0068), and ki67 (p = 0.0005).
Fig 6. SIV+ animals have more circulating CD4+ and CD8+ T cells expressing PD-1 and CD69 following Mtb challenge.
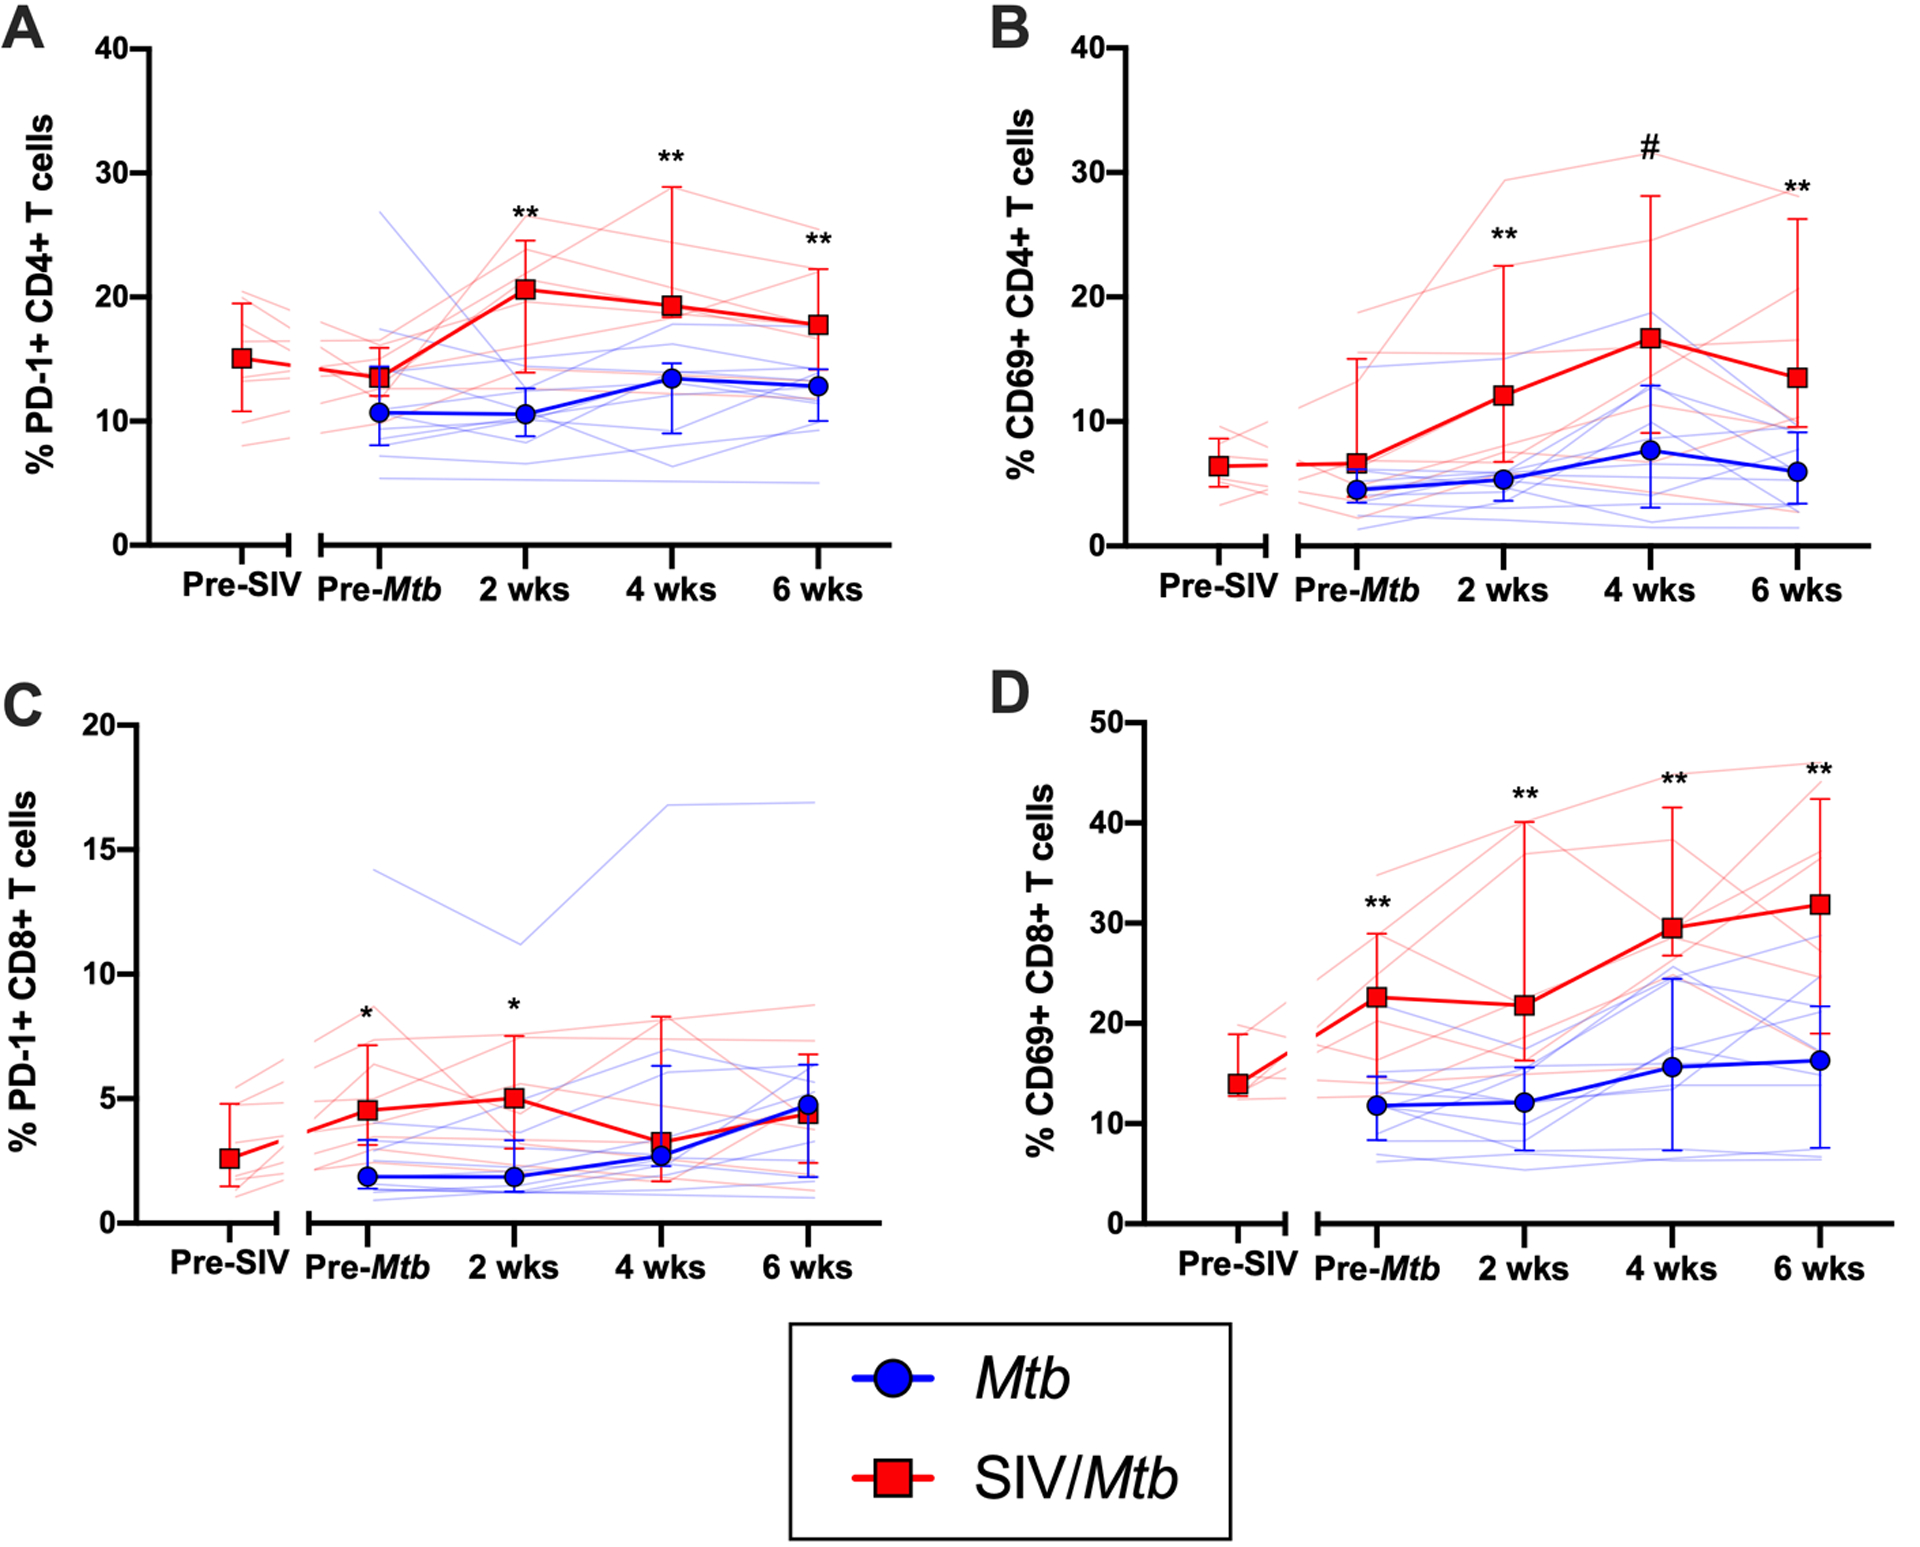
PBMC were collected and stained over the course of Mtb infection from Mtb (blue) and SIV/Mtb (red) animals. A.) PD-1 expression on CD4+ T cells; pre-Mtb, p = 0.1843; 2 wks, p = 0.0033; 4 wks, p = 0.0070; 6 wks, p = 0.0038. B.) CD69 expression on CD4+ T cells; pre-Mtb, p = 0.1087; 2 wks, p = 0.0013; 4 wks, p = 0.0553; 6 wks, p = 0.0063. C.) PD-1 on CD8+ T cells; pre-Mtb, p = 0.0195; 2 wks, p = 0.0426; 4 wks, p = 0.9371; 6 wks, p = 0.6924. D.) CD69 on CD8+ T cells; pre-Mtb, p = 0.0025; 2 wks, p = 0.0012; 4 wks, p = 0.0013; 6 wks, p = 0.0091. Population frequencies were determined by flow cytometry. Solid lines indicate median with interquartile range. Lighter lines indicate individual animals. Mann-Whitney tests were performed between SIV+ and SIV-naïve groups at each time point to determine significance; # 0.05 < p < 0.1; * p < 0.05; ** p < 0.01.
We also compared T cell cytokine production in PBMC of SIV+ and SIV-naïve MCM following Mtb infection. We focused on two cytokines known to be important in anti-Mtb host immunity: IFN-γ and TNF. PBMC were stimulated with the immunogenic Mtb peptides ESAT-6/CFP-10 and subjected to intracellular staining and flow cytometry. We observed very little production of IFN-γ or TNF by CD4+ and CD8+ T cells in either SIV-naïve or SIV+ animals following Mtb infection (S3 Fig).
Mtb-specific T cell numbers in airways do not differ between SIV+ and SIV-naïve animals Mtb infection.
Mtb transmission primarily occurs through inhalation, so immune responses in the airways is important to assess. We showed that CD4:CD8 T cell ratios in the airways were altered in SIV/Mtb co-infected MCM due to an influx of CD8+ T cells (Figs 2B and 4C). To test whether there was a difference in Mtb-specific T cells in the airways of SIV+ and SIV-naïve MCM following Mtb infection, BAL cells were stimulated ex vivo with pooled ESAT-6 and CFP-10 peptides and intracellular cytokine staining was performed (Fig 7A). These assays revealed no difference between SIV+ or SIV-naïve animals in the frequency of CD4+ or CD8+ T cells that produced IFN-γ alone (Fig 7B, C), IFN-γ and TNF in combination (Fig 7D, E), or TNF alone (Fig 7F, G) following Mtb infection.
Fig 7. Decreased TNF production in response to Mtb antigen in BAL cells from SIV/Mtb animals.
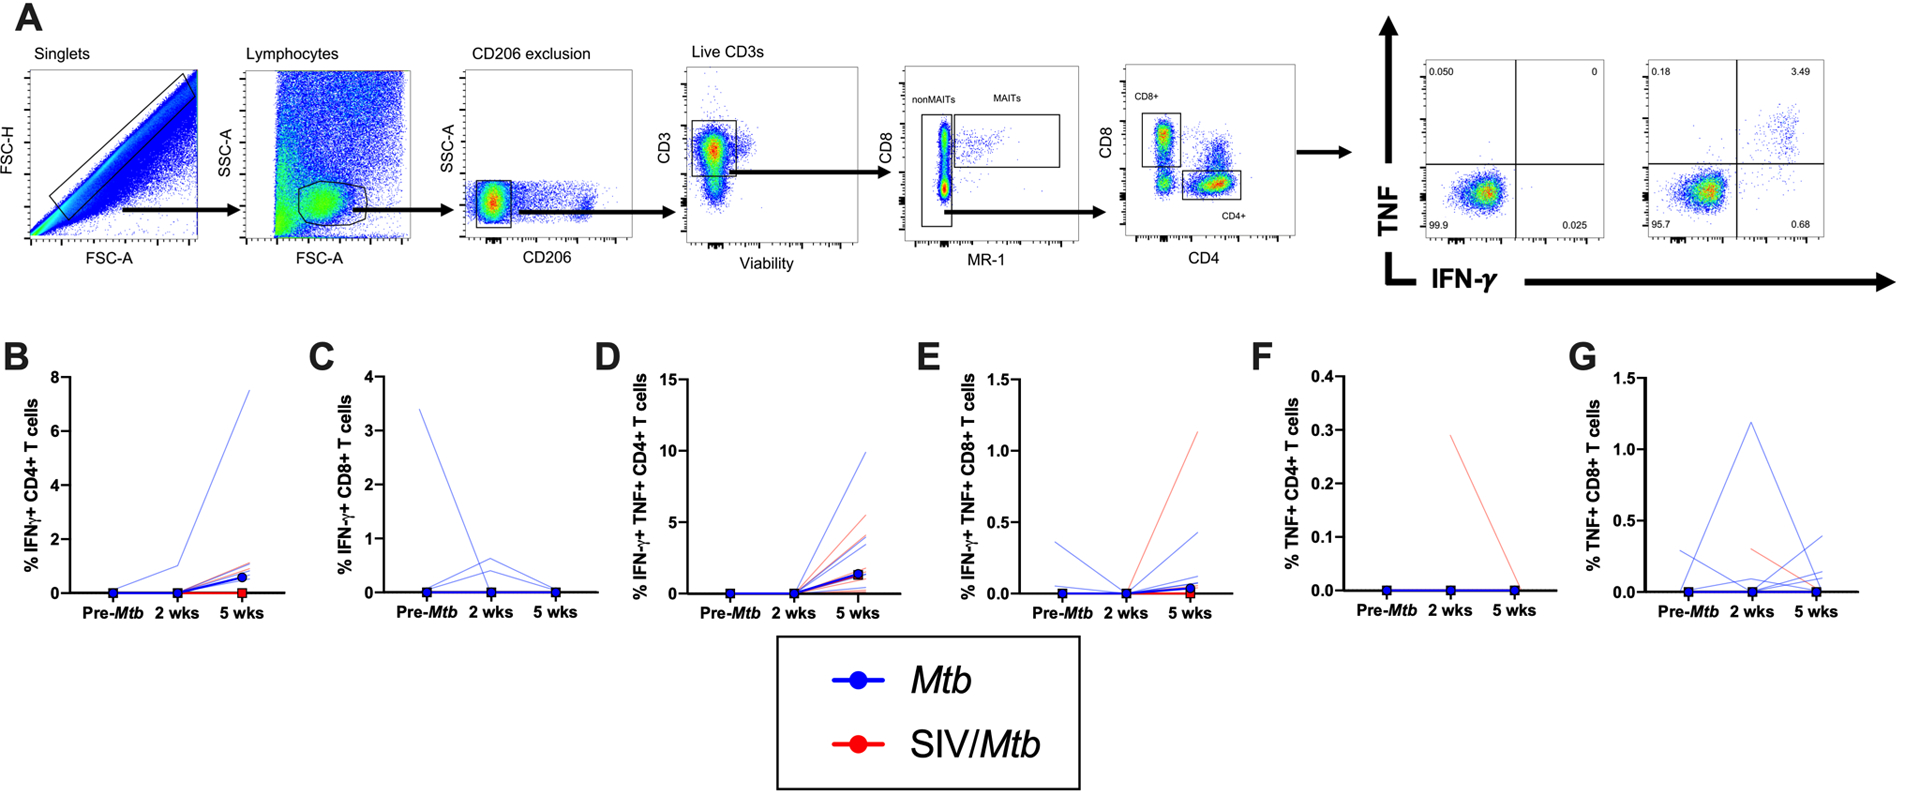
BAL were collected before Mtb and at 2 and 5 weeks post-Mtb challenge of Mtb-only (blue) and SIV/Mtb co-infected animals (red). Cells were stimulated for 5 hours with ESAT-6/CFP-10. A.) Example of BAL gating strategy. B.-G.) Frequency of CD4+ or CD8+ T cells producing IFN-γ and/or TNF. Frequencies were adjusted to background by subtracting from unstimulated controls. Solid lines indicate median with interquartile range. Lighter lines indicate individual animals. Mann-Whitney tests were used to determine statistical significance between SIV+ and SIV-naïve groups at indicated time points; * p < 0.05.
SIV+ animals have increased frequencies of CD4+ and CD8+ T cells expressing PD-1 and TIGIT in lung tissue and granulomas.
While BAL can be used to sample airway cells longitudinally, it cannot access cells within the lung parenchyma or within granulomas. We conducted comprehensive, PET/CT-guided necropsies 6 weeks after Mtb infection to harvest TB granulomas as well as random lung tissue samples to determine whether there were phenotypic and/or functional differences in these tissues between SIV+ and SIV-naïve animals.
Elevated immune activation in the lungs has been suggested previously to cause more severe TB disease in the setting of concurrent SIV infection (31). Our hypothesis here was that the exacerbated TB disease that we showed previously in SIV+ MCM following Mtb co-infection (35) was due to SIV-associated immune activation present at the time of Mtb co-infection. Indeed, both lung tissue (p = 0.0569) and granulomas (p = 0.0087) harvested from SIV+ MCM 6 weeks after Mtb co-infection (red squares; Fig 8A, B) contained a higher frequency of CD4+ T cells expressing PD-1 than did those same tissues harvested from animals infected with Mtb alone (blue circles). There was no difference in the frequency of CD4+ T cells expressing PD-1 in lung tissue between SIV/Mtb co-infected animals (red squares; Fig 8A) and animals infected with SIV alone (black triangles; p = 0.9944) indicating that elevated PD-1 levels in SIV/Mtb animals was likely established prior to Mtb infection. Similarly, TIGIT expression was increased on CD4+ T cells in both lung tissue and granulomas of SIV/Mtb animals (red squares; Fig 8C, p = 0.0163; Fig 8D, p = 0.0043) compared to those infected with Mtb alone (blue circles).
Fig 8. PD-1 and TIGIT expression is elevated in tissues of SIV+ animals.
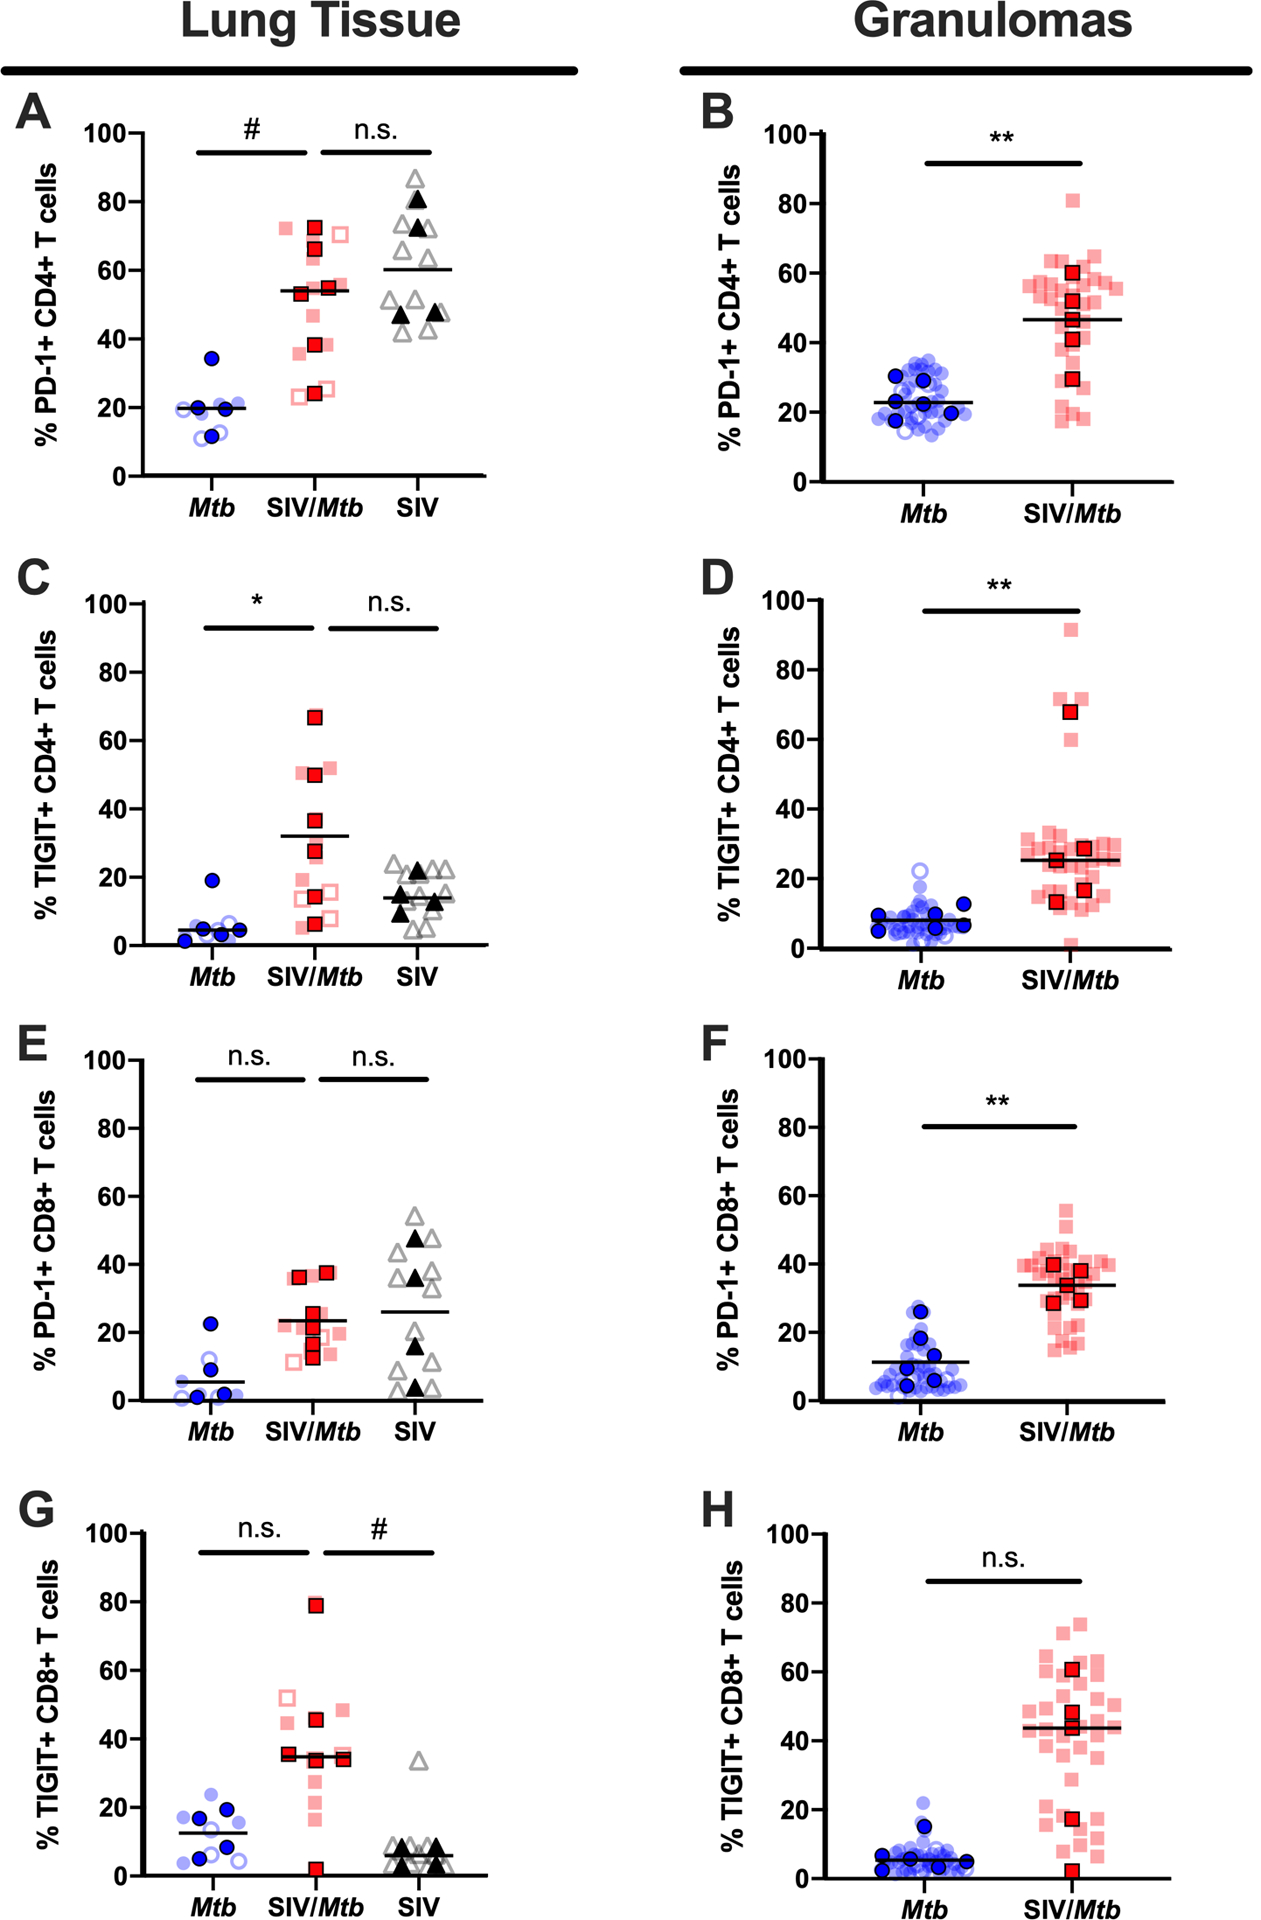
PD-1 and TIGIT expression on CD4+ and CD8+ T cells was measured by flow cytometry of tissues collected at necropsy for Mtb-only animals (blue) and SIV/Mtb co-infected animals (red). Darker symbols represent the median of each animal and the lighter symbols are individual samples. Closed symbols represent CFU+ tissue and open symbols are sterile (CFU−). Solid black line indicates median. For lung tissue (A., C., E., and G.), Kruskal-Wallis test was performed with a Dunn’s multiple comparison follow-up test comparing mean ranks to SIV/Mtb. For granulomas (B., D., F., and H.), Mann-Whitney tests were performed to determine statistical significance; n.s. p > 0.1; # 0.05 < p < 0.1; * p < 0.05; ** p < 0.01.
A higher frequency of CD8+ T cells expressing PD-1 was present in the granulomas of SIV/Mtb co-infected MCM (red squares; Fig 8F, p = 0.0043) compared to those infected with Mtb alone (blue circles). Conversely, there were no differences in the frequency of CD8+ T cells expressing PD-1 in lung tissue between animals infected with Mtb only (blue circles), SIV/Mtb (red squares), and SIV only animals (black triangles; Fig 8E). There was a trend towards higher frequencies of CD8+ T cells expressing TIGIT in lung tissue of SIV/Mtb animals (Fig 8G, p = 0.0717) compared to SIV only animals. However, we did not observe a difference in TIGIT in lung tissue (Fig 8G, p = 0.3490) or granulomas (Fig 8H, p = 0.1255) from SIV/Mtb animals compared to animals infected with Mtb alone.
Granulomas from SIV+ animals trend towards having lower frequencies of CD4+ T cells producing TNF.
The frequency of T cells producing the cytokines IFN-γ and TNF were measured in lung tissue and granulomas collected at necropsy 6 weeks after Mtb infection (Fig 9). IFN-γ production by CD4+ and CD8+ T cells differed little between SIV+ (red squares) and SIV-naïve (blue circles) animals in both lung tissue and granulomas (Fig 9A–D). However, there was a trend towards fewer CD4+ T cells producing TNF in granulomas from SIV+ MCM (red squares) compared to SIV-naïve MCM (blue circles) (p = 0.0519; Fig 9F). Frequencies of TNF+ CD8+ T cells also trended lower in granulomas from SIV+ MCM compared to SIV-naïve MCM (p = 0.0519), although the range of these data for each group was greater than the effect size and so caution is warranted when interpreting the significance of this finding (Fig 9H).
Fig 9. Less TNF production in granulomas of SIV+ animals.
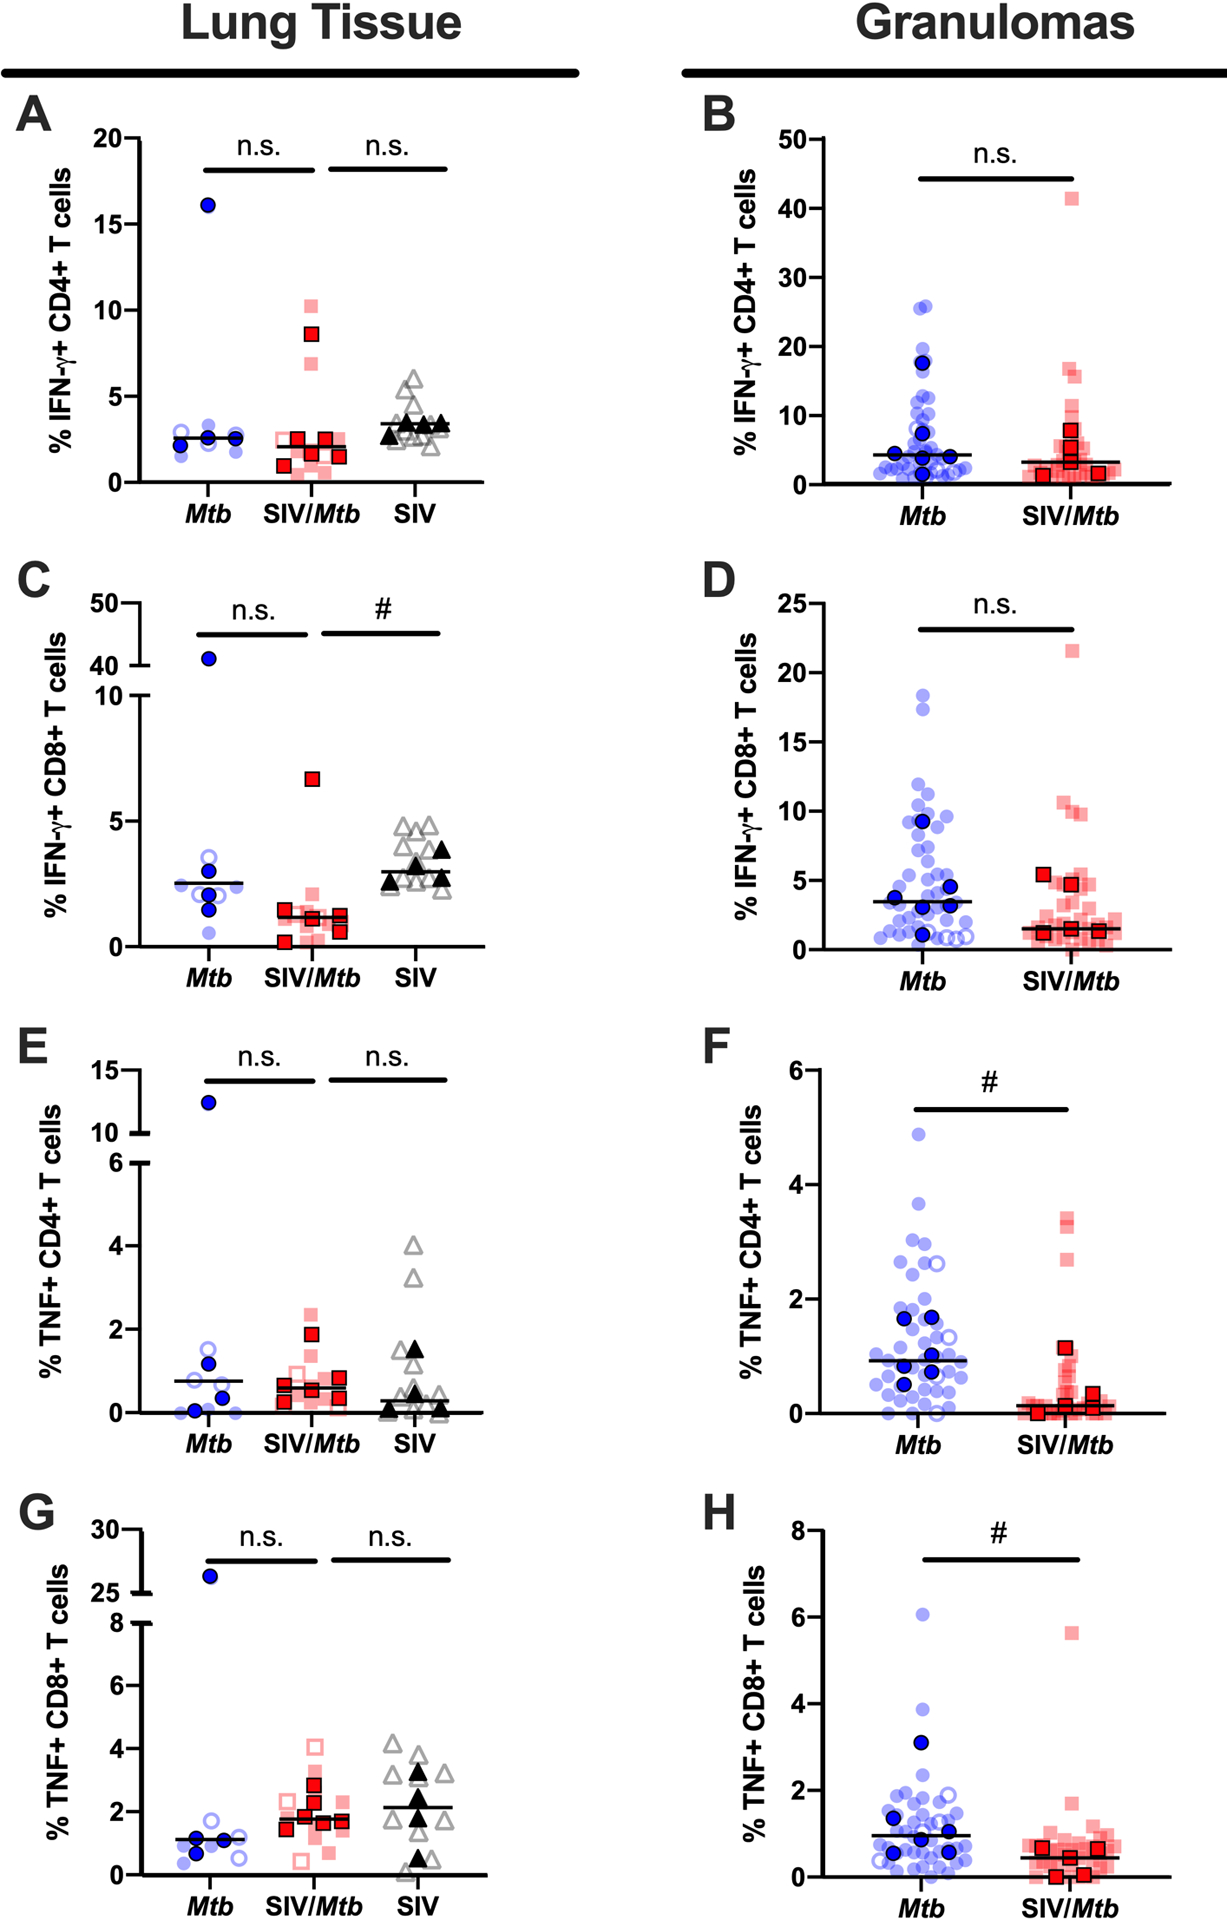
IFN-γ and TNF production of CD4+ and CD8+ T cells was measured by flow cytometry in tissues collected at necropsy for Mtb-only animals (blue) and SIV/Mtb co-infected animals (red). Darker symbols represent the median of each animal and the lighter symbols are individual samples. Closed symbols represent CFU+ tissue and open symbols are sterile (CFU−). Solid black line indicates median. For lung tissue (A., C., E., and G.), Kruskal-Wallis test was performed with a Dunn’s multiple comparison follow-up test comparing mean ranks to SIV/Mtb. For granulomas (B., D., F., and H.), Mann-Whitney tests were performed to determine statistical significance; n.s. p > 0.1; # 0.05 < p < 0.1.
Discussion
We previously demonstrated that, upon Mtb co-infection, animals with pre-existing SIV infection exhibit rapid TB disease progression, more severe TB disease, and earlier mortality than animals infected with Mtb alone (35). We hypothesized that SIV caused immune dysregulation that led to exacerbated TB disease in SIV/Mtb co-infected animals. In this study, we sought to more precisely define that dysregulation by characterizing CD4+ and CD8+ T cell phenotypes and cytokine production in blood, airway, and tissues of SIV-infected macaques subsequently co-infected with Mtb, comparing to animals infected with Mtb alone.
We chose to conduct necropsies at 6 weeks post-Mtb infection since our initial study showed that TB progression, as measured by PET/CT imaging, began to diverge in SIV+ and SIV-naïve MCM between 4 and 8 weeks after Mtb infection (35). Thus, the 6-week time point chosen here is the crucial time when adaptive immunity to Mtb is almost fully developed (14, 19) and the trajectories of TB disease are beginning to diverge in SIV+ and SIV-naïve animals, yet is prior to the appearance of advanced TB immunopathology (e.g. prolific necrosis, pneumonia, etc.) which we observed in our previous study (35) and which confounds careful immunologic characterization. Indeed, the SIV+ and SIV-naïve macaques necropsied at 6 weeks after Mtb infection exhibited similar TB pathology scores (Fig 1). They also had similar bacterial burdens at this time point (Fig 1), consistent with the work Lin, et al. who showed that mycobacterial killing capacity developed in granulomas sometime between 4 – 11 weeks post-infection (36). We show here that, despite having comparable TB progression, SIV-naïve and SIV+ animals exhibited distinct immunologic differences following Mtb infection. Specifically, animals with pre-existing SIV had i. lower CD4:CD8 T cell ratios, ii. higher frequencies of CD4+ and CD8+ T cells expressing PD-1 or TIGIT at sites of Mtb infection, and iii. fewer CD4 + T cells producing TNF in granulomas.
The initial immune response to Mtb infection is incredibly important in TB disease control (10). Following Mtb infection, activated immune cells migrate to sites of infection to form granulomas, the hallmark of TB (10). The granuloma is a complex, organized collection of cells consisting of macrophages, T and B lymphocytes, and neutrophils (10). Of the lymphocyte population, T cells, both CD4+ and CD8+, are necessary to control Mtb infection (11, 12, 49–51). HIV disrupts the balance between CD4+ and CD8+ T cells and some studies suggest that a reduction in the ratio of CD4:CD8 T cells is associated with poor TB disease outcome (45). We found CD4:CD8 T cell ratios were lower across all tissue compartments measured in SIV/Mtb co-infected animals (Fig 2). A subset of animals chronically infected with SIV alone was necropsied to provide insight into the immunologic environment in tissues prior to Mtb infection. These animals also exhibited lower CD4:CD8 ratios in the blood and lung tissue, indicating that the decrease observed in SIV/Mtb animals was a consequence of their pre-existing SIV infection. In humans, HIV infection lowers CD4:CD8 T cell ratios in blood by a continuous loss of CD4+ T cells (52). We observed a similar decline of circulating CD4+ T cells, without significant changes to CD8+ T cells, in SIV-infected animals, both before and after Mtb infection (Fig 3). Interestingly, in the airways, where immune cells first encounter inhaled Mtb, SIV/Mtb co-infected animals showed significant accumulation of CD8+ T cells (Fig 4). This is likely a consequence of SIV infection as SIV-specific CD8+ T cells have been shown to accumulate in airways following SIV infection (48).
The CD4:CD8 T cell ratios in both lung tissue and granulomas were lower in SIV/Mtb co-infected animals and was also noted in the lung tissue of SIV+ MCM, indicating that SIV infection alone drove the decline in the CD4:CD8 ratio (Fig 2). Looking more closely at the T cell populations in lung granulomas, we found an increase in CD8+ T cells present in granulomas in SIV+ animals compared to SIV-naïve animals (Fig 5B, right panel). The number of CD4+ T cells present in granulomas did not differ significantly between the two groups (Fig 5B, middle panel). Several groups have reported an influx of CD8+ T cells in airways of both HIV+ patients and SIV+ animals (30, 48, 53, 54). One possible explanation for the accumulation of CD8+ T cells we observed in both BAL and granulomas of SIV/Mtb co-infected animals is that Mtb infection activates SIV-infected cells within the lungs and airways (55), increasing SIV replication, and driving an influx of the SIV-specific CD8+ T cells (48, 56). While we did not examine whether certain functions by SIV-specific CD8+ T cells, such as cytokine secretion, impairs Mtb control within granulomas, future studies will investigate SIV replication in the airways and granulomas of Mtb co-infected MCM and assess SIV-specific CD8+ T cell responses to test this hypothesis.
We did not observe a difference in the frequencies of IFN-γ-producing CD4+ or CD8+ T cells within lung tissue or granulomas between SIV+ and SIV-naïve MCM at 6 weeks post-Mtb infection (Fig 9A–D). Nor did SIV+ and SIV-naïve MCM differ in the production of TNF by CD4+ and CD8+ T cells in lung tissue (Fig 9E, G). Similarly, in airways, we did not observe differences in cytokine responses (IFNγ and/or TNF) elicited by Mtb-specific stimuli between SIV+ and SIV-naïve animals at 5 weeks post-Mtb infection indicating that the Mtb-specific response in airways is remarkably intact in SIV+ animals (Fig 7). However, we did observe a decrease that trended towards significance (p = 0.0519) in the frequency of CD4+ T cells producing TNF in granulomas from SIV+ animals compared to SIV-naïve animals (Fig 9F). These data suggest that a localized diminution of TNF produced by CD4+ T cells as early as 6 weeks post-Mtb infection could explain, in part, the divergence in TB disease trajectory at later stages of Mtb infection. TNF is necessary for Mtb control (57–60). TNF-deficient mice exhibit increased susceptibility to Mtb infection and rapidly succumb to Mtb infection (57–59). In macaques, TNF neutralization resulted in exacerbation of active TB disease and reactivation of latent Mtb infection (60). Moreover, patients using TNF-neutralizing agents are at a higher risk of acquiring TB or developing reactivated TB (61, 62). Given the critical role of TNF in Mtb infection, future studies examining more carefully the role of this cytokine in SIV+ macaques upon Mtb co-infection are warranted.
Chronic immune activation is a feature of HIV and SIV infection that can be detrimental to host immunity (63–66). In NHP species where SIV infection is non-pathogenic, immune activation resolves after several weeks following acute infection, while in species with pathogenic SIV infection, immune activation is maintained well into the chronic phase of SIV infection (66, 67). Several studies have shown that unmitigated immune activation and cytokine production can lead to worsened TB disease (68, 69) and fails to enhance protection against Mtb (70–72). In our SIV/Mtb animals, markers associated with an immune activation signature were elevated in blood and tissues when compared to animals infected with Mtb alone. In the blood from SIV+ MCM, we observed a higher frequency of both CD4+ and CD8+ T cells expressing markers associated with T cell activation (Fig 6). Interestingly, while peripheral CD4+ T cells were activated only after Mtb infection, CD8+ T cells were activated prior to Mtb infection in an SIV-dependent manner (Fig 6). In lung tissue as well as granulomas, there was a higher frequency of CD4+ T cells expressing PD-1 and TIGIT in both SIV/Mtb co-infected animals and animals infected with SIV only (Fig 8). These data indicate that CD4+ T cells in lungs of SIV+ animals are activated prior Mtb infection. We did not analyze whether cells expressing PD-1 or TIGIT produced less cytokine, but future SIV/Mtb co-infection studies will examine this as their expression of these receptors on T cells has been shown to have functional consequences on HIV/SIV- or Mtb-specific T cells (69, 73–81).
The immune events that occur during the early stages of Mtb infection are crucial in shaping the TB disease trajectory (10). Our study found elevated expression of markers associated with immune activation on both CD4+ and CD8+ T cells in blood and tissues from SIV+ animals. These markers remained elevated over the course of Mtb co-infection. Our data suggest that this SIV-induced immune activation may weaken the anti-mycobacterial function of granulomas, as reflected by a moderate loss of TNF-producing CD4+ T cells just 6 weeks post-Mtb infection. These features may explain, in part, the increased susceptibility of PLHIV to TB.
Supplementary Material
Key Points.
SIV infection reduces CD4:CD8 ratios prior to and during SIV/Mtb co-infection
More PD-1- and TIGIT-expressing CD4+ T cells in granulomas from SIV/Mtb macaques
CD4+ T cells in granulomas from SIV/Mtb macaques produce less TNF
Acknowledgements
We would like to thank our veterinary staff at the University of Pittsburgh and University of Wisconsin-Madison for their excellent animal care. We are grateful for the pathology expertise of Edwin Klein, DVM. We also thank the NIH Tetramer Core Facility for developing and providing the MR-1 5-OPRU and MR-1 6-FP tetramers.
This work was supported by funding through the National Institute of Health (R01 AI-111815 and R21 AI-127127). Some of the research reported in this publication was supported in part by the Office of the Director, National Institutes of Health under Award Number P51OD011106 to the WNPRC, University of Wisconsin-Madison.
References
- 1.World Health Organization. Global tuberculosis report 2019. [Available from: https://www.who.int/teams/global-tuberculosis-programme/tb-reports].
- 2.Houben RM, Crampin AC, Ndhlovu R, Sonnenberg P, Godfrey-Faussett P, Haas WH, Engelmann G, Lombard CJ, Wilkinson D, Bruchfeld J, Lockman S, Tappero J, and Glynn JR. 2011. Human immunodeficiency virus associated tuberculosis more often due to recent infection than reactivation of latent infection. Int J Tuberc Lung Dis 15: 24–31. [PubMed] [Google Scholar]
- 3.Selwyn PA, Hartel D, Lewis VA, Schoenbaum EE, Vermund SH, Klein RS, Walker AT, and Friedland GH. 1989. A prospective study of the risk of tuberculosis among intravenous drug users with human immunodeficiency virus infection. N Engl J Med 320: 545–550. [DOI] [PubMed] [Google Scholar]
- 4.Antonucci G, Girardi E, Raviglione MC, and Ippolito G. 1995. Risk factors for tuberculosis in HIV-infected persons. A prospective cohort study. The Gruppo Italiano di Studio Tubercolosi e AIDS (GISTA). JAMA 274: 143–148. [DOI] [PubMed] [Google Scholar]
- 5.Badri M, Wilson D, and Wood R. 2002. Effect of highly active antiretroviral therapy on incidence of tuberculosis in South Africa: a cohort study. Lancet 359: 2059–2064. [DOI] [PubMed] [Google Scholar]
- 6.Selwyn PA, Sckell BM, Alcabes P, Friedland GH, Klein RS, and Schoenbaum EE. 1992. High risk of active tuberculosis in HIV-infected drug users with cutaneous anergy. JAMA 268: 504–509. [PubMed] [Google Scholar]
- 7.Sonnenberg P, Glynn JR, Fielding K, Murray J, Godfrey-Faussett P, and Shearer S. 2005. How soon after infection with HIV does the risk of tuberculosis start to increase? A retrospective cohort study in South African gold miners. J Infect Dis 191: 150–158. [DOI] [PubMed] [Google Scholar]
- 8.Lawn SD, Myer L, Edwards D, Bekker LG, and Wood R. 2009. Short-term and long-term risk of tuberculosis associated with CD4 cell recovery during antiretroviral therapy in South Africa. AIDS 23: 1717–1725. [DOI] [PMC free article] [PubMed] [Google Scholar]
- 9.Gupta A, Wood R, Kaplan R, Bekker LG, and Lawn SD. 2012. Tuberculosis incidence rates during 8 years of follow-up of an antiretroviral treatment cohort in South Africa: comparison with rates in the community. PLoS One 7: e34156. [DOI] [PMC free article] [PubMed] [Google Scholar]
- 10.Cadena AM, Flynn JL, and Fortune SM. 2016. The Importance of First Impressions: Early Events in Mycobacterium tuberculosis Infection Influence Outcome. mBio 7: e00342–00316. [DOI] [PMC free article] [PubMed] [Google Scholar]
- 11.Muller I, Cobbold SP, Waldmann H, and Kaufmann SH. 1987. Impaired resistance to Mycobacterium tuberculosis infection after selective in vivo depletion of L3T4+ and Lyt-2+ T cells. Infect Immun 55: 2037–2041. [DOI] [PMC free article] [PubMed] [Google Scholar]
- 12.Caruso AM, Serbina N, Klein E, Triebold K, Bloom BR, and Flynn JL. 1999. Mice deficient in CD4 T cells have only transiently diminished levels of IFN-gamma, yet succumb to tuberculosis. J Immunol 162: 5407–5416. [PubMed] [Google Scholar]
- 13.Poulsen A 1950. Some clinical features of tuberculosis. 1. Incubation period. Acta tuberculosea Scandinavica 24: 311–346. [PubMed] [Google Scholar]
- 14.Lin PL, Pawar S, Myers A, Pegu A, Fuhrman C, Reinhart TA, Capuano SV, Klein E, and Flynn JL. 2006. Early events in Mycobacterium tuberculosis infection in cynomolgus macaques. Infect Immun 74: 3790–3803. [DOI] [PMC free article] [PubMed] [Google Scholar]
- 15.Schmitz JE, and Korioth-Schmitz B. 2013. Immunopathogenesis of simian immunodeficiency virus infection in nonhuman primates. Current opinion in HIV and AIDS 8: 273–279. [DOI] [PMC free article] [PubMed] [Google Scholar]
- 16.Budde ML, Greene JM, Chin EN, Ericsen AJ, Scarlotta M, Cain BT, Pham NH, Becker EA, Harris M, Weinfurter JT, O’Connor SL, Piatak M Jr., Lifson JD, Gostick E, Price DA, Friedrich TC, and O’Connor DH. 2012. Specific CD8+ T cell responses correlate with control of simian immunodeficiency virus replication in Mauritian cynomolgus macaques. Journal of virology 86: 7596–7604. [DOI] [PMC free article] [PubMed] [Google Scholar]
- 17.Wiseman RW, Wojcechowskyj JA, Greene JM, Blasky AJ, Gopon T, Soma T, Friedrich TC, O’Connor SL, and O’Connor DH. 2007. Simian immunodeficiency virus SIVmac239 infection of major histocompatibility complex-identical cynomolgus macaques from Mauritius. Journal of virology 81: 349–361. [DOI] [PMC free article] [PubMed] [Google Scholar]
- 18.Cain BT, Pham NH, Budde ML, Greene JM, Weinfurter JT, Scarlotta M, Harris M, Chin E, O’Connor SL, Friedrich TC, and O’Connor DH. 2013. T cell response specificity and magnitude against SIVmac239 are not concordant in major histocompatibility complex-matched animals. Retrovirology 10: 116. [DOI] [PMC free article] [PubMed] [Google Scholar]
- 19.Capuano SV 3rd, Croix DA, Pawar S, Zinovik A, Myers A, Lin PL, Bissel S, Fuhrman C, Klein E, and Flynn JL. 2003. Experimental Mycobacterium tuberculosis infection of cynomolgus macaques closely resembles the various manifestations of human M. tuberculosis infection. Infect Immun 71: 5831–5844. [DOI] [PMC free article] [PubMed] [Google Scholar]
- 20.Scanga CA, and Flynn JL. 2014. Modeling tuberculosis in nonhuman primates. Cold Spring Harbor perspectives in medicine 4: a018564. [DOI] [PMC free article] [PubMed] [Google Scholar]
- 21.Anderson KG, Mayer-Barber K, Sung H, Beura L, James BR, Taylor JJ, Qunaj L, Griffith TS, Vezys V, Barber DL, and Masopust D. 2014. Intravascular staining for discrimination of vascular and tissue leukocytes. Nature protocols 9: 209–222. [DOI] [PMC free article] [PubMed] [Google Scholar]
- 22.Anderson KG, Sung H, Skon CN, Lefrancois L, Deisinger A, Vezys V, and Masopust D. 2012. Cutting edge: intravascular staining redefines lung CD8 T cell responses. J Immunol 189: 2702–2706. [DOI] [PMC free article] [PubMed] [Google Scholar]
- 23.Gideon HP, Phuah J, Myers AJ, Bryson BD, Rodgers MA, Coleman MT, Maiello P, Rutledge T, Marino S, Fortune SM, Kirschner DE, Lin PL, and Flynn JL. 2015. Variability in tuberculosis granuloma T cell responses exists, but a balance of pro- and anti-inflammatory cytokines is associated with sterilization. PLoS pathogens 11: e1004603. [DOI] [PMC free article] [PubMed] [Google Scholar]
- 24.Kauffman KD, Sallin MA, Sakai S, Kamenyeva O, Kabat J, Weiner D, Sutphin M, Schimel D, Via L, Barry CE 3rd, Wilder-Kofie T, Moore I, Moore R, and Barber DL. 2018. Defective positioning in granulomas but not lung-homing limits CD4 T-cell interactions with Mycobacterium tuberculosis-infected macrophages in rhesus macaques. Mucosal immunology 11: 462–473. [DOI] [PMC free article] [PubMed] [Google Scholar]
- 25.Diedrich CR, Mattila JT, Klein E, Janssen C, Phuah J, Sturgeon TJ, Montelaro RC, Lin PL, and Flynn JL. 2010. Reactivation of latent tuberculosis in cynomolgus macaques infected with SIV is associated with early peripheral T cell depletion and not virus load. PLoS One 5: e9611. [DOI] [PMC free article] [PubMed] [Google Scholar]
- 26.Mattila JT, Diedrich CR, Lin PL, Phuah J, and Flynn JL. 2011. Simian immunodeficiency virus-induced changes in T cell cytokine responses in cynomolgus macaques with latent Mycobacterium tuberculosis infection are associated with timing of reactivation. J Immunol 186: 3527–3537. [DOI] [PMC free article] [PubMed] [Google Scholar]
- 27.Mehra S, Golden NA, Dutta NK, Midkiff CC, Alvarez X, Doyle LA, Asher M, Russell-Lodrigue K, Monjure C, Roy CJ, Blanchard JL, Didier PJ, Veazey RS, Lackner AA, and Kaushal D. 2011. Reactivation of latent tuberculosis in rhesus macaques by coinfection with simian immunodeficiency virus. Journal of medical primatology 40: 233–243. [DOI] [PMC free article] [PubMed] [Google Scholar]
- 28.Foreman TW, Mehra S, LoBato DN, Malek A, Alvarez X, Golden NA, Bucşan AN, Didier PJ, Doyle-Meyers LA, Russell-Lodrigue KE, Roy CJ, Blanchard J, Kuroda MJ, Lackner AA, Chan J, Khader SA, Jacobs WR Jr., and Kaushal D. 2016. CD4+ T-cell-independent mechanisms suppress reactivation of latent tuberculosis in a macaque model of HIV coinfection. Proceedings of the National Academy of Sciences of the United States of America 113: E5636–5644. [DOI] [PMC free article] [PubMed] [Google Scholar]
- 29.Kuroda MJ, Sugimoto C, Cai Y, Merino KM, Mehra S, Araínga M, Roy CJ, Midkiff CC, Alvarez X, Didier ES, and Kaushal D. 2018. High Turnover of Tissue Macrophages Contributes to Tuberculosis Reactivation in Simian Immunodeficiency Virus-Infected Rhesus Macaques. J Infect Dis 217: 1865–1874. [DOI] [PMC free article] [PubMed] [Google Scholar]
- 30.Corleis B, Bucsan AN, Deruaz M, Vrbanac VD, Lisanti-Park AC, Gates SJ, Linder AH, Paer JM, Olson GS, Bowman BA, Schiff AE, Medoff BD, Tager AM, Luster AD, Khader SA, Kaushal D, and Kwon DS. 2019. HIV-1 and SIV Infection Are Associated with Early Loss of Lung Interstitial CD4+ T Cells and Dissemination of Pulmonary Tuberculosis. Cell reports 26: 1409–1418.e1405. [DOI] [PMC free article] [PubMed] [Google Scholar]
- 31.Bucşan AN, Chatterjee A, Singh DK, Foreman TW, Lee TH, Threeton B, Kirkpatrick MG, Ahmed M, Golden N, Alvarez X, Hoxie JA, Mehra S, Rengarajan J, Khader SA, and Kaushal D. 2019. Mechanisms of reactivation of latent tuberculosis infection due to SIV coinfection. The Journal of clinical investigation 129: 5254–5260. [DOI] [PMC free article] [PubMed] [Google Scholar]
- 32.Guo M, Xian QY, Rao Y, Zhang J, Wang Y, Huang ZX, Wang X, Bao R, Zhou L, Liu JB, Tang ZJ, Guo DY, Qin C, Li JL, and Ho WZ. 2016. SIV Infection Facilitates Mycobacterium tuberculosis Infection of Rhesus Macaques. Frontiers in microbiology 7: 2174. [DOI] [PMC free article] [PubMed] [Google Scholar]
- 33.Shen Y, Shen L, Sehgal P, Zhou D, Simon M, Miller M, Enimi EA, Henckler B, Chalifoux L, Sehgal N, Gastron M, Letvin NL, and Chen ZW. 2001. Antiretroviral agents restore Mycobacterium-specific T-cell immune responses and facilitate controlling a fatal tuberculosis-like disease in Macaques coinfected with simian immunodeficiency virus and Mycobacterium bovis BCG. Journal of virology 75: 8690–8696. [DOI] [PMC free article] [PubMed] [Google Scholar]
- 34.Shen Y, Zhou D, Chalifoux L, Shen L, Simon M, Zeng X, Lai X, Li Y, Sehgal P, Letvin NL, and Chen ZW. 2002. Induction of an AIDS virus-related tuberculosis-like disease in macaques: a model of simian immunodeficiency virus- mycobacterium coinfection. Infect Immun 70: 869–877. [DOI] [PMC free article] [PubMed] [Google Scholar]
- 35.Rodgers MA, Ameel C, Ellis-Connell AL, Balgeman AJ, Maiello P, Barry GL, Friedrich TC, Klein E, O’Connor SL, and Scanga CA. 2018. Preexisting Simian Immunodeficiency Virus Infection Increases Susceptibility to Tuberculosis in Mauritian Cynomolgus Macaques. Infect Immun 86. [DOI] [PMC free article] [PubMed] [Google Scholar]
- 36.Lin PL, Ford CB, Coleman MT, Myers AJ, Gawande R, Ioerger T, Sacchettini J, Fortune SM, and Flynn JL. 2014. Sterilization of granulomas is common in active and latent tuberculosis despite within-host variability in bacterial killing. Nature medicine 20: 75–79. [DOI] [PMC free article] [PubMed] [Google Scholar]
- 37.Budde ML, Wiseman RW, Karl JA, Hanczaruk B, Simen BB, and O’Connor DH. 2010. Characterization of Mauritian cynomolgus macaque major histocompatibility complex class I haplotypes by high-resolution pyrosequencing. Immunogenetics 62: 773–780. [DOI] [PMC free article] [PubMed] [Google Scholar]
- 38.Karl JA, Wiseman RW, Campbell KJ, Blasky AJ, Hughes AL, Ferguson B, Read DS, and O’Connor DH. 2008. Identification of MHC class I sequences in Chinese-origin rhesus macaques. Immunogenetics 60: 37–46. [DOI] [PMC free article] [PubMed] [Google Scholar]
- 39.Karl JA, Heimbruch KE, Vriezen CE, Mironczuk CJ, Dudley DM, Wiseman RW, and O’Connor DH. 2014. Survey of major histocompatibility complex class II diversity in pig-tailed macaques. Immunogenetics 66: 613–623. [DOI] [PMC free article] [PubMed] [Google Scholar]
- 40.Lin PL, Rodgers M, Smith L, Bigbee M, Myers A, Bigbee C, Chiosea I, Capuano SV, Fuhrman C, Klein E, and Flynn JL. 2009. Quantitative comparison of active and latent tuberculosis in the cynomolgus macaque model. Infect Immun 77: 4631–4642. [DOI] [PMC free article] [PubMed] [Google Scholar]
- 41.Maiello P, DiFazio RM, Cadena AM, Rodgers MA, Lin PL, Scanga CA, and Flynn JL. 2018. Rhesus Macaques Are More Susceptible to Progressive Tuberculosis than Cynomolgus Macaques: a Quantitative Comparison. Infect Immun 86. [DOI] [PMC free article] [PubMed] [Google Scholar]
- 42.Ellis AL, Balgeman AJ, Larson EC, Rodgers MA, Ameel C, Baranowski T, Kannal N, Maiello P, Juno JA, Scanga CA, and O’Connor SL. 2020. MAIT cells are functionally impaired in a Mauritian cynomolgus macaque model of SIV and Mtb co-infection. PLoS pathogens 16: e1008585. [DOI] [PMC free article] [PubMed] [Google Scholar]
- 43.Roederer M, Nozzi JL, and Nason MC. 2011. SPICE: exploration and analysis of post-cytometric complex multivariate datasets. Cytometry A 79: 167–174. [DOI] [PMC free article] [PubMed] [Google Scholar]
- 44.Ganchua SKC, Cadena AM, Maiello P, Gideon HP, Myers AJ, Junecko BF, Klein EC, Lin PL, Mattila JT, and Flynn JL. 2018. Lymph nodes are sites of prolonged bacterial persistence during Mycobacterium tuberculosis infection in macaques. PLoS pathogens 14: e1007337. [DOI] [PMC free article] [PubMed] [Google Scholar]
- 45.McBride JA, and Striker R. 2017. Imbalance in the game of T cells: What can the CD4/CD8 T-cell ratio tell us about HIV and health? PLoS pathogens 13: e1006624. [DOI] [PMC free article] [PubMed] [Google Scholar]
- 46.Margolick JB, Muñoz A, Donnenberg AD, Park LP, Galai N, Giorgi JV, O’Gorman MR, and Ferbas J. 1995. Failure of T-cell homeostasis preceding AIDS in HIV-1 infection. The Multicenter AIDS Cohort Study. Nature medicine 1: 674–680. [DOI] [PubMed] [Google Scholar]
- 47.Center for Disease Control. 2020. About HIV/AIDS. [Available from: https://www.cdc.gov/hiv/basics/whatishiv.html].
- 48.O’Connor SL, Becker EA, Weinfurter JT, Chin EN, Budde ML, Gostick E, Correll M, Gleicher M, Hughes AL, Price DA, Friedrich TC, and O’Connor DH. 2012. Conditional CD8+ T cell escape during acute simian immunodeficiency virus infection. Journal of virology 86: 605–609. [DOI] [PMC free article] [PubMed] [Google Scholar]
- 49.Serbina NV, Lazarevic V, and Flynn JL. 2001. CD4(+) T cells are required for the development of cytotoxic CD8(+) T cells during Mycobacterium tuberculosis infection. J Immunol 167: 6991–7000. [DOI] [PubMed] [Google Scholar]
- 50.van Pinxteren LA, Cassidy JP, Smedegaard BH, Agger EM, and Andersen P. 2000. Control of latent Mycobacterium tuberculosis infection is dependent on CD8 T cells. European journal of immunology 30: 3689–3698. [DOI] [PubMed] [Google Scholar]
- 51.Lin PL, and Flynn JL. 2015. CD8 T cells and Mycobacterium tuberculosis infection. Seminars in immunopathology 37: 239–249. [DOI] [PMC free article] [PubMed] [Google Scholar]
- 52.Okoye AA, and Picker LJ. 2013. CD4(+) T-cell depletion in HIV infection: mechanisms of immunological failure. Immunological reviews 254: 54–64. [DOI] [PMC free article] [PubMed] [Google Scholar]
- 53.Bunjun R, Riou C, Soares AP, Thawer N, Müller TL, Kiravu A, Ginbot Z, Oni T, Goliath R, Kalsdorf B, von Groote-Bidlingmaier F, Hanekom W, Walzl G, Wilkinson RJ, and Burgers WA. 2017. Effect of HIV on the Frequency and Number of Mycobacterium tuberculosis-Specific CD4+ T Cells in Blood and Airways During Latent M. tuberculosis Infection. J Infect Dis 216: 1550–1560. [DOI] [PMC free article] [PubMed] [Google Scholar]
- 54.Mwale A, Hummel A, Mvaya L, Kamng’ona R, Chimbayo E, Phiri J, Malamba R, Kankwatira A, Mwandumba HC, and Jambo KC. 2017. B cell, CD8 (+) T cell and gamma delta T cell infiltration alters alveolar immune cell homeostasis in HIV-infected Malawian adults. Wellcome open research 2: 105. [DOI] [PMC free article] [PubMed] [Google Scholar]
- 55.Diedrich CR, and Flynn JL. 2011. HIV-1/mycobacterium tuberculosis coinfection immunology: how does HIV-1 exacerbate tuberculosis? Infect Immun 79: 1407–1417. [DOI] [PMC free article] [PubMed] [Google Scholar]
- 56.Diedrich CR, Rutledge T, Maiello P, Baranowski TM, White AG, Borish HJ, Karell P, Hopkins F, Brown J, Fortune SM, Flynn JL, Ambrose Z, and Lin PL. 2020. SIV and Mycobacterium tuberculosis synergy within the granuloma accelerates the reactivation pattern of latent tuberculosis. PLoS pathogens 16: e1008413. [DOI] [PMC free article] [PubMed] [Google Scholar]
- 57.Bean AG, Roach DR, Briscoe H, France MP, Korner H, Sedgwick JD, and Britton WJ. 1999. Structural deficiencies in granuloma formation in TNF gene-targeted mice underlie the heightened susceptibility to aerosol Mycobacterium tuberculosis infection, which is not compensated for by lymphotoxin. J Immunol 162: 3504–3511. [PubMed] [Google Scholar]
- 58.Allie N, Grivennikov SI, Keeton R, Hsu NJ, Bourigault ML, Court N, Fremond C, Yeremeev V, Shebzukhov Y, Ryffel B, Nedospasov SA, Quesniaux VF, and Jacobs M. 2013. Prominent role for T cell-derived tumour necrosis factor for sustained control of Mycobacterium tuberculosis infection. Scientific reports 3: 1809. [DOI] [PMC free article] [PubMed] [Google Scholar]
- 59.Botha T, and Ryffel B. 2003. Reactivation of latent tuberculosis infection in TNF-deficient mice. J Immunol 171: 3110–3118. [DOI] [PubMed] [Google Scholar]
- 60.Lin PL, Myers A, Smith L, Bigbee C, Bigbee M, Fuhrman C, Grieser H, Chiosea I, Voitenek NN, Capuano SV, Klein E, and Flynn JL. 2010. Tumor necrosis factor neutralization results in disseminated disease in acute and latent Mycobacterium tuberculosis infection with normal granuloma structure in a cynomolgus macaque model. Arthritis and rheumatism 62: 340–350. [DOI] [PMC free article] [PubMed] [Google Scholar]
- 61.Keane J, Gershon S, Wise RP, Mirabile-Levens E, Kasznica J, Schwieterman WD, Siegel JN, and Braun MM. 2001. Tuberculosis associated with infliximab, a tumor necrosis factor alpha-neutralizing agent. N Engl J Med 345: 1098–1104. [DOI] [PubMed] [Google Scholar]
- 62.Denis B, Lefort A, Flipo RM, Tubach F, Lemann M, Ravaud P, Salmon D, Mariette X, and Lortholary O. 2008. Long-term follow-up of patients with tuberculosis as a complication of tumour necrosis factor (TNF)-alpha antagonist therapy: safe re-initiation of TNF-alpha blockers after appropriate anti-tuberculous treatment. Clinical microbiology and infection : the official publication of the European Society of Clinical Microbiology and Infectious Diseases 14: 183–186. [DOI] [PubMed] [Google Scholar]
- 63.Sodora DL, and Silvestri G. 2008. Immune activation and AIDS pathogenesis. Aids 22: 439–446. [DOI] [PubMed] [Google Scholar]
- 64.Giorgi JV, Hultin LE, McKeating JA, Johnson TD, Owens B, Jacobson LP, Shih R, Lewis J, Wiley DJ, Phair JP, Wolinsky SM, and Detels R. 1999. Shorter survival in advanced human immunodeficiency virus type 1 infection is more closely associated with T lymphocyte activation than with plasma virus burden or virus chemokine coreceptor usage. J Infect Dis 179: 859–870. [DOI] [PubMed] [Google Scholar]
- 65.Orendi JM, Bloem AC, Borleffs JC, Wijnholds FJ, de Vos NM, Nottet HS, Visser MR, Snippe H, Verhoef J, and Boucher CA. 1998. Activation and cell cycle antigens in CD4+ and CD8+ T cells correlate with plasma human immunodeficiency virus (HIV-1) RNA level in HIV-1 infection. J Infect Dis 178: 1279–1287. [DOI] [PubMed] [Google Scholar]
- 66.Mir KD, Gasper MA, Sundaravaradan V, and Sodora DL. 2011. SIV infection in natural hosts: resolution of immune activation during the acute-to-chronic transition phase. Microbes and infection 13: 14–24. [DOI] [PMC free article] [PubMed] [Google Scholar]
- 67.Estes JD, Gordon SN, Zeng M, Chahroudi AM, Dunham RM, Staprans SI, Reilly CS, Silvestri G, and Haase AT. 2008. Early resolution of acute immune activation and induction of PD-1 in SIV-infected sooty mangabeys distinguishes nonpathogenic from pathogenic infection in rhesus macaques. J Immunol 180: 6798–6807. [DOI] [PMC free article] [PubMed] [Google Scholar]
- 68.Barber DL, Mayer-Barber KD, Feng CG, Sharpe AH, and Sher A. 2011. CD4 T cells promote rather than control tuberculosis in the absence of PD-1-mediated inhibition. J Immunol 186: 1598–1607. [DOI] [PMC free article] [PubMed] [Google Scholar]
- 69.Sakai S, Kauffman KD, Sallin MA, Sharpe AH, Young HA, Ganusov VV, and Barber DL. 2016. CD4 T Cell-Derived IFN-γ Plays a Minimal Role in Control of Pulmonary Mycobacterium tuberculosis Infection and Must Be Actively Repressed by PD-1 to Prevent Lethal Disease. PLoS pathogens 12: e1005667. [DOI] [PMC free article] [PubMed] [Google Scholar]
- 70.Leal IS, Smedegård B, Andersen P, and Appelberg R. 2001. Failure to induce enhanced protection against tuberculosis by increasing T-cell-dependent interferon-gamma generation. Immunology 104: 157–161. [DOI] [PMC free article] [PubMed] [Google Scholar]
- 71.Mittrücker HW, Steinhoff U, Köhler A, Krause M, Lazar D, Mex P, Miekley D, and Kaufmann SH. 2007. Poor correlation between BCG vaccination-induced T cell responses and protection against tuberculosis. Proceedings of the National Academy of Sciences of the United States of America 104: 12434–12439. [DOI] [PMC free article] [PubMed] [Google Scholar]
- 72.Kagina BM, Abel B, Scriba TJ, Hughes EJ, Keyser A, Soares A, Gamieldien H, Sidibana M, Hatherill M, Gelderbloem S, Mahomed H, Hawkridge A, Hussey G, Kaplan G, and Hanekom WA. 2010. Specific T cell frequency and cytokine expression profile do not correlate with protection against tuberculosis after bacillus Calmette-Guérin vaccination of newborns. American journal of respiratory and critical care medicine 182: 1073–1079. [DOI] [PMC free article] [PubMed] [Google Scholar]
- 73.Day CL, Abrahams DA, Harris LD, van Rooyen M, Stone L, de Kock M, and Hanekom WA. 2017. HIV-1 Infection Is Associated with Depletion and Functional Impairment of Mycobacterium tuberculosis-Specific CD4 T Cells in Individuals with Latent Tuberculosis Infection. J Immunol 199: 2069–2080. [DOI] [PMC free article] [PubMed] [Google Scholar]
- 74.Pollock KM, Montamat-Sicotte DJ, Grass L, Cooke GS, Kapembwa MS, Kon OM, Sampson RD, Taylor GP, and Lalvani A. 2016. PD-1 Expression and Cytokine Secretion Profiles of Mycobacterium tuberculosis-Specific CD4+ T-Cell Subsets; Potential Correlates of Containment in HIV-TB Co-Infection. PLoS One 11: e0146905. [DOI] [PMC free article] [PubMed] [Google Scholar]
- 75.Day CL, Kaufmann DE, Kiepiela P, Brown JA, Moodley ES, Reddy S, Mackey EW, Miller JD, Leslie AJ, DePierres C, Mncube Z, Duraiswamy J, Zhu B, Eichbaum Q, Altfeld M, Wherry EJ, Coovadia HM, Goulder PJ, Klenerman P, Ahmed R, Freeman GJ, and Walker BD. 2006. PD-1 expression on HIV-specific T cells is associated with T-cell exhaustion and disease progression. Nature 443: 350–354. [DOI] [PubMed] [Google Scholar]
- 76.Trautmann L, Janbazian L, Chomont N, Said EA, Gimmig S, Bessette B, Boulassel MR, Delwart E, Sepulveda H, Balderas RS, Routy JP, Haddad EK, and Sekaly RP. 2006. Upregulation of PD-1 expression on HIV-specific CD8+ T cells leads to reversible immune dysfunction. Nature medicine 12: 1198–1202. [DOI] [PubMed] [Google Scholar]
- 77.Velu V, Kannanganat S, Ibegbu C, Chennareddi L, Villinger F, Freeman GJ, Ahmed R, and Amara RR. 2007. Elevated expression levels of inhibitory receptor programmed death 1 on simian immunodeficiency virus-specific CD8 T cells during chronic infection but not after vaccination. Journal of virology 81: 5819–5828. [DOI] [PMC free article] [PubMed] [Google Scholar]
- 78.Velu V, Titanji K, Zhu B, Husain S, Pladevega A, Lai L, Vanderford TH, Chennareddi L, Silvestri G, Freeman GJ, Ahmed R, and Amara RR. 2009. Enhancing SIV-specific immunity in vivo by PD-1 blockade. Nature 458: 206–210. [DOI] [PMC free article] [PubMed] [Google Scholar]
- 79.Petrovas C, Casazza JP, Brenchley JM, Price DA, Gostick E, Adams WC, Precopio ML, Schacker T, Roederer M, Douek DC, and Koup RA. 2006. PD-1 is a regulator of virus-specific CD8+ T cell survival in HIV infection. J Exp Med 203: 2281–2292. [DOI] [PMC free article] [PubMed] [Google Scholar]
- 80.Day CL, Abrahams DA, Bunjun R, Stone L, de Kock M, Walzl G, Wilkinson RJ, Burgers WA, and Hanekom WA. 2018. PD-1 Expression on Mycobacterium tuberculosis-Specific CD4 T Cells Is Associated With Bacterial Load in Human Tuberculosis. Frontiers in immunology 9: 1995. [DOI] [PMC free article] [PubMed] [Google Scholar]
- 81.Wong EA, Joslyn L, Grant NL, Klein E, Lin PL, Kirschner DE, and Flynn JL. 2018. Low Levels of T Cell Exhaustion in Tuberculous Lung Granulomas. Infect Immun 86. [DOI] [PMC free article] [PubMed] [Google Scholar]
Associated Data
This section collects any data citations, data availability statements, or supplementary materials included in this article.