

Abstract
Introduction:
Neurosurgeons represent 0.5% of all physicians and currently face a high burden of disease. Physician-scientists are essential to advance the mission of National Academies of Science (NAS) and National Institutes of Health (NIH) through discovery and bench to bedside translation. We investigated trends in NIH neurosurgeon-scientist funding over time as an indicator of physician-scientist workforce training.
Methods:
We used NIH Research Portfolio Online Reporting Tools (RePORTER) to extract grants to neurosurgery departments and neurosurgeons from 1993 to 2017. Manual extraction of each individual grant awardee was conducted.
Results:
After adjusting for U.S. inflation (base year: 1993), NIH funding to neurosurgery departments increased yearly (P <0.00001). However, neurosurgeon-scientists received significantly less NIH funding compared to scientists (including basic scientists and research only neurosurgeons) (P = 0.09). The ratio of neurosurgeon-scientists to scientists receiving grants was significantly reduced (P = 0.002). Interestingly, the percentage of oncology-related neurosurgery grants significantly increased throughout the study period (P = 0.002). The average number of grants per neurosurgeon-scientists showed an upward trend (P <0.001); however, the average number of grants for early-career neurosurgeon-scientists, showed a significant downward trend (P = 0.05).
Conclusion:
Over the past 23 years, despite the overall increasing trends in the number of NIH grants awarded to neurosurgery departments overall, the proportion of neurosurgeon-scientists that were awarded NIH grants compared to scientists demonstrates a declining trend. This observed shift is disproportionate in the number of NIH grants awarded to senior level compared to early-career neurosurgeon-scientists, with more funding allocated towards neurosurgical-oncology-related grants.
Keywords: Neurosurgeon-Scientist, Clinician-scientist, National Institutional of Health (NIH) funding to neuro-surgery, Funding, Training, Research
Introduction
Over the last 30 years, physicians and surgeons have been pressured to see an increasing number of patients despite less available time, more administrative and clerical burdens, and relatively flat Medicare reimbursements compared to inflation.[1] These factors culminate in an increasingly challenging economic dilemma for clinical neurosurgery departments to support long-term, high quality patient care operations and basic/translational research training for neurosurgery trainees.[2] Patient care demands continue to escalate with total U.S. health care expenditures in 2017, exceeding $3.2 trillion USD per year, which is 16% of the U.S. Gross Domestic Product (GDP).[2] In contrast, NIH funding for physician-scientists since 1970 appears stagnant/declining after adjusting for inflation, which makes it more difficult for early and mid-career physician-scientists to obtain critical project grant NIH funding[3,4,2,5]. Although neurosurgeons comprise only 0.5% of all physicians[1] in the U.S., they make critical contributions as physician-scientists.
There also exists a systemic issue within the structure of neurosurgery training. The Society of Neurological Surgeons (SNS) created the Committee for Accreditation of Subspecialty Training (CAST) to develop a system for subspecialty fellowship training programs, increasing neurosurgical sub-specialization since 1999.[6] The Accreditation Council for Graduate Medical Education (ACGME) limited the number of work hours per week for all physician-surgeon trainees. U.S. neurosurgery training is now seven years after medical school because of these competing factors, which adds considerable educational debt and stressful burden upon residents and young attendings. Neurosurgery residents face a “triple-headed” dilemma within training: the first is whether to apply to an additional clinical subspecialty training during or after residency; the second is whether to pursue an academic-research career, possibly with inadequate exposure; and the third is whether to leave academia altogether and enter private practice [7–9] to generate revenue to pay off considerable debt. Educational indebtedness after medical school for neurosurgery residents averages about $200,000 in 37% of residents and increases rapidly due to compounded interest.[10] It caused a shift to private practice, which in turn paradoxically reduces the early-career path physician-scientist pool and potential for discovery, translation, and application to advance neuroscience and future care.[11,12]
An imperative emphasis on research in the field of neurosurgery has potentially dwindled, which is reflected by, and partially rooted in, training program curricula. The neurosurgery residency research requirements for the Accreditation Council for Graduate Medical Education/Residency Review Committee (ACGME/RRC) are graded as “higher-level” or “aspirational” goals and vary significantly between institutions[13]; research projects can be substituted for quality improvement projects.[14] Compounding this issue over the last decade, there is exponentially less formalized required research training in residency [14,7,15–17]. To help fill this research-focused education gap and bolster the NIH mission, we believe neurosurgery residency programs should provide formalized research training. This focus will help foster more innovative and advanced scientific skills, as well as better prepare residents in applying for future NIH grants.[18–22,14,23] The purpose of this study is to report baseline trends in neurosurgery NIH funding between 1993 and 2017, to shed light on potential neurosurgeon-scientist research training trends, and to possibly enhance future residency research training programs. We additionally performed a sub-analysis of grants for neurosurgeon scientists in the areas of oncology compared to non-oncology neurosurgery NIH funding.
Materials and Methods
Selection Criteria and Reported Variables.
Utilizing NIH RePORTER (Research Portfolio Online Reporting Tools) (https://projectreporter.nih.gov/reporter.cfm),[24] we extracted NIH grant information with bibliometric data from 1993 to 2017. We analyzed all active grants for the 2018 Fiscal Year (Figure 1). Categories of grants were collected as well as the total number of grants, funding, and success rates. We collected all types of NIH grants, but focused on R01 grant trends (see supplementary materials) since they represent a historically well-known NIH mechanism and an important “independent” researcher status of a principal investigator (PI).
Figure 1.

Sunburst diagram showing the NIH grant sorting process. NIH RePORTER (Research Portfolio Online Reporting Tools) was used to extract grant data for neurosurgery department. Neurosurgeon-Scientists group include the board-certified neurosurgeons who are currently in practice. Scientists group includes the basic science faculty, postdoctoral fellows, graduate students, and neurosurgeons who are not performing surgeries and dedicate their time for research only. The data showed that over the period from 1993 to 2017, a total of 1464 grants were awarded to 716 awardees within neurosurgery departments. As we break it down, we show that 424 NIH grants were awarded to 213 neurosurgeon-scientists, while 1040 NIH grants were awarded to 503 scientists, some of which may have received multiple grants. Further break down of grants include oncology vs non-oncology grants and then the last layer was R01 vs non-R01 grants. PIs/Awardees data was further categorized into female vs male and then PIs receiving more than 1 grant over the study period.
Other information extracted from the NIH RePORTER included the number of applications and the average dollar award. Funding was categorized by Research Project Grants, Research Centers, or Other Research. Funding data for each NIH Institute were obtained. For each neurosurgery grant, the following parameters were obtained: principal investigator (PI), other PI, grant type (e.g., R01 or K), and amount awarded. Principal investigators’ demographic information, including sex, academic rank, and professional title, was collected separately using the individual institutional search. We categorized academic ranks and titles such as Associate Dean, Chair of Department, Vice Chair of Department, Professor, Associate Professor, Assistant Professor status, surgeons with no academic title/rank, and other categories, such as Fellow Associate, Chief, and Resident. We categorized doctoral or dual doctoral status as MD, MD-PhD, and PhD.
We categorized PIs into two groups: neurosurgeon-scientists, which included all currently practicing neurosurgeons, including private practice and academic status, and scientists, which included basic science faculty, researchers, postdoctoral fellows, graduate students, and neurosurgeons who are not currently practicing and dedicate their full time for research within a neurosurgical department (Figure 1). In order to assess researcher impact, the bibliometric data (number of publications, number of citations per publication, and H-index) for each PI were extracted manually from the Scopus database.[25,26] Publications were defined using unique numbers indexed in National Library of Medicine (NLM, PubMed), and publication citations were defined as the number of times a publication was cited without self-citations. H-index is a quantitative metric based on the number of citations, publications, and citations per publication used in prior neurosurgery research to estimate publications and author impact.[27] Residents’ information was extracted from the ACGME Data Resource Books. To examine the “age of researcher,” we calculated the time from first publication to first NIH Grant. Finally, oncology-related grants vs. non-oncology-related grants based on the project title were categorized for sub-analysis. Only grants specifically related to or referencing an oncological topic were considered as oncology-related grants. Ethics and institutional review board approval were not applicable for this study, as only publicly accessible data were utilized.
Statistical Analysis.
Categorical variables were represented using counts and proportions; continuous variables were represented using means and standard deviation. For analysis of continuous variables, Mann-Whitney U-tests, Kruskal-Wallis tests, student’s t-tests, and analysis of variance (ANOVA) tests were used. Categorical variables were analyzed using Fisher’s exact test. Regression models (both linear and local scatterplot smoothing) were used to determine factors associated with NIH funding. Significance threshold (α) was set to 0.05 (two-sided). Data was stored in Microsoft Excel (Version 16.15); R (Version 3.4.0) was used for statistical analysis. All statistics were analyzed by two of the authors (S.T. and R.E.C) with biostatistical experience.
Results
NIH Funding Analysis to Neurosurgery Departments.
Funding data was available from 1993 to 2017. The vast majority of NIH funding, 1,040 grants (71%), went to 503 (70%) scientists compared to 424 grants (29%) that went to 213 (30%) neurosurgeon-scientists (Figure 1). Over 23 years, there was a strong positive up-trend for overall neurosurgery department funding (after adjusting for U.S. inflation base year 1993) regardless of doctoral background (β = 3.38 million USD/year, P <0.00001, and R2 = 0.71), as well as funding to scientists in the department (β = 2.26 million USD/year, P <0.00001, and R2 = 0.70) (Figure 2). A transient increase in funding was seen in the ratio of neurosurgeon-scientists to scientists in years 1995–1996, followed by a plateaued/declining trend in funding shown by local scatterplot smoothing regression (LOESS) and standard linear regression over all years (Figure 3A) (β = −0.002, P =0.09, and R2 = 0.19). Using the LOESS (locally estimated scatterplot smoothing) regression method, a decreasing trend was seen during the initial years from approximately 1993 to 2006, followed by a plateau with possible upward trend (R2 = 0.22) (Figure 3A). Over the 23-year study period, we found a significant decreasing trend in the ratio of the number of neurosurgeon-scientists to number of scientists (within the neurosurgical department) receiving NIH grants (β = −0.003, P = 0.002, and R2 = 0.36) (Figure 3B). We also compared the total number of NIH-funded neurosurgeon-scientists to the total number of NIH-funded neurologist-scientists during the same period. Our results showed a significant decline of the ratio of NIH-funded neurosurgeon-scientists compared to neurologist-scientists colleagues receiving NIH funding (β = −0.004, P = 0.0001, and R2 = 0.52) (Figure 3C).
Figure 2.

NIH Funding to Neurosurgery Department from 1993 to 2017 in 1993 Dollars. Funding was further broken down by PI type (Neurosurgeon-Scientists and Scientists). Trendlines are shown by the dotted line. (All the numbers were adjusted to 1993 USA dollars). All three [Total neurosurgery funding, Funding to Scientists, and Funding to Neurosurgeon-Scientists] regressions were significant.
Figure 3.
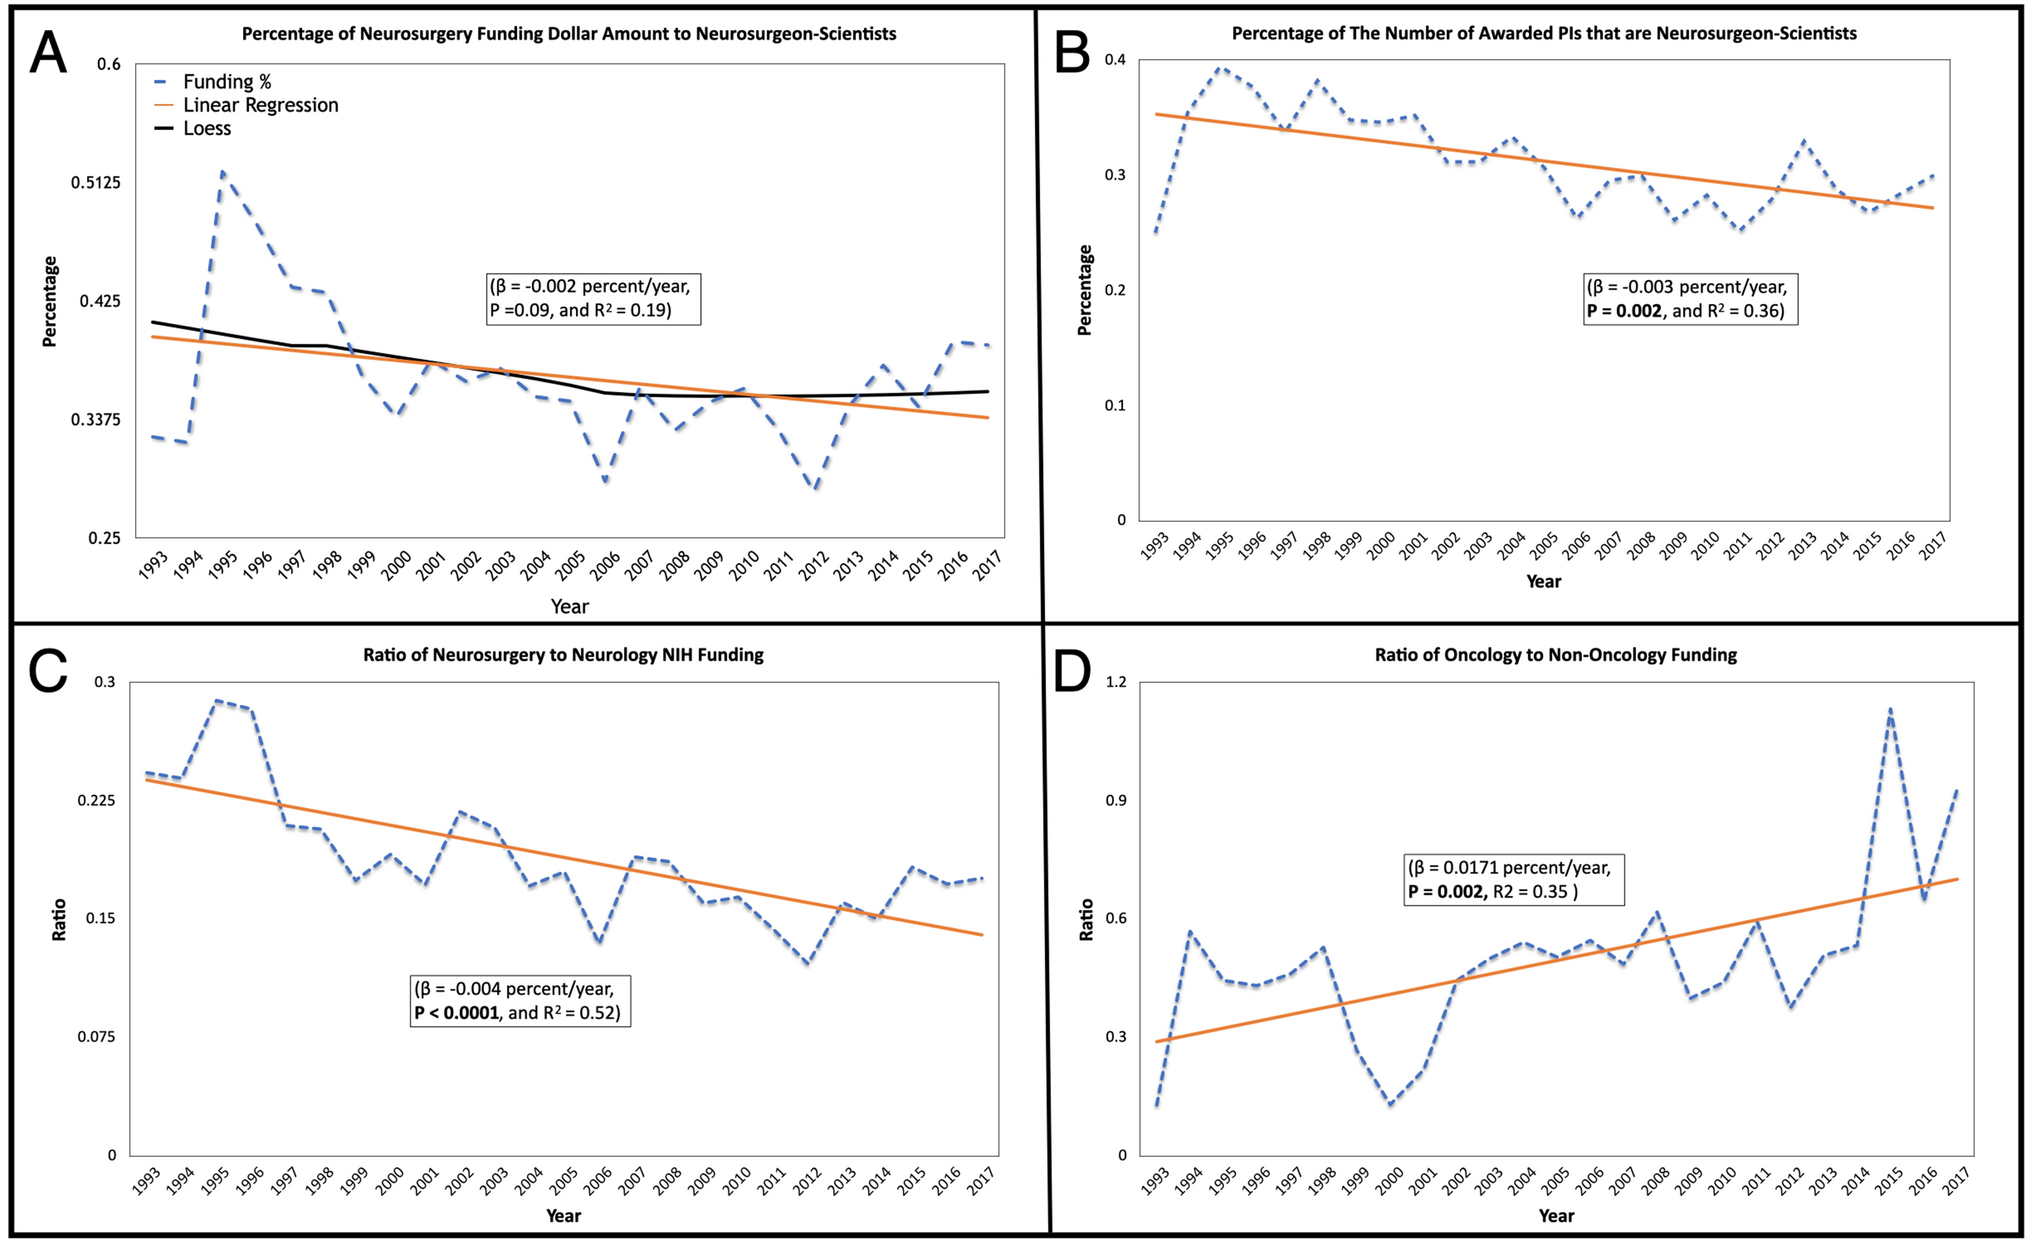
A) Linear regression of the % of Neurosurgery funding amount in dollars that goes to Neurosurgeon-Scientists. A downward trend is seen in the data (i.e. Neurosurgeon-Scientists are making up less and less of the funding going to neurosurgery department) however this was non-significant. Addition loess regression was analyzed (shown by black line) (R2 = 0.22). B) Percentage of the number of PIs awarded NIH funding that are neurosurgeon-scientists per year. The trendline is shown by the dotted line. 25% of PIs were neurosurgeon-scientists in 1993 and peaked at 40% in 1995 and is now approximately 30%. Regression line was significant. C) Linear regression (P < 0.0001, and R2 = 0.52) of the ratio of Neurosurgery funding to Neurology funding. Only funding to physicians-scientists (MD or MD/PhD) was included for analysis. A clear and significant downward trend is seen, i.e. neurologists are outperforming neurosurgeons in terms of receiving NIH funding. D) Linear regression (P = 0.002, and R2 = 0.35) of the ratio of Neurosurgery Oncology-related Grant funding to Neurosurgery Non-Oncology-related funding. A clear and significant upward trend is seen, i.e. neurosurgery oncology grants are outperforming non-oncology neurosurgery grants in terms of receiving NIH funding.
Neuro-Oncology Sub-Analysis.
We performed a sub-analysis regarding the oncology-related grants compared to the non-oncology-related grants awarded to neurosurgeons during the same period. Our results showed a significant increase in the ratio of neurosurgery oncology grants to non-oncology neurosurgery grant funding (β =0.0171, P = 0.002, and R2 = 0.35) (Figure 3D). In 1993, oncology-related grants made up only 11%, whereas in 2017, oncology-related grants made up 48% of the total neurosurgery grants.
Characteristics of NIH Funding for Neurosurgeon-Scientists and Academic Rank in 2018.
In fiscal year 2018, we analyzed 367 active NIH grants awarded to all neurosurgery types, of which 129 (35%) were awarded to neurosurgeon-scientists (Table 1). Active grants are defined as grants currently funded from January 1, 2018 through the end of 2018. Among the 129 active NIH grants going to neurosurgeon-scientists, 63 (48.8%) of grants were R01 type. When examining average funding received, average H-Index, and the average number of grants, we observed that the faculty ranked as professors (at the time the search was conducted) had the highest values among all practicing neurosurgeons with active grants (P<0.01, P<0.01, P<0.05, respectively) (Fig. S1).
Table 1.
The 2018 active NIH neurosurgery grants awarded to neurosurgeon-scientists and scientists (including basic scientists, postdoctoral fellows, graduate students, and neurosurgeons who are not performing surgeries and dedicate their time for research only).
| Grant Type | Number of Active Neurosurgery Grants Awarded to Neurosurgeon-Scientists | Number of Active Neurosurgery Grants Awarded Scientists |
|---|---|---|
| Grand Total | 129 | 238 |
| R01 | 63 (48.8%) | 144 (61.0%) |
| U01 | 13 (10.1%) | 7 (2.9%) |
| K08 | 10 (7.8%) | 1 (0.4%) |
| R21 | 9 (7.0%) | 29 (12.2%) |
| R25 | 7 (5.4%) | 2 (0.8%) |
| Other | 27 (20%) | 55 (23%) |
Factors from 1993–2017 Associated with NIH-Funding for Neurosurgeon-Scientists.
From 1993 to 2017, a total of 1,464 neurosurgery grants were awarded, 29% (424/1,464) of which were awarded to neurosurgeon-scientists (Table 2). 716 grant awardees obtained at least 1 NIH-funded grant between 1993 and 2017, of which only 30% (213/716) were neurosurgeon-scientists (Table 2), with the remainder awarded to scientists (within the neurosurgical department) of which 13 grants had a neurosurgeon listed as other PI. Covariates associated with the current total amount of funding increased with citations per article, number of published papers, total number of citations, and H-index (at the time the search was conducted) (Figure 4).[22] NIH funding dollar amounts were independently associated with average citations per article (β =0.05 million USD/citation, 3, P < 0.001, R2 = 0.06) (Figure 4A), total number of citations (β = 0.00038 million USD/citation, P < 0.00001, R2 = 0.25) (Figure 4B), total number of published papers (β =0.015 million USD/paper, 3, P < 0.00001, R2 = 0.13) (Figure 4C), and H-index (β = 0.13 million USD/H-Index, 3, P < 0.00001, R2 = 0.25) (Figure 4D). There was no fixed cut-off values for beta regression coefficients. In other words, we found that for every one-point increase in average citations per article, the total NIH-funding to a neurosurgeon-scientists would increase by 0.05 points (1 point = $1 million 1993 USA dollars), since β = 0.05 million USD/citation.
Table 2.
Break down of grant type by number of grants awarded and number of awardee (neurosurgeon-scientists and scientists) from 1993–2017.
| Grant Type | Number of Neurosurgery Grants Awarded | Number of Neurosurgery Grants Awarded to Neurosurgeon-Scientists | Number of Scientists | Number of Neurosurgeon-Scientists |
|---|---|---|---|---|
| Grand Total | 1464 | 424* | 716 | 213* |
| R01 | 694 (47.4%) | 162 (38.2%) | 365 (51.0%) | 96 (45.1%) |
| R21 | 182 (12.4%) | 37 (8.7%) | 130 (18.1%) | 28 (13.1%) |
| F32 | 94 (6.4%) | 37 (8.7%) | 93 (13.0%) | 37 (17.4%) |
| K08 | 59 (4.0%) | 44 (10.4%) | 59 (8.2%) | 44 (20.1%) |
| U01 | 45 (3.1%) | 27 (6.4%) | 46 (6.4%) | 25 (11.7%) |
| R03 | 40 (2.7%) | 11 (2.6%) | 42 (5.9%) | 12 (5.6%) |
| P20 | 34 (2.3%) | 8 (1.9%) | 17 (2.4%) | 5 (2.3%) |
| P01 | 32 (2.2%) | 12 (2.8%) | 27 (3.8%) | 10 (4.7%) |
| Other | 284 (20%) | 86 (20%) | 277 (38.9%) | 84 (39.4%) |
Total number of neurosurgeon-scientists is less than the total number of grants awarded to neurosurgeon-scientists, as some neurosurgeon-scientists might have been awarded more than one type of grant. Sorted based on number of total neurosurgery grants.
Figure 4.

Several linear regressions were computed for total funding amount to neurosurgeon-scientists and various covariates including average citations per article, total citations, total number of papers, and h-index. Statistical significance was found for A) Average citations per article. B) Total number of citations. C) Total number of published papers. D) H-index.
Increasing Trends in Principal Investigator Age from Publication.
The year of first publication was recorded for each NIH-funded neurosurgeon as an estimate for length of career/age of surgeon. Over the study timeframe, we found that the average years since first publication have steadily increased with an approximate 0.41 increase in years since first publication per year (β = 0.41 years/year, P <0.0001, R2 = 0.12). The average number of years between first publication and reception of first NIH grant was roughly 16 years in 1993, and in 2017, this value increased to 24 years (which will be discussed later in this paper). While the overall trend in NIH funding rose on average per neurosurgeon-scientist (β = 0.01, P <0.001, and R2 = 0.43) (Figure 5A) per neurosurgery departments, this observed trend appeared to be towards more senior and less towards early career neurosurgeon-scientists (β = - 4.42, P = 0.05, and R2 = 0.77). (Figure 5B and SI 2A, 2B).[1] This dynamic shift is concerning given the numbers of neurosurgery trainees and the seven years duration of training. For example, according to the AANS, as of 2012, there were about 3,700 board-certified neurosurgeons in the United States.[1,28] In the same year, 178 (4.8%) neurosurgery residents graduated from neurological surgery residency programs and 49 (1.3%) neurosurgeon-scientists were awarded 62 NIH grants of which 19 (31%) grants were oncology-related.
Figure 5.

A) Graph of number of grants per funded neurosurgeon-scientists between 1993 and 2017. Trend line shown by dotted line. Linear regression reveals upward trends in the average grants per neurosurgeon-scientists. B) Graph of number of newly funded early career neurosurgeon-scientists between 1993 and 2017. Trend line shown by dotted line. Linear regression reveals downward trends in the number of newly funded early career neurosurgeon-scientists.
Gender Data on NIH Neurosurgeon Funding.
According to Association of American Medical Colleges (AAMC), the number of enrolled female medical students has been consistently rising from 46.9% in 2015 to 49.5% in 2018 to 50.5% in 2019.[29] However, only 5% of board-certified neurosurgeons are females.[30–33] Over the last 24 years, only 8.5% (n =18) of the NIH-funded neurosurgeons were female (P < 0.05) (Fig. S3A). The average number of NIH grants awarded to males was 2 per male and 1.65 NIH grants per female (P = 0.42) (Fig. S3B). When analyzing only oncology-related grants, there was still no statistical difference based on gender (1.90 grants for males vs 1.85 for females, P = 0.93) (Fig. S4A). When examining H-index between NIH-funded males and female neurosurgeons, we found NIH-funded male neurosurgeons had an average H-index of 39.4 compared to 28.5 for females (P = 0.08) (Fig. S3C). Average funding between males and females was not statistically significantly different ($2,791,520.04 for males compared to $2,135,879.13 for females, P = 0.63, Fig. S3D). This lack of significant disparity between genders held true when analyzing neurosurgical oncology grants ($2,701,602 for males compared to $1,900,135 for females, P = 0.44) (Fig. S4B).
NIH Funding Amounts by Doctoral Degrees (MD, MD-PhD, PhD).
According to AANS, only 9% of board-certified neurosurgeons hold combined MD-PhD degrees.[34] When comparing grant acquisition rate between MD-PhDs and MDs, 22% of PIs awarded grants were MD-PhD neurosurgeons, which was a significant difference (n = 45/213 (22%); OR = 2.4; P < 0.01) (Fig. S3A). However, there was a non-significant difference in average number of grants awarded per scientist (1.81 for MDs compared to 2.54 for MD-PhDs, P = 0.87) (Fig. S3D). When analyzing only oncology-related grants, there was still no statistical difference based on PI degree (1.85 grants for MDs vs 1.91 for MD/PhD, P = 0.90) (Fig. S4A). When examining H-index between NIH-funded MD only and MD-PhD neurosurgeons, we found a non-significant difference between MD-only neurosurgeons (average H-index of 38.1) compared to average H-index of 35.5 for MD-PhDs (P = 0.43) (Fig. S3C). Additionally, we found no significant difference in average funding amount per scientist ($2,700,300.00 for MDs compared to $2,898,959.57 for MD-PhDs (P = 0.83) (Fig. S3D). A similar result was seen when analyzing only the oncology-related neurosurgery grants ($3,012,330 for MDs compared to $1,535,513 for MD-PhDs, P = 0.25) (Fig. S4B).
Discussion
Physician/surgeon-scientists are critical to the biomedical workforce in terms of future discovery, translation, and application given their profound clinical knowledge and scientific skill set. The origins and importance of the physician-scientist date back more than 100 years ago to Abraham Flexner. The Flexner report called for radical changes, such that the physician should have rigorous scientific training.[35,36] Surgeon-scientists are pivotal to future health care translation, defined by the 21st Century Cures Act [37] by the U.S. House of Representatives to bring health care discoveries to patients. Additionally, the National Academies of Science, Engineering, and Medicine (NASEM) 2018 report [38] called for reform to strengthen a diverse biomedical workforce including physician-scientists. While this request is not the first to create alarm about the potential Vanishing Physician-Scientist, [39,40] as alluded to by Schafer, it is the first longitudinal data regarding neurosurgeon-scientists and federal funding, which served as the focus of our study.
We report several concerning trends for neurosurgeon-scientists. Firstly, from 1993–2017, the years between first publication and first NIH grant increased from 16 years to 23 years. Obtaining NIH funding is increasingly difficult to achieve given a relatively fixed NIH funding over time compared to inflation. Levitt reported a similar increasing trend for first independent research (FIR) awards in years for other NIH grants over time.[41] The current NIH budget is $39 billion, a fraction (1%) of the total U.S. health care expenditures of $3.2 trillion. U.S. health care expenditures are 16% of the GDP.[42] Fortunately, the public return on NIH investment is estimated to be at least 43%. [43]
We emphasize a second concern regarding the escalation in clinical pressures on neurosurgeon-scientists with a concurrent decline in young to mid-career neurosurgeon investigators.[1] These pressures include duty hour restrictions, different educational mandates, needs for advanced subspecialized training, and socioeconomic factors.[41,39,40] Our data show that most neurosurgeon-scientists are the minority (~30%) recipients of NIH funding (MD and MD-PhDs) compared to the remaining scientists funding (PhD) in neurosurgery departments. This diminished proportion of neurosurgeon-scientists likely reflects the increasing administrative burden and burnout experienced over 30 years, which the National Academy of Medicine addressed with a call to action.[44] Busy neurosurgeons may see NIH and similar scientific grants as low “effort versus return” compared to other forms of clinical research, such as retrospective chart review or existing databases, that lead to publication and academic promotion. These realities make it challenging to entice young neurosurgery trainees to pursue primary bench/translational work without a promise of potential NIH funding support to build their own laboratory. This obstacle is compounded by increasing financial pressures on health care organizations and neurosurgery departments to see an increasing amount of patients, potentially leading to more surgical interventions with less emphasis spent on cultivating research training. This decline paradoxically worsens the depth and breadth of the biomedical workforce. Further, there is little financial incentive for neurosurgery departments to formalize robust research training within residency based on competing educational ACGME/RRC training goals. It leads to lower numbers of adequately trained neurosurgeon researchers to compete for NIH R01 grants by graduation [45], a finding which contrasted with that of the studies by Jahangiri et al. and Lonser et al.[46–48] Conflictingly, the goal of the NIH Next Generation Researchers Initiative is to facilitate early career investigators getting NIH-funding compared to senior level investigators. This chasm is fueled by a stagnant supply (0.5% of all physicians [1]) and accumulating demand of neurosurgeons to address clinical needs in the United States. [49,50,1,23] Despite these trends, surgeon-scientists, such as the infamous Harvey Cushing, have a formidable track record of revolutionizing health care and producing ground-breaking scientific discoveries and new laboratory and operative techniques.[51,52]
A third significant trend in our data shows that since the National Cancer Act of 1971 and establishing the National Cancer Institute (NCI), NIH funding towards cancer research increased overall, with greater funding of oncological neurosurgery research than non-oncological neurosurgical research. Although the overall NIH funding to neurosurgery departments increased from 1993–2017 (with an adjusted total dollar amount for U.S. inflation base year 1993), the proportion going to neurosurgeon-scientists may be decreasing since 1993 (P = 0.09) (Figure 3A). Additionally, the percentage of funded neurosurgeon-scientists compared to scientists is decreasing (P = 0.002) (Figure 3B). To prevent further decline, we suggest a more robust integration of formal research training to foster more effective neurosurgeon-scientists in the future. There is also a progressive emphasis on neurosurgeon productivity via relative value units (RVU) compared to relatively flat Medicare reimbursement in practice over time, which may paradoxically reduce the number of young/mid-career NIH-funded neurosurgeon-scientists.[53,54] For example, among 70 neurosurgeon-scientists awarded NIH grants, 45 professors received the highest average funding per grant and highest average number of grants per neurosurgeon (P < 0.01) (Fig. S1B, Fig. S1C). This statistic is concerning for younger investigators with longer residency training. It is important to note a limitation in this assumption: professors often have a higher H-index which may influence NIH peer review and ratings (Fig. S1D). Bibliometric score data (H-index, number of publications, number of published papers, and citations per article) appear directly correlated to the chances of funding and the dollar amount (P < 0.01) (Figure 4). This finding is aligned with previous studies where H-index was found to be correlated with amount of NIH-funding, total number of grants, and duration of grants in calendar years.[55–57,16,58]
We acknowledge several limitations of our study, including the inability to assess racial/ethnic differences and biases in NIH RePORTER since it does not list them (only gender/sex). Another drawback was estimating the number of women applying for neurosurgery grants as the percentage of women in academic neurosurgery (5%). Although neurosurgery trainees markedly appear to be male predominant (95%) based on other data, we found female neurosurgery grant awardee rates were not statistically significant from male counterparts. Other limitations to this study include the possibility that NIH RePORTER database may be susceptible to error in reporting. We do not think this error is significant, yet acknowledge we are inherently limited by the tools provided by NIH RePORTER. Affiliations and titles are limited to what is listed and available in RePORTER. Further, ACGME Data Resource Books do not separate residents and fellows, therefore both were included in our analysis.
The cost of funding reported by the NIH includes both direct and indirect cost, which might skew results.[61] Indirect costs do not go to the PI and are often anecdotally considered by PIs as an institutional “tax.” Institutions have varying policies regarding salary “fallout” given the NIH PI salary cap, which might discourage neurosurgeons from particular institutions from applying for NIH grants. We also acknowledge that we used academic rank as a surrogate for seniority which may be flawed in years post-graduate status. While unusual, there are some young, early-mid career surgeon-scientists who achieve NIH R01 status and academic rank of Professor level, of which we cannot ascertain within NIH RePORTER dataset. To adjust these, we reported years post-graduate in publication to compensate for this, which showed an increasing lag after graduation over time. Further, we could not assess for biases such as the “Matthew effect” (prestige) of academic institutions[62,63], nor for first independent research (FIR) grant (e.g., R01) bias in this study, which is characterized as those without an R01 being negatively scored compared to those with prior R01[41] in peer review. We also did not assess the effects of “dropout” period after the first R01 [64] and before the second NIH grant.
The bibliometric score data (H-index, number of publications, number of published papers, and citations per article) were collected retrospectively at the time the search was conducted, not at the time when the grants were awarded. This discrepancy in timing might bias our results if the focus of the paper is the bibliometrics required for acquiring federal funding. Finally, we suspect there are numerous additional factors that affected these temporal trends; therefore, our findings should be interpreted with caution. We reported that there has been a steady increase in average years since first publications and acquiring an NIH grant. However, we need to acknowledge that in the present time, young investigators are exposed to research and publish very early in their career, which may not have been the case in the 1990s. These data and trends over time are important since they can help guide leaders and other stakeholders in education, such as ACGME and government (NIH, NCI), as well as other medical and surgical subspecialties, which may be facing similar critical issues regarding surgeon-scientist training.
Conclusion
From 1993–2017, a relatively low percentage of early-career neurosurgeon-scientists were awarded NIH grants, which when coupled with a relative lack of formalized scientific training in residency, could potentially decrease the quantity and/or quality of the future workforce of graduating neurosurgeon-scientists. This potential future decline may be ultimately detrimental to the advancement of the scientific community and humanity. Our results showed that despite the overall increasing trend in the number of NIH grants awarded to the neurosurgical departments, there is a notable decreasing trend in the ratio of the number of neurosurgeon-scientists awarded NIH grants in comparison to the number of scientists. Another important finding was that neurosurgeon-scientists were more likely to receive oncology-related grants than neurosurgical non-oncology-related grants. There exists a disproportion in the number of NIH grants awarded to “senior” level neurosurgeon-scientist per year, which appear to be towards more senior and less towards early career neurosurgeon-scientists. We propose that future leaders and stakeholders in research and scientific education (AAMC, ACGME, NASEM) encourage neurosurgery residency programs to integrate more robust and protected non-clinical time to foster formalized research during training for the future biomedical workforce. Additionally, we suggest that they potentially provide more funding pathways to dedicated surgeon-scientist tracks earlier in residency, given the increasing clinical demands in US health care.
Supplementary Material
Acknowledgments
Funding: AQH was supported by the Mayo Clinic Professorship and a Clinician Investigator award, and Florida State Department of Health Research Grant, and the Mayo Clinic Graduate School, as well as the NIH (R43CA221490, R01CA200399, R01CA195503, and R01CA216855). JFM receives support from the Earl & Nyda Swanson Neurosciences Research Fund and the Harley N. and Rebecca N. Hotchkiss Endowed Fund in Neuroscience Research, Honoring Ken and Marietta.
Abbreviations:
- NAS
National Academies of Science
- NIH
National Institutes of Health
- RePORTER
Research Portfolio Online Reporting Tools
- GDP
Global Domestic Product
- CMS
Centers for Medicare Services
- SNS
Society of Neurological Surgeons
- CAST
Committee for Accreditation of Subspecialty Training
- ACGME
Accreditation Council for Graduate Medical Education
- RRC
Residency Review Committee
- AAMC
Association of American Medical Colleges
- NASEM
National Academies of Sciences, Engineering, and Medicine
Footnotes
Publisher's Disclaimer: This AM is a PDF file of the manuscript accepted for publication after peer review, when applicable, but does not reflect post-acceptance improvements, or any corrections. Use of this AM is subject to the publisher’s embargo period and AM terms of use.
Conflict of Interest /Competing interests: The authors have no conflict of interest. The abstract was presented as an Oral Presentation during the 2019 Congress of Neurological Surgeons Annual Meeting, October 19–23, in San Francisco, CA.
Data Availability: The data that support the findings of this study are openly available in NIH RePorter (Research Portfolio Online Reporting Tools) at https://projectreporter.nih.gov/reporter.cfm
Ethics approval: Ethics approval was not applicable for this study as only publicly accessible data was utilized.
Consent to participate: Not applicable.
References
- 1.Statement of the American Association of Neurological Surgeons ABoNS, Congress of Neurological Surgeons, Society of Neurological Surgeons before the Institute of Medicine (2012) Ensuring an Adequate Neurosurgical Workforce for the 21st Century https://www.aans.org/pdf/Legislative/Neurosurgery%20IOM%20GME%20Paper%2012%2019%2012.pdf.
- 2.Tracker P-KHS (2018) How has U.S. spending on healthcare changed over time? https://www.healthsystemtracker.org/chart-collection/u-s-spending-healthcare-changed-time/#item-health-spending-generally-grows-faster-than-general-economic-inflation_2017. Accessed November 11 2019
- 3.Biology FoASfE NIH Research Funding Trends http://www.faseb.org/Science-Policy--Advocacy-and-Communications/Federal-Funding-Data/NIH-Research-Funding-Trends.aspx. Accessed April 2, 2019
- 4.WolframAlpha us inflation annual rate 1970 to 2019 https://www.wolframalpha.com/input/?i=us+inflation+annual+rate+1970+to+2019. April 2, 2019
- 5.(FASEB) FoASfEB (2019) NIH Research Funding Trends http://www.faseb.org/Science-Policy--Advocacy-and-Communications/Federal-Funding-Data/NIH-Research-Funding-Trends.aspx. Accessed April 2 2019
- 6.Surgeons TSoN (2013–2015) Subspecialty Training & Fellowships (CAST) http://www.societyns.org/fellowships/HistoryTest.asp. 2019
- 7.Jagannathan J, Vates GE, Pouratian N, Sheehan JP, Patrie J, Grady MS, Jane JA (2009) Impact of the Accreditation Council for Graduate Medical Education work-hour regulations on neurosurgical resident education and productivity. J Neurosurg 110 (5):820–827. doi: 10.3171/2009.2.JNS081446 [DOI] [PubMed] [Google Scholar]
- 8.Bina RW, Lemole GM, Dumont TM (2016) On resident duty hour restrictions and neurosurgical training: review of the literature. J Neurosurg 124 (3):842–848. doi: 10.3171/2015.3.JNS142796 [DOI] [PubMed] [Google Scholar]
- 9.Fargen KM, Dow J, Tomei KL, Friedman WA (2014) Follow-up on a national survey: american neurosurgery resident opinions on the 2011 accreditation council for graduate medical education-implemented duty hours. World Neurosurg 81 (1):15–21. doi: 10.1016/j.wneu.2013.08.015 [DOI] [PubMed] [Google Scholar]
- 10.Babu MA, Metcalf-Doetsch W (2016) The Burden of Debt: Impacting GME Accessed July 9th 2019 [Google Scholar]
- 11.Gottfried ON, Rovit RL, Popp AJ, Kraus KL, Simon AS, Couldwell WT (2005) Neurosurgical workforce trends in the United States. J Neurosurg 102 (2):202–208. doi: 10.3171/jns.2005.102.2.0202 [DOI] [PubMed] [Google Scholar]
- 12.Allard SW, Smith SR (2014) Unforeseen consequences: Medicaid and the funding of nonprofit service organizations. J Health Polit Policy Law 39 (6):1135–1172. doi: 10.1215/03616878-2822610 [DOI] [PubMed] [Google Scholar]
- 13.Education ACfGM (2019) Neurological Surgery, Program Requirements and FAQs https://www.acgme.org/Specialties/Program-Requirements-and-FAQs-and-Applications/pfcatid/10/Neurological%20Surgery. Accessed July 3 2019
- 14.Karsy M, Henderson F, Tenny S, Guan J, Amps JW, Friedman AH, Spiotta AM, Patel S, Kestle JRW, Jensen RL, Couldwell WT (2018) Attitudes and opinions of US neurosurgical residents toward research and scholarship: a national survey. J Neurosurg:1–12. doi: 10.3171/2018.3.JNS172846 [DOI] [PubMed] [Google Scholar]
- 15.Bernardo A (2017) Establishment of Next-Generation Neurosurgery Research and Training Laboratory with Integrated Human Performance Monitoring. World Neurosurg 106:991–1000. doi: 10.1016/j.wneu.2017.06.160 [DOI] [PubMed] [Google Scholar]
- 16.Khan NR, Thompson CJ, Taylor DR, Venable GT, Wham RM, Michael LM 2nd, Klimo P Jr. (2014) An analysis of publication productivity for 1225 academic neurosurgeons and 99 departments in the United States. J Neurosurg 120 (3):746–755. doi: 10.3171/2013.11.JNS131708 [DOI] [PubMed] [Google Scholar]
- 17.Khan NR, Saad H, Oravec CS, Norrdahl SP, Fraser B, Wallace D, Lillard JC, Motiwala M, Nguyen VN, Lee SL, Jones AV, Ajmera S, Kalakoti P, Dave P, Moore KA, Akinduro O, Nyenwe E, Vaughn B, Michael LM, Klimo P (2019) An Analysis of Publication Productivity During Residency for 1506 Neurosurgical Residents and 117 Residency Departments in North America. Neurosurgery 84 (4):857–867. doi: 10.1093/neuros/nyy217 [DOI] [PubMed] [Google Scholar]
- 18.Choi BD, DeLong MR, DeLong DM, Friedman AH, Sampson JH (2014) Impact of PhD training on scholarship in a neurosurgical career. J Neurosurg 120 (3):730–735. doi: 10.3171/2013.11.JNS122370 [DOI] [PubMed] [Google Scholar]
- 19.Crowley RW, Asthagiri AR, Starke RM, Zusman EE, Chiocca EA, Lonser RR, Surgeons RCotCoN (2012) In-training factors predictive of choosing and sustaining a productive academic career path in neurological surgery. Neurosurgery 70 (4):1024–1032. doi: 10.1227/NEU.0b013e3182367143 [DOI] [PubMed] [Google Scholar]
- 20.Lawton MT, Narvid J, Quinones-Hinojosa A (2007) Predictors of neurosurgical career choice among residents and residency applicants. Neurosurgery 60 (5):934–939; discussion 934–939. doi: 10.1227/01.NEU.0000255445.51989.33 [DOI] [PubMed] [Google Scholar]
- 21.McClelland S (2010) Pre-residency peer-reviewed publications are associated with neurosurgery resident choice of academic compared to private practice careers. J Clin Neurosci 17 (3):287–289. doi: 10.1016/j.jocn.2009.07.098 [DOI] [PubMed] [Google Scholar]
- 22.Daniels M, Garzon-Muvdi T, Maxwell R, Tamargo RJ, Huang J, Witham T, Bettegowda C, Chaichana KL (2017) Preresidency Publication Number Does Not Predict Academic Career Placement in Neurosurgery. World Neurosurg 101:350–356. doi: 10.1016/j.wneu.2017.02.028 [DOI] [PubMed] [Google Scholar]
- 23.Vates GE, Kim DH, Day AL (2004) The neurosurgeon as clinician-scientist: the fundamentals. Clin Neurosurg 51:53–58 [PubMed] [Google Scholar]
- 24.Health NIo (2019) NIH RePORTER https://projectreporter.nih.gov/reporter.cfm. 2018
- 25.Hendrix D (2008) An analysis of bibliometric indicators, National Institutes of Health funding, and faculty size at Association of American Medical Colleges medical schools, 1997–2007. J Med Libr Assoc 96 (4):324–334. doi: 10.3163/1536-5050.96.4.007 [DOI] [PMC free article] [PubMed] [Google Scholar]
- 26.Thomaz PG, Assad RS, Moreira LF (2011) Using the impact factor and H index to assess researchers and publications. Arq Bras Cardiol 96 (2):90–93. doi:10.1590/s0066–782×2011000200001 [DOI] [PubMed] [Google Scholar]
- 27.Hirsch JE (2005) An index to quantify an individual’s scientific research output. Proc Natl Acad Sci U S A 102 (46):16569–16572. doi: 10.1073/pnas.0507655102 [DOI] [PMC free article] [PubMed] [Google Scholar]
- 28.Kenning TJ (2016) Neurosurgical Workforce Shortage: The Effect of Subspecialization and a Case for Shortening Residency Training. Departments | Resident’s Forum 25 [Google Scholar]
- 29.Colleges) AAoAM (2019) The Majority of U.S. Medical Students Are Women, New Data Show https://www.aamc.org/news-insights/press-releases/majority-us-medical-students-are-women-new-data-show. Accessed February 15 2020
- 30.Spetzler RF (2011) Progress of women in neurosurgery. Asian J Neurosurg 6 (1):6–12. doi: 10.4103/1793-5482.85627 [DOI] [PMC free article] [PubMed] [Google Scholar]
- 31.Colleges AAoM The State of Women in Academic Medicine: The Pipeline and Pathways to Leadership, 2015–2016. https://www.aamc.org/members/gwims/statistics/. Accessed July 3 2019
- 32.Committee WWP, Benzil DL, Abosch A, Germano I, Gilmer H, Maraire JN, Muraszko K, Pannullo S, Rosseau G, Schwartz L, Todor R, Ullman J, Zusman E (2008) The future of neurosurgery: a white paper on the recruitment and retention of women in neurosurgery. J Neurosurg 109 (3):378–386. doi: 10.3171/JNS/2008/109/9/0378 [DOI] [PubMed] [Google Scholar]
- 33.Abosch A, Rutka JT (2018) Women in neurosurgery: inequality redux. J Neurosurg 129 (2):277–281. doi: 10.3171/2018.4.JNS172878 [DOI] [PubMed] [Google Scholar]
- 34.Surgeons AAoN (2019) Find a Board-certified Neurosurgeon. American Association of Neurological Surgeons https://www.aans.org/Patients/Find-a-Neurosurgeon. Accessed November 2019
- 35.Barzansky B (2010) Abraham Flexner and the era of medical education reform. Acad Med 85 (9 Suppl):S19–25. doi: 10.1097/ACM.0b013e3181f12bd1 [DOI] [PubMed] [Google Scholar]
- 36.Duffy TP (2011) The Flexner Report−-100 years later. Yale J Biol Med 84 (3):269–276 [PMC free article] [PubMed] [Google Scholar]
- 37.Brindley DA, Arshad Z, Luo D, Dopson S, Hollander G, Frost S, Bountra C, Smith JA (2015) 21(st) Century Cures Act: An Act of Cure or Diagnosis? Rejuvenation Res 18 (4):295–298. doi: 10.1089/rej.2015.1757 [DOI] [PMC free article] [PubMed] [Google Scholar]
- 38.The National Academies of Sciences E, and Medicine (2018) Report Recommends Reforms to Support Careers of Young Biomedical and Behavioral Scientists, Proposes Solutions to Barriers That Have Slowed Change So Far http://www8.nationalacademies.org/onpinews/newsitem.aspx?RecordID=25008
- 39.Brown NJ (2013) Developing physician-scientists: a perspective. Trans Am Clin Climatol Assoc 124:218–229 [PMC free article] [PubMed] [Google Scholar]
- 40.Schafer AI (2010) The vanishing physician-scientist? Transl Res 155 (1):1–2. doi: 10.1016/j.trsl.2009.09.006 [DOI] [PMC free article] [PubMed] [Google Scholar]
- 41.Levitt M, Levitt JM (2017) Future of fundamental discovery in US biomedical research. Proc Natl Acad Sci U S A 114 (25):6498–6503. doi: 10.1073/pnas.1609996114 [DOI] [PMC free article] [PubMed] [Google Scholar]
- 42.Health NIo (2019) What We Do https://www.nih.gov/about-nih/what-we-do/budget. Accessed November 23 2019
- 43.Health NIo (2019) What We Do https://www.nih.gov/about-nih/what-we-do/impact-nih-research/our-society. Accessed November 23 2019
- 44.Medicine NAo (2019) Clinician well-being is essential for safe, high-quality patient care https://nam.edu/initiatives/clinician-resilience-and-well-being/. Accessed November 23 2019
- 45.(NIH) NIoH (2017) Policy Supporting the Next Generation Researchers Initiative https://grants.nih.gov/grants/guide/notice-files/NOT-OD-17-101.html. Accessed April 2,2019 2019
- 46.Jahangiri A, Flanigan PM, Arnush M, Chandra A, Rick JW, Choi S, Chou A, Berger MS, Aghi MK (2019) From bench to bedside: trends in National Institutes of Health funding for neurosurgeons from 1991 to 2015. J Neurosurg:1–10. doi: 10.3171/2019.1.JNS181531 [DOI] [PubMed] [Google Scholar]
- 47.Lonser RR, Smith LGF, Tennekoon M, Rezai-Zadeh KP, Ojemann JG, Korn SJ (2020) Creation of a comprehensive training and career development approach to increase the number of neurosurgeons supported by National Institutes of Health funding. J Neurosurg:1–9. doi: 10.3171/2020.5.JNS201008 [DOI] [PMC free article] [PubMed] [Google Scholar]
- 48.Lonser RR, Zipfel GJ, Chiocca EA (2020) National Institute of Neurological Disorders and Stroke: current funding status, opportunities, challenges, emerging scientific advances, and recommendations for neurosurgery. J Neurosurg:1–6. doi: 10.3171/2020.4.JNS201202 [DOI] [PubMed] [Google Scholar]
- 49.Barrow DL (2013) Subspecialization in neurosurgery. World Neurosurg 80 (5):e105–106. doi: 10.1016/j.wneu.2013.01.072 [DOI] [PubMed] [Google Scholar]
- 50.Zuidema GD (1977) The SOSSUS report and its impact on neurosurgery. J Neurosurg 46 (2):135–144. doi: 10.3171/jns.1977.46.2.0135 [DOI] [PubMed] [Google Scholar]
- 51.Rossitch E Jr., Moore MR, el-Azouzi M, Black PM (1990) [Harvey Cushing: neurosurgeon and artist]. Neurochirurgie 36 (3):141–143 [PubMed] [Google Scholar]
- 52.Cushing H (2005) The special field of neurological surgery. Bulletin of the Johns Hopkins Hospital 16:77–87, 1905. Neurosurgery 57 (6):1075 [DOI] [PubMed] [Google Scholar]
- 53.Weitz HH (2019) Sir William Osler: Would He Have Made His Relative Value Units (RVUs)? Ann Intern Med doi: 10.7326/M19-0665 [DOI] [PubMed] [Google Scholar]
- 54.Carmel PW (2012) AMA: Moving past a failed Medicare formula to focus on quality care [Google Scholar]
- 55.Svider PF, Husain Q, Folbe AJ, Couldwell WT, Liu JK, Eloy JA (2014) Assessing National Institutes of Health funding and scholarly impact in neurological surgery. J Neurosurg 120 (1):191–196. doi: 10.3171/2013.8.JNS13938 [DOI] [PubMed] [Google Scholar]
- 56.Venable GT, Khan NR, Taylor DR, Thompson CJ, Michael LM, Klimo P Jr. (2014) A correlation between National Institutes of Health funding and bibliometrics in neurosurgery. World Neurosurg 81 (3–4):468–472. doi: 10.1016/j.wneu.2013.11.013 [DOI] [PubMed] [Google Scholar]
- 57.Ponce FA, Lozano AM (2010) Academic impact and rankings of American and Canadian neurosurgical departments as assessed using the h index. J Neurosurg 113 (3):447–457. doi: 10.3171/2010.3.JNS1032 [DOI] [PubMed] [Google Scholar]
- 58.Flanigan PM, Jahangiri A, Golubovsky JL, Karnuta JM, May FJ, Berger MS, Aghi MK (2018) A cross-sectional study of neurosurgical department chairs in the United States. J Neurosurg 129 (5):1342–1348. doi: 10.3171/2017.7.JNS17567 [DOI] [PubMed] [Google Scholar]
- 59.Bean J (2008) Women in neurosurgery. J Neurosurg 109 (3):377. doi: 10.3171/JNS/2008/109/9/0377 [DOI] [PubMed] [Google Scholar]
- 60.Benzil DL, Abosch A, Germano I, Gilmer H, Maraire JN, Muraszko K, Pannullo S, Rosseau G, Schwartz L, Todor R, Ullman J, Zusman E, Committee: WWP (2008) The future of neurosurgery: a white paper on the recruitment and retention of women in neurosurgery. J Neurosurg 109 (3):378–386. doi: 10.3171/JNS/2008/109/9/0378 [DOI] [PubMed] [Google Scholar]
- 61.Health NIo (2018) Funding https://report.nih.gov/fundingfacts/fundingfacts.aspx. Accessed July 3 2019
- 62.Wahls WP (2019) Opinion: The National Institutes of Health needs to better balance funding distributions among US institutions. Proc Natl Acad Sci U S A 116 (27):13150–13154. doi: 10.1073/pnas.1909217116 [DOI] [PMC free article] [PubMed] [Google Scholar]
- 63.Wahls WP (2018) The NIH must reduce disparities in funding to maximize its return on investments from taxpayers. Elife 7. doi: 10.7554/eLife.34965 [DOI] [PMC free article] [PubMed] [Google Scholar]
- 64.Haggerty PA, Fenton MJ (2018) Outcomes of early NIH-funded investigators: Experience of the National Institute of Allergy and Infectious Diseases. PLoS One 13 (9):e0199648. doi: 10.1371/journal.pone.0199648 [DOI] [PMC free article] [PubMed] [Google Scholar]
Associated Data
This section collects any data citations, data availability statements, or supplementary materials included in this article.