Abstract
Polarized morphogenesis is achieved by targeting or inhibiting growth in distinct regions. Rod-shaped fission yeast cells grow exclusively at their ends by restricting exocytosis and secretion to these sites. This growth pattern implies the existence of mechanisms that prevent exocytosis and growth along nongrowing cell sides. We previously identified a set of 50–100 megadalton-sized node structures along the sides of fission yeast cells that contained the interacting proteins Skb1 and Slf1. Here, we show that Skb1–Slf1 nodes contain the syntaxin-like soluble N-ethylmaleimide-sensitive factor attachment protein receptor Psy1, which mediates exocytosis in fission yeast. Psy1 localizes in a diffuse pattern at cell tips, where it likely promotes exocytosis and growth, but is sequestered in Skb1–Slf1 nodes at cell sides where growth does not occur. Mutations that prevent node assembly or inhibit Psy1 localization to nodes lead to aberrant exocytosis at cell sides and increased cell width. Genetic results indicate that this Psy1 node mechanism acts in parallel to actin cables and Cdc42 regulation. Our work suggests that sequestration of syntaxin-like Psy1 at nongrowing regions of the cell cortex reinforces cell morphology by restricting exocytosis to proper sites of polarized growth.
INTRODUCTION
Cell polarization is critical for the function of nearly every cell type and underlies essential processes such as cell growth and division. Regardless of how elaborate or simple a cell shape is, polarized morphogenesis is achieved by targeting growth to specific regions. At the same time, polarized morphogenesis requires separate mechanisms that inhibit growth at other regions, thereby restricting growth to defined sites of polarity (Goehring and Grill, 2013). Fission yeast cells exhibit a highly polarized pattern of growth, making them an ideal model to study morphology and polarity. These rod-shaped cells maintain a constant cell width and grow exclusively from their tips by restricting exocytosis and secretion to these sites during interphase. During division, fission yeast cells redirect polarized exocytosis and secretion to the cell middle for septation and cell separation (Mitchison and Nurse, 1985; Das et al., 2007; Kelly and Nurse, 2011).
The growth machinery at cell tips has been widely studied (reviewed by Martin and Arkowitz, 2014; Chiou et al., 2017). Landmark proteins such as Tea1 and Tea4 are deposited at cell ends by microtubules (Mata and Nurse, 1997; Feierbach et al., 2004; Martin et al., 2005; Tatebe et al., 2005). Landmark proteins recruit polarity factors including the formin For3 and its regulators, which assemble actin cables oriented toward cell tips (Feierbach and Chang, 2001; Martin et al., 2005, 2007; Martin and Chang, 2006). Actin cables act as tracks for myosin-based delivery of secretory vesicles, leading to targeted exocytosis of cell wall proteins and modifying enzymes at cell tips (Pruyne et al., 2004). At cell tips, a multiprotein complex called the exocyst tethers secretory vesicles for subsequent membrane fusion and content release mediated by SNAREs (soluble N-ethylmaleimide-sensitive factor attachment protein receptors) (TerBush et al., 1996; Südhof and Rothman, 2009; Polgar and Fogelgren, 2018; Ganesan et al., 2020). SNARE proteins mediate membrane fusion in yeast and human cells, thus providing specificity by ensuring that only correctly targeted vesicles fuse (Protopopov et al., 1993; Söllner et al., 1993; Rothman, 1994; Pelham, 1999). Actin cables and the exocyst act in parallel to promote growth specifically at the tips of fission yeast (Bendezú and Martin, 2011; Snaith et al., 2011).
Mechanisms that promote growth at cell tips need to be reinforced by separate mechanisms that inhibit growth at cell sides. Previous studies identified Rga4 and Rga6, which are inhibitory GAPs (GTPase activating proteins) for the Rho GTPase Cdc42, along cell sides (Das et al., 2007; Tatebe et al., 2008; Kelly and Nurse, 2011; Revilla-Guarinos et al., 2016). These GAPs help to restrict Cdc42 activation and polarized growth to cell tips, but it has been unclear if other mechanisms exist to prevent exocytosis along cell sides. Here, we show that the fission yeast syntaxin-like SNARE protein Psy1 has different localization patterns at cell tips and along cell sides. Psy1 forms a diffuse band at growing cell tips but localizes as cortical puncta along the nongrowing cell sides. These puncta are the previously identified megadalton-sized node structures formed by the interacting proteins Skb1 and Slf1. We show that nodes sequester Psy1 at nongrowing cortical sites to restrict exocytosis to proper sites of polarized growth.
RESULTS
Psy1 forms growth-positioned nodes
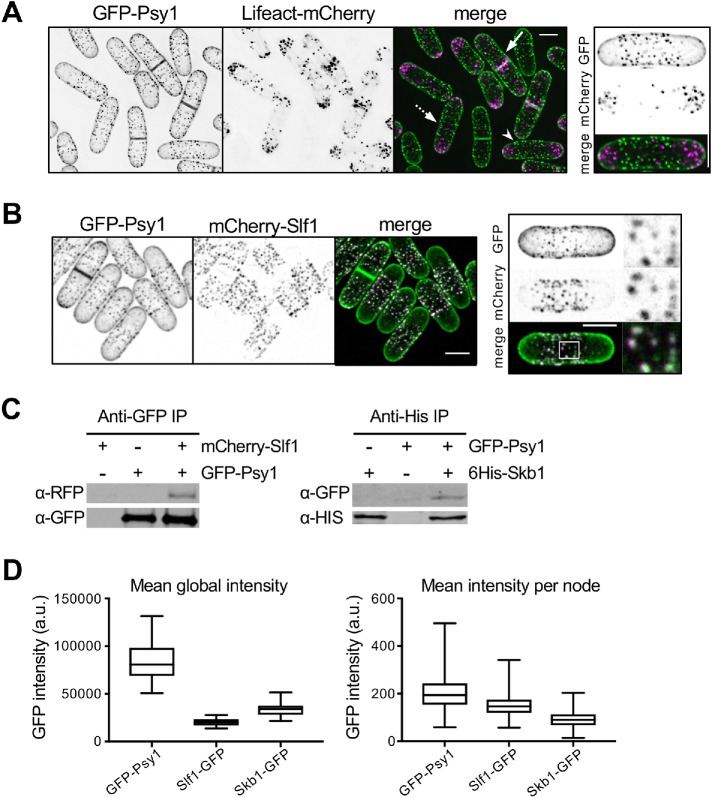
We noticed the presence of punctate structures in some images of Psy1 localization from previous studies (Wang et al., 2016; Zhu et al., 2018). Though typically considered a diffuse marker for the plasma membrane (PM), these images raised the possibility of a more intricate localization pattern. Therefore, we imaged GFP-Psy1 and collected series of z-sections to capture the full cell volume. At growing cell tips, Psy1 localized as diffuse bands at the PM. In contrast, along the nongrowing cell middle, Psy1 localized to discrete puncta on the PM (Figure 1A, left GFP-Psy1 panel). We observed these same Psy1 puncta using epifluorescence, laser-scanning confocal, and spinning-disk confocal microscopy, so they do not represent an artifact of any particular imaging system. The distribution of Psy1 puncta suggested a link to cellular growth patterns. Psy1 puncta were excluded from sites of cell growth marked by the actin probe Lifeact-mCherry (Figure 1A). More specifically, Psy1 puncta were excluded from one end of small monopolar cells during interphase. In bipolar cells, Psy1 puncta were present at the cell middle and did not overlap with cortical actin patches at either growing end. In dividing cells, when actin and growth are redirected to the cell middle, Psy1 puncta are absent from the division septum. We conclude that Psy1 localizes in puncta at nongrowing regions of the cell cortex.
FIGURE 1:
Psy1 localizes to Skb1–Slf1 nodes at nongrowing regions of the PM. (A) GFP-Psy1 nodes do not overlap with actin marker Lifeact-mCherry. Images are from deconvolved z-series. Dashed arrow marks monopolar cell; arrowhead marks bipolar cell; arrow marks dividing cell. Representative image of bipolar cell is shown (Right). (B) Colocalization of GFP-Psy1 and mCherry-Slf1. Representative images with boxed region of close-up of mCherry and GFP node signals (Right) are shown. (C) Left, coimmunoprecipitation of mCherry-Slf1 and GFP-Psy1 from fission yeast cells. Right, coimmunoprecipitation of 6His-Skb1 and GFP-Psy1. (D) Global and local quantification (A.U.) of GFP-tagged Psy1, Skb1, and Slf1 proteins. Graph shows median as a line, quartiles, max, and min.
Psy1 is a component of Skb1–Slf1 nodes
Psy1 puncta bear striking resemblance to a set of cortical node structures that we identified in previous studies (Deng and Moseley, 2013; Deng et al., 2014). These megadalton-sized nodes contain two interacting proteins called Skb1 and Slf1. We examined colocalization of Psy1 with these node proteins to test the possibility that Psy1 might be a component of Skb1–Slf1 nodes. In cells expressing mCherry-Slf1 and GFP-Psy1, we found that Psy1 and Slf1 colocalize in the same cortical nodes (Figure 1B). In addition to colocalization, Psy1 coimmunoprecipitated with both Skb1 and Slf1 (Figure 1C). Thus, Psy1 localizes to Skb1–Slf1 nodes and physically associates with these proteins. These results indicate that cortical nodes are multiprotein structures containing Skb1, Slf1, and Psy1.
We sought quantitative insight into the relationship between Skb1, Slf1, and Psy1 at nodes. By quantitative fluorescence microscopy, Skb1 and Slf1 are roughly stoichiometric at nodes, with each node containing on average 69 Skb1 molecules and 77 Slf1 molecules (Deng et al., 2014). The global concentration of GFP-Psy1 in cells was higher than that of either Skb1 or Slf1. At nodes, we measured slightly higher average signal for GFP-Psy1 than for Slf1 or Skb1 (Figure 1D). Based on these data, we estimate that each node contains ∼100 molecules of Psy1, although this number is likely to fluctuate between different nodes.
We tested if Psy1 localization to nodes requires Skb1 and/or Slf1. GFP-Psy1 localization to nodes was lost in either skb1∆ or slf1∆ mutant cells (Figure 2A). In both mutants, GFP-Psy1 localized in a diffuse pattern along the PM. This result is consistent with the interdependence of Skb1 and Slf1 for node formation (Deng et al., 2014). The absence of nodes led to an increased and largely constant concentration of diffuse Psy1 along cell sides, as well as increased levels of Psy1 at cell tips (Figure 2, B and C). We conclude that Skb1 and Slf1 associate to form cortical nodes, which then recruit Psy1 to these structures through physical interactions. The presence of nodes reduces the concentration of diffuse Psy1 along cell sides.
FIGURE 2:
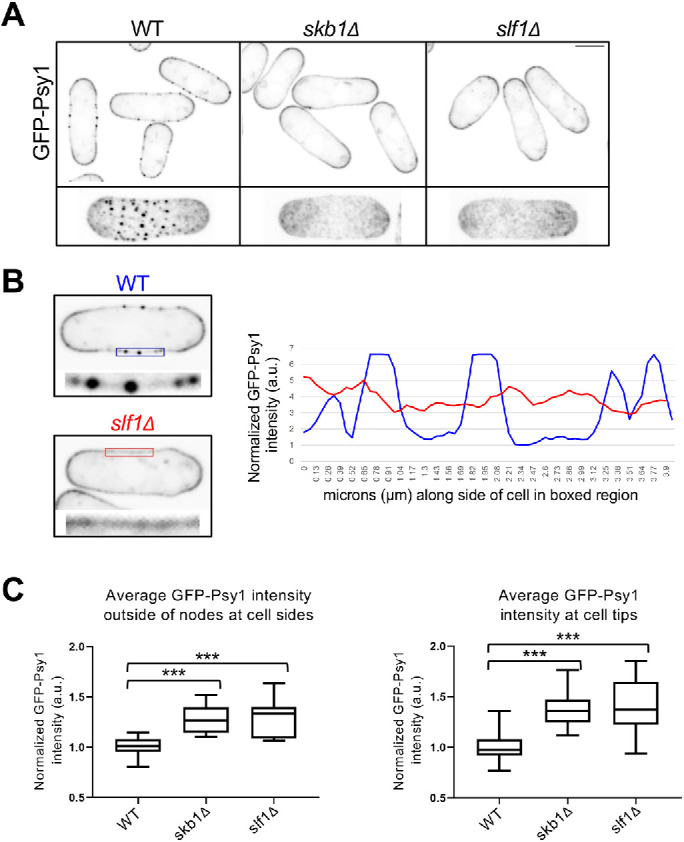
Skb1 and Slf1 are required for Psy1 localization to nodes. (A) (Top) Single middle z-slice images are shown. (Bottom) Maximum-intensity projections of z-series are shown for a representative cell. Note the absence of Psy1 nodes in skb1∆ and slf1∆ cells. Scale bars 4 µm. (B) Line scan of GFP-Psy1 intensity along the cell side of WT and slf1∆ cell (Right). Single middle z-slice images are shown with boxed region where line was drawn (Left). (C) Quantification of GFP-Psy1 intensity (A.U.) outside of nodes at cell sides (Left) and at cell tips (Right). n ≥ 30 cells per strain. Graph shows median as a line, quartiles, max, and min.
Psy1 protein is trapped in nodes
Next, we examined the dynamics of Psy1 at nodes. We performed fluorescence recovery after photobleaching (FRAP) of nodes along the cell side of wild-type (WT) cells. A bleached GFP-Psy1 region containing nodes did not recover fluorescence after 18 min (Figure 3A, left panel), similarly to FRAP results from bleaching Psy1 along cell sides in previous studies (Bendezú et al., 2015; Wang et al., 2016; Tay et al., 2019). This result indicates that Psy1 protein is trapped in a node and does not exchange freely with Psy1 outside the node. In contrast, diffuse Psy1 along the cell side of skb1∆ and slf1∆ mutant cells was dynamic, similarly to Psy1 at growing cell tips (Figure 3, A and B). These findings were supported by time-lapse imaging of Psy1. In WT cells, we observed dynamic changes in Psy1 distribution at cell tips, but Psy1 at nodes did not move or disassemble rapidly over time (Figure 3C), similarly to Skb1 and Slf1 (Deng and Moseley, 2013; Deng et al., 2014). However, Psy1 exhibited dynamic changes in its localization to cell tips and cell sides of skb1∆ and slf1∆ mutant cells.
FIGURE 3:
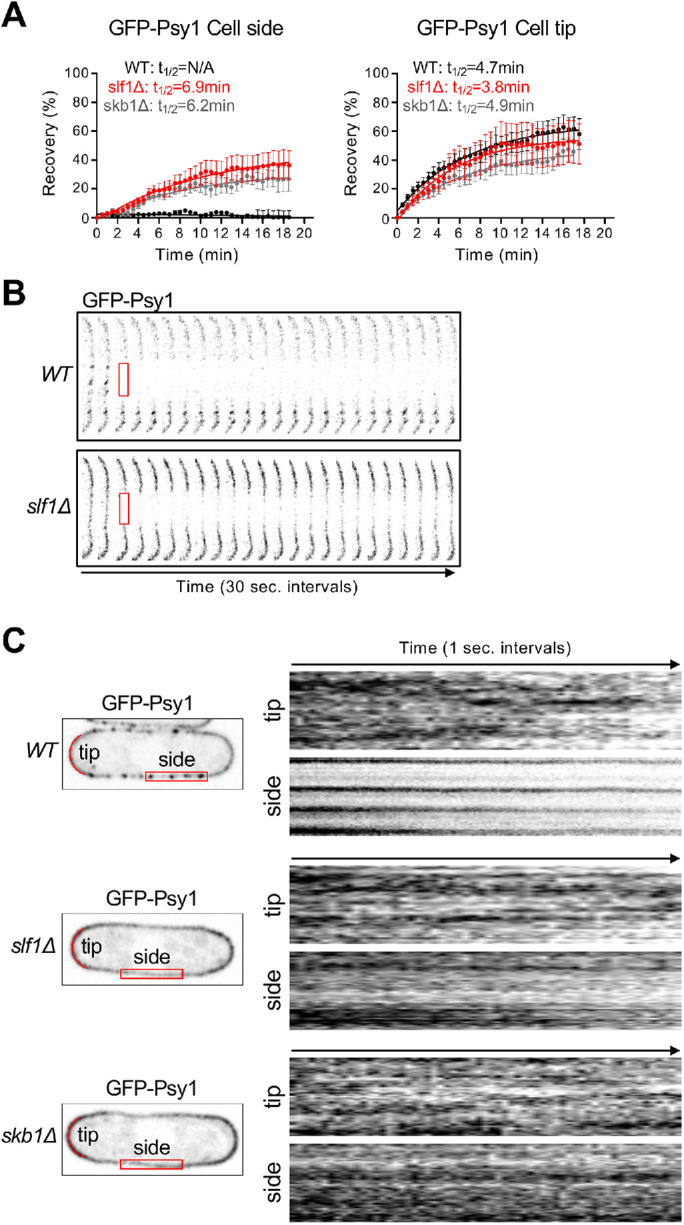
Psy1 nodes are stable structures. (A) FRAP curves of GFP-Psy1 recovery at the cell side (left) or at cell tips (right). n ≥ 10 cells per strain. (B) Representative WT and slf1∆ cell sides before and after photobleaching. The red boxed region was bleached. (C) Time-lapse imaging of GFP-Psy1. Kymographs (Right) show distribution of GFP-Psy1 in red boxed region at the cell side, or along red lines at cell tips over a 70-s time period.
As an additional test of Skb1–Slf1–Psy1 node stability, we treated cells with 1,6-hexanediol, which disrupts weak hydrophobic interactions (Ribbeck and Görlich, 2002; Patel et al., 2007). This chemical disrupts P-body granules in fission yeast cells (Kroschwald et al., 2015), which we confirmed in control experiments (Supplemental Figure S1A). Treatment of cells expressing mCherry-Slf1 and GFP-Psy1 with 10% 1,6-hexanediol or DMSO control did not have a dramatic effect on Skb1–Slf1–Psy1 node stability (Supplemental Figure S1B). This result indicates that Skb1–Slf1–Psy1 nodes are held together by interactive forces distinct from condensates such as P-bodies. Overall, our experiments reveal that nodes are static structures that trap Psy1 protein at cell sides.
Genetic interactions implicate Skb1–Slf1 nodes in exocytosis
What is the function of Psy1 localization at cortical nodes? Psy1 is predicted to be necessary for exocytosis and growth at cell tips, where it localizes independent of node proteins. Psy1 stably associates with Skb1–Slf1 nodes at nongrowing regions along cell sides. We hypothesized that nodes might sequester Psy1 to inhibit exocytosis and growth along the cell middle. As a first test, we examined genetic interactions between node mutants and exocytosis mutants. In both skb1∆ and slf1∆ mutants, Psy1 is not trapped at nodes and instead localizes diffusively throughout the PM including along cell sides (Figures 2, 3). We combined skb1∆ or slf1∆ with several mutations affecting exocyst function: the temperature-sensitive (ts) exocyst subunit mutants sec8-1 and sec3-2, deletion of nonessential exocyst subunit Exo70, and deletion of the nonessential exocyst activator Rho3 (Wang et al., 2002, 2003; Bendezú et al., 2012). Additionally, we combined skb1∆ or slf1∆ with for3∆, which abolishes actin cables that direct polarized transport of exocytic secretory vesicles (Feierbach and Chang, 2001; Nakano et al., 2002). We discovered synthetic growth defects in skb1∆exo70∆ and skb1∆for3∆ mutants, while skb1∆ suppressed the growth defects of sec8-1, sec3-2, and to a minor extent rho3∆ mutants (Supplemental Figure S2). Most double mutants with slf1∆ showed similar but less pronounced phenotypes, likely reflecting overlapping but nonidentical functions for Skb1 and Slf1.
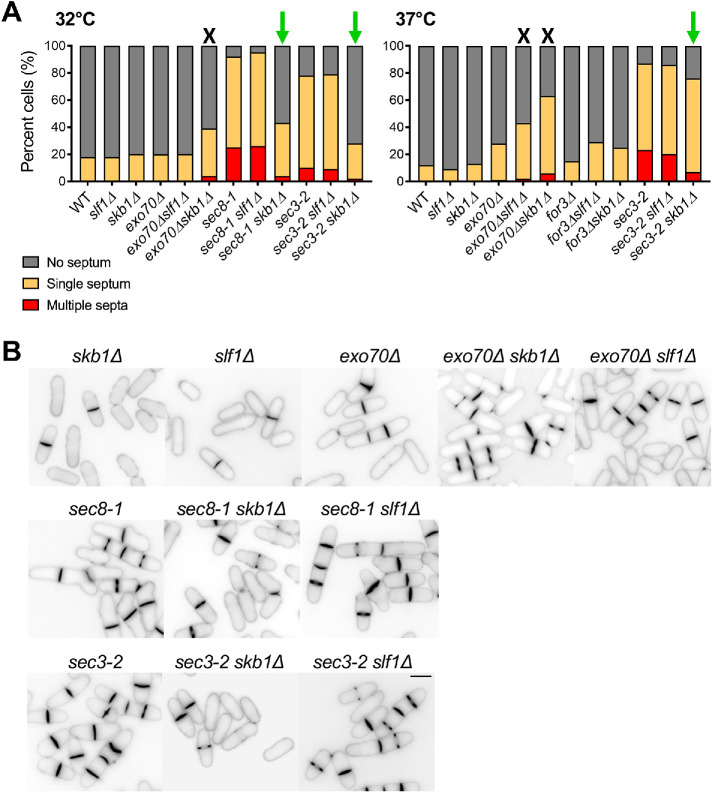
Mutations that affect exocytosis cause cell separation defects because exocytosis contributes to formation and remodeling of the division septum (Wang et al., 2002; Bendezú et al., 2012; Jourdain et al., 2012; Wang et al., 2016). Thus, we assayed the septation index in these double mutants and found increased septation index for skb1∆exo70∆ double mutants compared with single mutants alone (Figure 4, A and B). In contrast, we observed decreased septation index for skb1∆sec3-2 and skb1∆sec8-1 double mutants compared with sec8-1 or sec3-2 alone, similar to growth suppression (Supplemental Figure S2). slf1∆ showed similar but less pronounced phenotypes at higher temperatures (Figure 4, A and B). The synthetic defects observed with skb1∆exo70∆ (or slf11∆exo70∆) and skb1∆for3∆ mutants suggest that Skb1 and Slf1 may share a function with Exo70 and For3 in spatial control of exocytosis. Overall, these genetic interactions suggest that Skb1–Slf1–Psy1 nodes function in regulating exocytosis.
FIGURE 4:
Genetic evidence for Skb1–Slf1–Psy1 node function in exocytosis. (A) Septation index in cells of indicated strains at 32°C (Left) or 37°C (Right). Growth defects or suppression with skb1∆ or slf1∆ are indicated by a black X or green arrow, respectively. n > 100 per strain. (B) Blankophor staining of indicated strains, showing cell separation defects of strains grown at 37°C. Bar, 7 µm.
Loss of Skb1–Slf1–Psy1 nodes leads to ectopic exocyst at cell sides
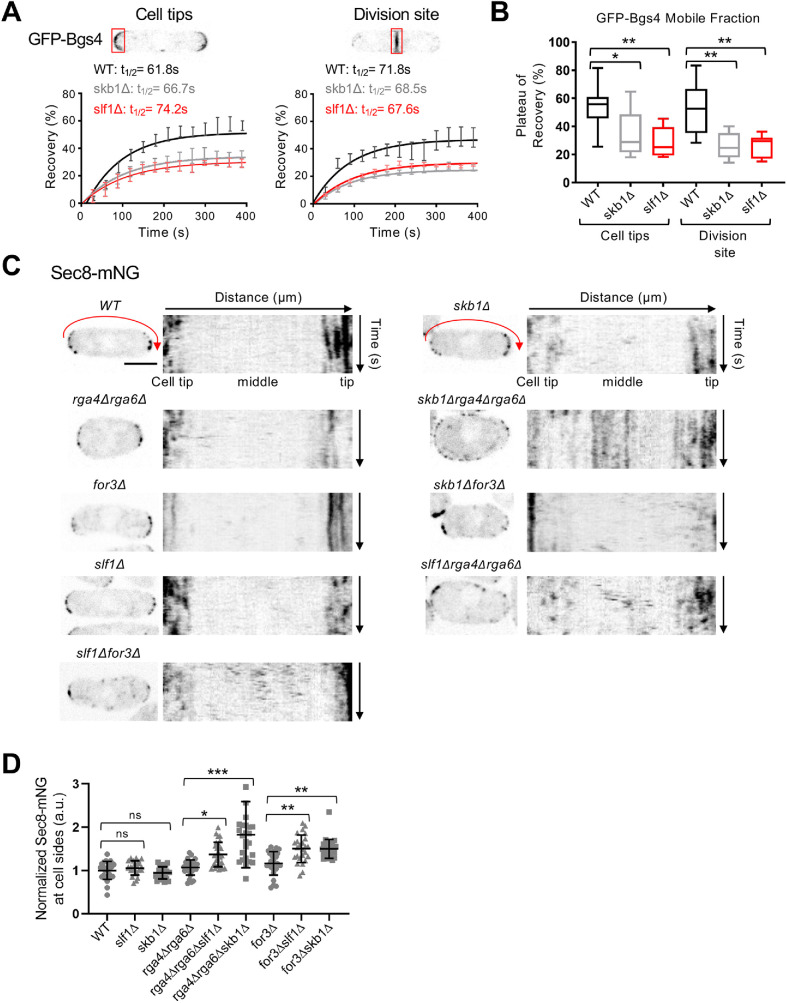
Based on these genetic interactions, we performed a series of microscopy-based experiments to test the role of Skb1-Slf1-Psy1 nodes in spatial control of exocytosis. Polarized exocytosis delivers the β-glucan synthase subunit Bgs4 to sites of active growth for cell wall synthesis (Cortés et al., 2005, 2015). In FRAP assays, photobleached GFP-Bgs4 signal at cell tips and the division site recovers rapidly (Figure 5A), consistent with cycles of endocytosis and polarized exocytosis at these sites. We found that skb1∆ and slf1∆ caused a significant decrease in the plateau of this recovery (Figure 5B), although the rate of recovery was unaffected. This result suggests that loss of nodes alters the normal trafficking and flux of Bgs4 protein at cell tips, consistent with Skb1–Slf1–Psy1 nodes contributing to spatial control of exocytosis in cells.
FIGURE 5:
Loss of Skb1–Slf1–Psy1 nodes leads to changes in the pattern of exocytosis. (A) FRAP curves of GFP-Bgs4 at cell tips or the division site. Representative images of cells expressing GFP-Bgs4 are shown. n > 10 cells for each strain. (B) Plateau of recovery (%) of GFP-Bgs4 is reduced in skb1∆ and slf1∆ cells. *p = 0.01 and **p < 0.001 determined by ANOVA. Graph shows median as a line, quartiles, max, and min. (C) Localization of Sec8-mNG in the indicated strains. To the right of each single cell image is a kymograph showing Sec8 localization along cell sides (red arrow) over time. Scale bar, 4 µm. (D) Normalized mean intensity of Sec8-mNG along cell sides for the indicated strains. n > 25 for each strain. Graph shows mean ± SD. ns p ≥ 0.05, *p < 0.04, **p < 0.002, and ***p < 0.0001 determined by ANOVA.
To test this possibility more rigorously, we directly imaged exocyst component Sec8. Sec8-mNeonGreen (mNG) localized to growing cell tips and to the cell division site of WT cells as well as of skb1∆ and slf1∆ cells (Figure 5C). Because disruption of Skb1–Slf1–Psy1 nodes did not lead to aberrant exocyst localization, we tested the possibility that nodes act in parallel with other mechanisms to prevent exocytosis along cell sides. For example, the Cdc42 GAPs Rga4 and Rga6 localize along cell sides to prevent Cdc42 activation at these sites (Das et al., 2007; Tatebe et al., 2008; Kokkoris et al., 2014; Revilla-Guarinos et al., 2016). In time-lapse images of cells lacking both nodes and Cdc42 GAPs, we observed ectopic localization of the exocyst component Sec8-mNG in the middle of cells (Figure 5C). Importantly, these defects were more severe in skb1∆ rga4∆ rga6∆ (or slf1∆ rga4∆ rga6∆) triple mutant cells than in skb1∆ (or slf1∆) or rga4∆ rga6∆ mutants alone (Figure 5D). To extend this result, we performed similar assays for cells lacking nodes and actin cables, which target secretory vesicles away from cell sides. Combining node and actin cable mutations in the skb1∆ for3∆ (or slf1∆ for3∆) double mutant led to aberrant localization of Sec8-mNG at cell sides (Figure 5, C and D). Together, these results show that nodes sequester Psy1 to prevent mislocalization of the exocytic machinery to cell sides and act in parallel with other mechanisms including Cdc42 GAPs and actin cables.
Skb1–Slf1–Psy1 nodes help maintain cell width
The spatial pattern of exocytosis defines fission yeast cell morphology, as localized secretion of cell wall proteins and modification of enzymes leads to cell growth (Bendezú and Martin, 2011; Atilgan et al., 2015; Abenza et al., 2015). Our results show that Skb1–Slf1–Psy1 nodes inhibit exocytosis at cell sides together with additional mechanisms mediated by Rga4, Rga6, and For3. Defects in spatial control of exocytosis should be accompanied by morphological consequences for cell shape. We found that cells lacking Skb1 were slightly wider than WT cells, but this difference was not statistically significant. Previous studies identified a cell width defect for rga4∆, rga6∆, and for3∆ mutants (Feierbach and Chang, 2001; Das et al., 2007; Revilla-Guarinos et al., 2016). Because skb1∆ and slf1∆ exhibited synthetic defects with these other mutants in positioning exocytosis, we tested their combined effects on cell morphology. We found that skb1∆ was additive with rga4∆rga6∆ and for3∆ in increasing cell width, as the mutants with skb1∆ were significantly wider than any of the rga4∆rga6∆ or for3∆ mutants alone (Figure 6). Cells lacking Slf1 showed similar results to skb1∆, but the effect was less pronounced (Figure 6), which may be due to additional functions for Skb1, as suggested by previously noted differences in skb1∆ and slf1∆ phenotypes (Deng et al., 2014). These combined results indicate that Skb1–Slf1 nodes sequester Psy1 at the cell middle to prevent aberrant exocytosis and this mechanism works in parallel to previously identified mechanisms including Cdc42 GAPs and actin cables. Consistent with Skb1–Slf1–Psy1 nodes functioning independently of Cdc42 GAPs at cell sides, nodes do not colocalize with Rga4 or Rga6 (Supplemental Figure S3). Overall, these results suggest that Skb1–Slf1 nodes work in parallel with Cdc42 GAPs and actin cables for polarized morphogenesis.
FIGURE 6:
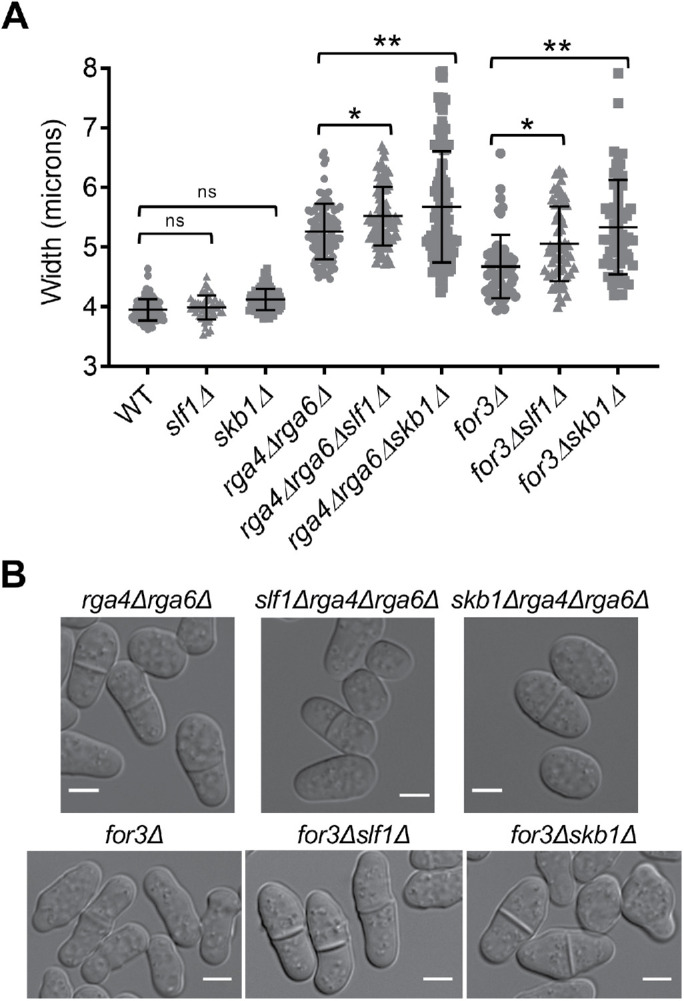
Nodes contribute to cell width control. (A) Cell width (µm) of indicated cell types. ns p ≥ 0.05, *p < 0.05, and **p < 0.0001 determined by ANOVA. n > 50 for each cell type. Graph shows mean ± SD. (B) Representative images showing wider cells with skb1∆ and slf1∆. Bars, 4 µm.
Generation of a psy1 mutant that does not localize to Skb1–Slf1 nodes
Defects in exocyst localization and cell morphology in skb1∆ and slf1∆ mutants may be caused by loss of Psy1 sequestration at nodes, but we cannot exclude a role for other aspects of Skb1 and Slf1 function in these defects. To focus more specifically on Psy1 localization at nodes, we sought to generate a Psy1 mutant that no longer localizes to Skb1–Slf1 nodes. Because psy1 is an essential gene, we initially examined truncated Psy1 constructs fused to GFP and integrated into the genomes of cells that also expressed WT psy1. Truncated GFP-Psy1 that lacked its N-terminal Habc domain (HabcΔ) or C-terminal membrane anchor (MAΔ) no longer localized to nodes, while a Psy1 protein that lacked its SNARE motif (SNAREΔ) retained node localization (Supplemental Figure S4). psy1-MAΔ had an overall cytoplasmic distribution, consistent with a role in PM localization. Because psy1-HabcΔ retained PM localization while disrupting node localization, we focused on the role of the Habc domain in node localization.
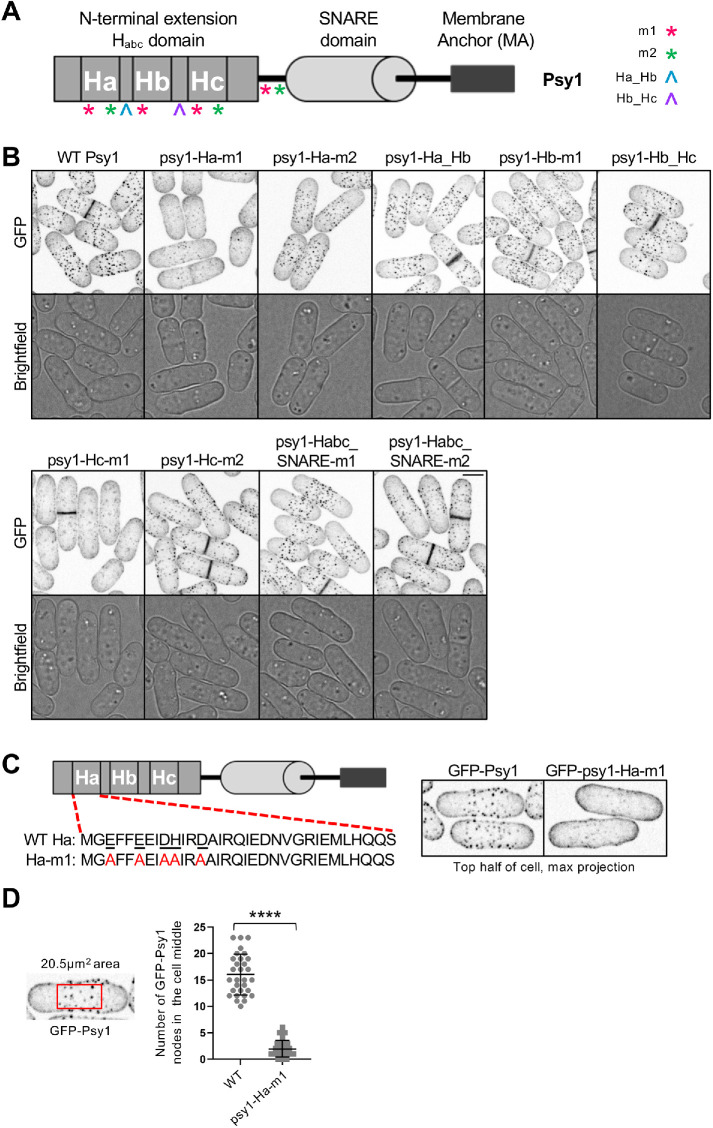
Habc domains of SNARE proteins consist of three alpha-helical regions termed Ha, Hb, and Hc. We mutated charged surface-exposed residues found outside and within the alpha-helical regions of the Habc domain (Figure 7A). Two mutants were identified with reduced localization to nodes: psy1-Ha-m1, which contains five mutations of charged residues to alanine in the N-terminal half of the Ha region, and psy1-Hc-m1, which contains five mutations of charged residues to alanine in the N-terminal half of the Hc region (Figure 7, A and B; see Supplemental Table S2 for specific amino acid mutations). psy1-Ha-m1 localized homogenously throughout the plasma membrane with minimal concentration at nodes. psy1-Hc-m1 localized homogenously throughout the plasma membrane but also ectopically to intracellular puncta, which were seen most clearly in middle focal plane microscopy images (Supplemental Figure S5A). We chose the psy1-Ha-m1 mutant to characterize further because it lost node localization without additional changes to localization.
FIGURE 7:
Analysis of Psy1 mutant node localization. (A) Diagram of Psy1 protein domains and notation of location of mutations (see Supplemental Table S2 for specific amino acid mutations). (B) Maximum projection images of z-series taken of GFP tagged Psy1 or mutant form of psy1 as listed. Single middle z-slice images shown for brightfield. Bar, 4 µm. (C) Amino acid sequence of Ha domain in WT Psy1 or psy1-Ha-m1 (Left). Representative images showing GFP tagged Psy1 or psy1-Ha-m1. Maximum intensity projections were created from the top half of cell z-stack images that encompass one side of the cell membrane (Right). (D) Number of GFP-Psy1 nodes in the cell middle above a set threshold intensity and size. **** p < 0.0001 determined by ANOVA. n ≥ 30 for each cell type. Graph shows mean ± SD. (Left) Representative image showing size of 20.5-µm2 boxed region that was used to define the middle of cells for analysis. The cell is reproduced from panel C to show selection of region of interest.
Psy1 sequestration into Skb1–Slf1 nodes promotes polarized morphogenesis
From confocal images, GFP-psy1-Ha-m1 exhibited dramatically reduced node localization (Figure 7C). We quantified the number of Psy1 nodes in the cell middle using a threshold method and found that psy1-Ha-m1 localization to nodes was indeed significantly reduced compared with that in WT cells (Figure 7D). The global intensity of GFP-psy1-Ha-m1 was similar to that of WT GFP-Psy1 (Supplemental Figure S5B), meaning that loss of node localization was not due to changes in overall protein concentration. We conclude that the Habc domain is required for Psy1 localization to nodes, and the psy1-Ha-m1 mutant fails to localize to nodes.
Using this new mutant, we tested whether Psy1 is necessary for Skb1–Slf1 node formation. The appearance, number, and intensity of mCherry-Slf1 nodes in the psy1-Ha-m1 mutant were unchanged compared with those in WT cells (Supplemental Figure S6), showing that Skb1–Slf1 nodes remain intact when Psy1 is not concentrated in these structures. This result supports a model where Skb1 and Slf1 form the required and interdependent core of nodes, and Psy1 is recruited as a peripheral component of these structures.
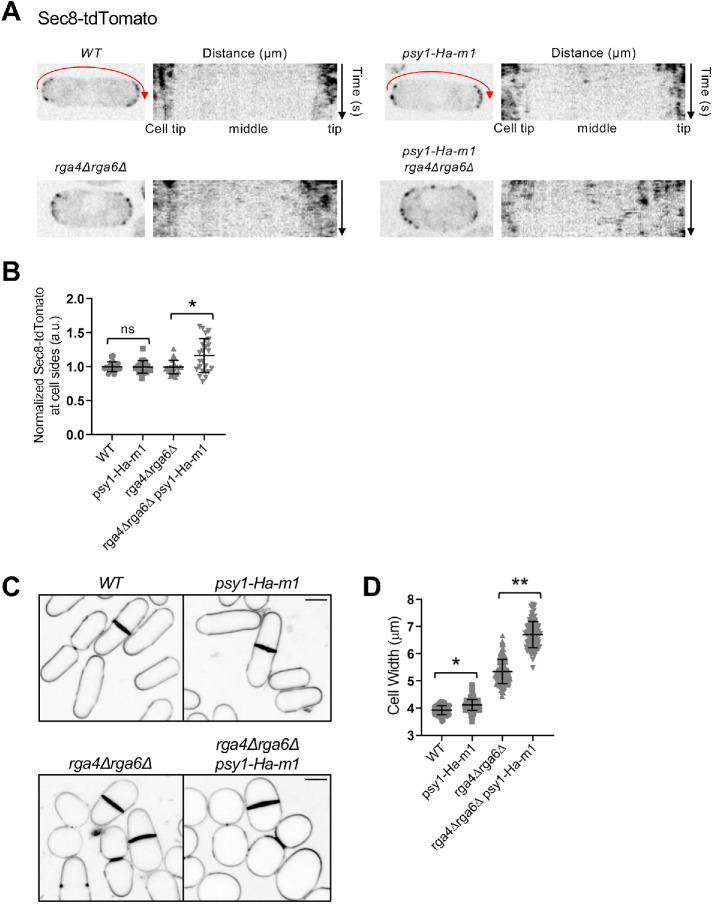
Next, we used the psy1-Ha-m1 mutant to test the functional role of Psy1 at nodes. For these experiments, we imaged exocyst component Sec8-tdTomato similarly to our earlier experiments with skb1∆ and slf1∆. From time-lapse images of cells containing psy1-Ha-m1 and lacking Cdc42 GAPs, we observed ectopic localization of Sec8-tdTomato in the cell middle (Figure 8A). Critically, this defect was greater in the psy1-Ha-m1 rga4∆ rga6∆ triple mutant than in either rga4∆ rga6∆ double mutant or the psy1-Ha-m1 mutant alone (Figure 8B). These results indicate that sequestration of Psy1 into nodes prevents mislocalization of exocytic machinery at cell sides.
FIGURE 8:
psy1-Ha-m1 exhibits ectopic exocyst at cell sides and increased cell width. (A) Localization of Sec8-tdTomato in indicated strains. To the right of each single cell image is a kymograph showing Sec8 localization along cell sides (red arrow) over time. (B) Normalized mean intensity of Sec8-tdTomato along one cell side for the indicated strains. n > 25 for each strain. Graph shows mean ± SD. ns p ≥ 0.05 and *p < 0.001 determined by ANOVA. (C) Blankophor staining of indicated strains, showing increased cell width with psy1-Ha-m1. Bars, 4 µm. (D) Cell width (µm) of indicated cell types. *p < 0.001 and ** p < 0.0001 determined by ANOVA. n > 100 for each cell type. Graph shows mean ± SD.
Defects in spatial control of exocytosis of mutants lacking Cdc42 GAPs and skb1∆ (or slf1∆) were accompanied by morphological changes in cell shape. We found that psy1-Ha-m1 cells were significantly wider than WT cells. Further, combining psy1-Ha-m1 with rga4∆ rga6∆ dramatically increased cell width compared with either rga4∆ rga6∆ double mutant or the psy1-Ha-m1 mutant alone (Figure 8, C and D). We conclude that sequestration of Psy1 into Skb1–Slf1 nodes prevents aberrant exocytosis at cell sides to reinforce polarized morphogenesis in fission yeast.
DISCUSSION
In this study, we have shown that Psy1 is sequestered in Skb1–Slf1 nodes at nongrowing regions of the PM to prevent ectopic exocytosis at these sites. Our genetic experiments reveal that this new mechanism acts in parallel to actin cable transport and Cdc42 GAPs. This demonstrates that ectopic growth along cell sides is inhibited by multiple mechanisms that reinforce cell morphology, in particular for control of cell width (Figure 9). We anticipate that signaling pathways that control Psy1 nodes, actin cables, and Cdc42 GAPs are further reinforced by physical barriers to exocytosis at cell sides such as the cortical endoplasmic reticulum (Ng et al., 2018). This combination of mechanisms along cell sides supports the notion that cell polarity arises from multiple activities that affect different steps in the trafficking, docking, and fusion of exocytic secretory vesicles.
FIGURE 9:
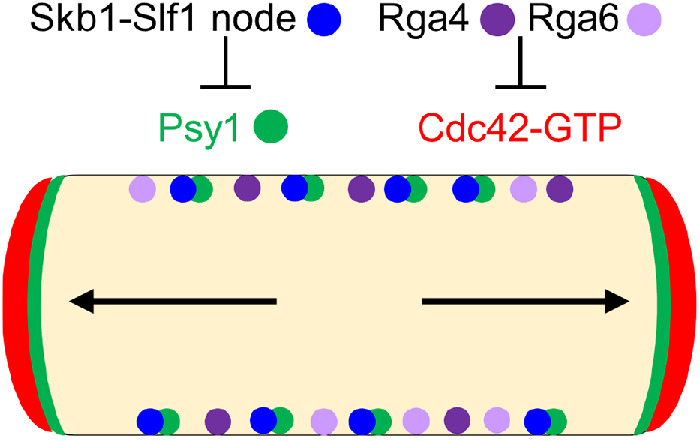
Working model for polarized morphogenesis through inhibition of exocytosis along the sides of fission yeast cells. Green circles denote Psy1 sequestered by Skb1-Slf1 nodes (blue circles) along cell sides. Rga4 and Rga6 (purple circles) inhibit Cdc42-GTP at these sites. Cdc42-GTP denoted as a broad red band directs actin cable (black arrows) organization to cell tips. Cables act as tracks for secretory vesicles that fuse to the PM through the action of SNARE Psy1 (broad green band at tips) to facilitate growth.
We examined the functional role of Psy1 sequestration into nodes using three different mutants: skb1∆, slf1∆, and psy1-Ha-m1. Each of these mutants prevents Psy1 localization to nodes, providing three separate test cases for the function of Psy1 at nodes. In all three cases, we observed ectopic exocytosis along cell sides and an increase in cell width, particularly when combined with mutations in Cdc42 GAPs. The combination of results from these three mutants strongly supports the model that nodes sequester Psy1 to prevent exocytosis along cell sides. We note that the severity of phenotypes varies among these three mutants, likely reflecting differences in the functions and protein–protein interactions of Skb1 and Slf1. In addition, we do not exclude the possibility that the psy1-Ha-m1 mutation alters the activity of Psy1. In fact, some members of the Syntaxin family undergo intramolecular conformational changes that regulate their activity and vesicle fusion, where the Habc domain folds back onto the SNARE motif creating a ‘closed’ and inactive conformation (Dulubova et al., 1999; Gerber et al., 2008; MacDonald et al., 2010). More work is needed to test if Psy1 exhibits such an autoinhibitory conformation, as well as to identify the role of the Ha-m1 mutation in this mechanism. More generally, it will be interesting to learn if nodes regulate Psy1 activity in addition to its localization through interactions with Skb1, Slf1, or possibly via other unidentified node proteins.
Sequestration of Psy1 into nodes by Skb1–Slf1 has implications for SNARE proteins beyond yeast. We note that SNARE proteins have been shown to be clustered and sequestered in human cells with connection to several diseases. For example, individuals with insulin resistance exhibit sequestration of SNAP-23 (synaptosomal-associated protein of 23 kDa) by lipid droplets, thus blocking exocytosis of glucose transporters (Boström et al., 2007). In addition, SNAREs are aberrantly sequestered in cholesterol-enriched regions of LSD (lysosomal storage disorder) endolysosomal membranes. This abnormal spatial organization locks SNAREs in complexes and impairs their sorting and recycling (Fraldi et al., 2010). Alpha-synuclein aggregates preferentially sequester SNAP-25 and VAMP-2 (vesicle-associated membrane protein 2) leading to reduced exocytosis and contribute to neurotoxicity (Choi et al., 2018). Overall, regulated sequestration of SNARE proteins may be a general mechanism leading to inhibition of exocytosis in a wide range of cell types and organisms.
MATERIALS AND METHODS
Strains, plasmids, and growth conditions
Standard methods were used to grow and culture Schizosaccharomyces pombe cells (Moreno et al., 1991). Yeast strains used in this study are listed in Supplemental Table S1. Gene fusions were expressed from their endogenous promoters unless otherwise indicated. One-step PCR-based homologous recombination was performed for tagging or deletion of genes on the chromosome (Bähler et al., 1998). To obtain N-terminal GFP-tagged Psy1, the psy1+ promoter was amplified using primers containing BglII and PacI sites at the 5′ and 3′ ends, respectively. This PCR product was inserted in place of the P3nmt1 promoter in the pFA6A-kanMX6-P3nmt1-GFP plasmid. PCR product from the pFA6A-kanMX6-psy1+-GFP plasmid was inserted adjacent (at the 5′ end) to the psy1 open reading frame on the chromosome. Slf1 N-terminal mCherry tagging was described previously (Deng et al., 2014). Plasmids used in this study are listed in Supplemental Table S2. The majority of plasmids used in this study contained the pDC99 backbone for integration at the leu1 locus and included the ura4+ cassette. To create pDC99-Ppsy1-GFP-psy1-Tpsy1 we PCR-amplified Ppsy1-GFP-psy1-Tpsy1 using 5′ and 3′ primers containing Kpn1 and SacII sites, respectively, from genomic DNA of fission yeast cells. This PCR product was then inserted into Kpn1/SacII-digested pDC99 plasmid. Mutations or substitutions were introduced into psy1 in the pDC99-Ppsy1-GFP-psy1-Tpsy1 plasmid using the NEB Q5 site directed mutagenesis kit.
To measure cell width at division (Figures 6 and 8), prototrophic strains were grown in EMM4S medium at 32°C and stained with Blankophor before imaging. To determine the septation index of cells (Figure 4A), cells were grown at 25°C in EMM4S medium and then cultures were shifted to 32°C or 37°C for 5 h before staining with Blankophor and imaging. In Supplemental Figure S1, cells were grown at 25°C in EMM4S medium and then treated with 10% 1,6-hexanediol or DMSO for 45 min before imaging.
Coimmunoprecipitation and immunoblotting
Coimmunoprecipitation of proteins from fission yeast cell extracts were performed using a protocol adapted from Deng and Moseley (2013). For Figure 1C, mCherry-Slf1 and GFP-Psy1 coimmunoprecipitation was performed using 50 ml of 0.5 OD595 cells grown in YE4S at 25°C.
Cells were harvested by centrifugation, washed once in Milli-Q water, resuspended in 400 μl of lysis buffer (20 mM HEPES (4-(2-hydroxyethyl)-1-piperazineethanesulfonic acid), pH 7.4, 200 mM NaCl, 1% Triton X-100, 1 mM phenylmethylsulfonyl fluoride, complete EDTA-free protease inhibitor tablets [Roche, Indianapolis, IN]) together with 200 μl of glass beads, and lysed using a Mini-beadbeater-16 (BioSpec, Bartlesville, OK; two cycles of 1 min at max speed). Lysates were spun at 14,000 × g for 10 min at 4°C and supernatants were recovered. α-GFP magnetic beads (Allele Biotech) were washed three times in lysis buffer, added to clarified cell lysates, and rotated for 2 h at 4°C. After lysate removal, beads were washed five times in lysis buffer, resuspended in SDS–PAGE sample buffer (65 mM Tris, pH 6.8, 3% SDS, 10% glycerol, 10% 2-mercaptoethanol), and boiled for 5 min at 99°C, followed by SDS–PAGE and western blotting.
For detection of 6His-Skb1 and GFP-Psy1 interaction, pJM482 (pREP3x-6His-skb1) or pJM210 (pRep3x) was transformed into appropriate strains and colonies were selected on EMM-Leu + 10 μg/mL thiamine plates. Cells were grown in 50 ml EMM-Leu + 10 μg/ml thiamine until they reached 0.5 OD595. Coimmunoprecipitation and SDS–PAGE followed by Western blotting was carried out as mentioned above, except that TALON metal affinity resin (Takara) was used instead of α-GFP beads for 6His-Skb1 enrichment.
Western blots were probed with anti-6His (SC-8036; Santa Cruz Biotechnology), anti-GFP (Moseley et al., 2009), and anti-RFP (NBP1-69962; Novus Biologicals) antibodies.
Microscopy and image analysis
Fission yeast cells were grown in EMM4S medium to logarithmic phase for imaging. Time-lapse imaging was performed using two spinning-disk confocal microscope systems. The first system was an Andor CSU-WI (Nikon software) equipped with a 100× 1.45 NA CFI Plan Apochromat Lambda objective lens (Nikon); 405-, 445-, 488-, 560-, 637-, and 685-nm laser lines; and an Andor Zyla camera on an inverted microscope (Ti-E, Nikon). The second system was a Yokogawa CSU-WI (Nikon Software) equipped with a 100× 1.45 NA CFI Plan Apochromat Lambda objective lens (Nikon); 405-, 488-, and 561-nm laser lines; and a photometrics Prime BSI camera on an inverted microscope (Eclipse Ti2, Nikon). Experimental and control samples in a data set were always collected on the same microscope to ensure the accurate comparison of images for analysis.
For most time-lapse imaging, single z-slice images were captured every 1 or 3 s using cells mounted on an agarose slab at room temperature. Static images of fission yeast cells shown in Figures 1A, 4B, and 6B and Supplemental Figures S1 and S3 were taken at room temperature with a DeltaVision Imaging System (Applied Precision) equipped with an Olympus IX-71 inverted wide-field microscope, a Photometrics CoolSNAP HQ2 camera, and Insight solid-state illumination. Most images were acquired with 11 z-stacks and a 0.4-μm step using cells mounted in EMM4S liquid media. Images were iteratively deconvolved using SoftWoRx software (Applied Precision), as indicated in the figure legends. All other static images shown were taken at room temperature using the spinning-disk confocal microscopy systems described above.
Image processing and analysis were performed using ImageJ (National Institutes of Health). Figures were generated using maximum-intensity projections of z-stacks for fluorescent images and a single middle z-section for DIC images, unless otherwise indicated in the figure legend. For global intensity quantification of GFP-tagged Psy1, Skb1, or Slf1 (Figure 1D), sum intensity projections were created from images (40 z-sections, 0.17-μm spacing), and an ROI was drawn around the outline of cells. The intensity of an equal-sized ROI with no cell present was used to subtract background. For the mean intensity (integrated density) per node measurements (Figure 1D), sum projections were created from the top half of the cell z-stack that encompass one side of the cell membrane. An ROI was drawn around each individual node (measured 175 nodes per strain) and the background was subtracted using the intensity of an equal-sized ROI with no node present. Images used to obtain these measurements were taken with a Zeiss LSM 880 laser scanning confocal microscope (see below).
To quantify mean Sec8-mNG (or Sec8-tdTomato) intensity in the cell middle over time (Figures 5D and 8B), the intensity of an equal-sized ROI with no cell present was used to subtract the background from selected cells. Using the segmented line tool, a line was drawn from the middle of cell tips along the side of the cells. Kymographs were generated using the multiple kymograph plug-in for ImageJ to display Sec8-mNG (or Sec8-tdTomato) signal over time along the line. The mean Sec8-mNG (or Sec8-tdTomato) intensity over time in the cell middle was measured from the kymograph. The same size box was drawn to cover the same width along the cell side for all cell types. Intensity values were normalized to the average Sec8 intensity in the cell middle of WT cells and plotted on a graph.
To examine GFP-Psy1 intensity along the cell sides, the intensity along an equal sized line was analyzed from middle Z-plane images after background subtraction. Peaks of GFP-Psy1 intensity indicating the presence of a Psy1 node along the sides of WT cells were excluded from data points to obtain the average GFP-Psy1 intensity outside of nodes at cell sides. The average GFP-Psy1 intensity along cell sides for each cell was normalized to the average GFP-Psy1 intensity outside of nodes in WT cells and plotted on a graph (Figure 2C). Average GFP-Psy1 intensity at cell tips was determined from middle Z-plane images after background subtraction. A line was drawn at the cell tips and the average GFP-Psy1 was determined. Values for each cell were normalized to the average GFP-Psy1 intensity at the cell tips of WT cells and plotted on a graph (Figure 2C).
To quantify the number of GFP-Psy1 nodes in the cell middle (Figure 7D), maximum intensity projections of the top half of the cell z-stack images (1–10z) that encompass one side of the cell membrane were analyzed after background subtraction. A 20.5-µm2 rectangular region was used to define the middle of cells for analysis. A fluorescence threshold was set above background that selected fluorescent pixels at nodes. Next, the values above a threshold were analyzed by size and spots larger than 0.02 µm2 were counted as nodes and plotted on a graph (Figure 7D).
For GFP-Psy1 global intensity quantification, sum intensity projections were created from all 17 z-sections at 0.3-μm spacing, and an ROI was drawn around the outline of cells. The intensity of WT cells without any fluorescently tagged proteins were used to subtract background. Values were normalized to the average GFP-Psy1 global intensity of WT cells and plotted on a graph (Supplemental Figure S5B)
To quantify the number and intensity of mCherry-Slf1 nodes per cell, maximum-intensity projections were created from all 17 z-sections at 0.3-μm spacing. Brightfield images were used to create a binary cell mask to identify cells. Using a CellProfiler image analysis pipeline (McQuin et al., 2018), a fluorescent threshold was set above background that selected mCherry-Slf1 nodes. The intensity of each node and the number of nodes per cell was output. The average number of nodes per cell was determined and plotted on a graph (Supplemental Figure S6B). The average mCherry-Slf1 node intensity per cell was calculated and plotted on a graph and normalized to WT cells (Supplemental Figure S6C).
FRAP analysis
To perform FRAP experiments (Figure 3, A and B, and Figure 5, A and B), images were captured at a single z-section on an agar pad at room temperature using a Zeiss LSM 880 laser scanning confocal microscope equipped with 100× alpha Plan-Apochromat/NA 1.46 Oil DIC M27 Elyra objective, GaAsP Detectors, and Zen Blue acquisition software. The middle focal plane of cells was chosen to bleach. After three prebleach images were collected, selected ROIs were bleached to <50% of the original fluorescence intensity using the laser scanner. Postbleach images were acquired for a duration long enough so that the recovery curve reached a plateau. After background subtraction and correction for photobleaching, the data were normalized to the mean prebleach intensity of the ROI and set to 100%. The intensity just after bleaching was set to 0% so that FRAP curves represent the percentage recovery of fluorescent signal. The intensity of every three consecutive postbleach time points was averaged to reduce noise. The intensity data were plotted and fitted using the exponential equation y = m1 + m2 × exp(-m3 × X), where m3 is the off-rate, using Prism 8 (GraphPad Software). The half-time of recovery was calculated using the equation t1/2 = (ln 2)/m3.
Statistical analysis
Data analysis was performed using Prism 8 (GraphPad Software). A two-tailed Student’s t test was performed to determine statistical differences between two sets of data. An ANOVA was performed to determine statistical differences between sets of data.
Supplementary Material
Acknowledgments
We thank members of the Moseley laboratory for helpful discussions and comments on the manuscript; the Biomolecular Targeting Core (BioMT) (P20-GM113132) and the Imaging Facility at Dartmouth for the use of equipment; and Sophie Martin, Jian-Qiu Wu, Pilar Perez, and Juan Carlos Ribas for sharing yeast strains. This work was funded by grants from the National Institutes of General Medical Sciences (NIGMS) (R01GM099774 and R01GM133856) to J.B.M.
Abbreviations used:
- FRAP
fluorescence recovery after photobleaching
- GAP
GTPase-activating protein
- PM
plasma membrane
- SNARE
soluble N-ethylmaleimide-sensitive factor-attachment protein receptors
- ts
temperature-sensitive
- WT
wild type.
Footnotes
This article was published online ahead of print in MBoC in Press (http://www.molbiolcell.org/cgi/doi/10.1091/mbc.E20-05-0277).
REFERENCES
- Abenza JF, Couturier E, Dodgson J, Dickmann J, Chessel A, Dumais J, Carazo Salas RE (2015). Wall mechanics and exocytosis define the shape of growth domains in fission yeast. Nat Commun 6, 8400. [DOI] [PMC free article] [PubMed] [Google Scholar]
- Atilgan E, Magidson V, Khodjakov A, Chang F (2015). Morphogenesis of the fission yeast cell through cell wall expansion. Curr Biol 25, 2150–2157. [DOI] [PMC free article] [PubMed] [Google Scholar]
- Bähler J, Wu JQ, Longtine MS, Shah NG, McKenzie A, Steever AB, Wach A, Philippsen P, Pringle JR (1998). Heterologous modules for efficient and versatile PCR-based gene targeting in Schizosaccharomyces pombe. Yeast 14, 943–951. [DOI] [PubMed] [Google Scholar]
- Bendezú FO, Martin SG (2011). Actin cables and the exocyst form two independent morphogenesis pathways in the fission yeast. Mol Biol Cell 22, 44–53. [DOI] [PMC free article] [PubMed] [Google Scholar]
- Bendezú FO, Vincenzetti V, Martin SG (2012). Fission yeast sec3 and Exo70 are transported on actin cables and localize the exocyst complex to cell poles. PLoS One 7, e40248. [DOI] [PMC free article] [PubMed] [Google Scholar]
- Bendezú FO, Vincenzetti V, Vavylonis D, Wyss R, Vogel H, Martin SG (2015). Spontaneous Cdc42 polarization independent of GDI-mediated extraction and actin-based trafficking. PLoS Biol 13, e1002097. [DOI] [PMC free article] [PubMed] [Google Scholar]
- Boström P, Andersson L, Rutberg M, Perman J, Lidberg U, Johansson BR, Fernandez-Rodriguez J, Ericson J, Nilsson T, Borén J, Olofsson SO (2007). SNARE proteins mediate fusion between cytosolic lipid droplets and are implicated in insulin sensitivity. Nat Cell Biol 9, 1286–1293. [DOI] [PubMed] [Google Scholar]
- Chiou J, Balasubramanian MK, Lew DJ (2017). Cell polarity in yeast. Annu Rev Cell Dev Biol 33, 77–101. [DOI] [PMC free article] [PubMed] [Google Scholar]
- Choi MG, Kim MJ, Kim DG, Yu R, Jang YN, Oh WJ (2018). Sequestration of synaptic proteins by alphasynuclein aggregates leading to neurotoxicity is inhibited by small peptide. PLoS One 13, e0195339. [DOI] [PMC free article] [PubMed] [Google Scholar]
- Cortés JCG, Carnero E, Ishiguro J, Sánchez Y, Durán A, Ribas JC (2005). The novel fission yeast (1,3)β-D-glucan synthase catalytic subunit Bgs4p is essential during both cytokinesis and polarized growth. J Cell Sci 118, 157–174. [DOI] [PubMed] [Google Scholar]
- Cortés JC, Pujol N, Sato M, Pinar M, Ramos M, Moreno B, Osumi M, Ribas JC, Pérez P (2015). Cooperation between paxillin-like protein Pxl1 and glucan synthase Bgs1 Is essential for actomyosin ring stability and septum formation in fission yeast. PLoS Genet 11, e1005358. [DOI] [PMC free article] [PubMed] [Google Scholar]
- Das M, Wiley DJ, Medina S, Vincent HA, Larrea M, Oriolo A, Verde F (2007). Regulation of cell diameter, For3p localization, and cell symmetry by fission yeast Rho-GAP Rga4p. Mol Biol Cell 18, 2090–2101. [DOI] [PMC free article] [PubMed] [Google Scholar]
- Deng L, Kabeche R, Wang N, Wu JQ, Moseley JB (2014). Megadalton-node assembly by binding of Skb1 to the membrane anchor Slf1. Mol Biol Cell 25, 2660–2668. [DOI] [PMC free article] [PubMed] [Google Scholar]
- Deng L, Moseley JB (2013). Compartmentalized nodes control mitotic entry signaling in fission yeast. Mol Biol Cell 24, 1872–1881. [DOI] [PMC free article] [PubMed] [Google Scholar]
- Dulubova I, Sugita S, Hill S, Hosaka M, Fernandez I, Südhof TC, Rizo J (1999). A conformational switch in syntaxin during exocytosis: role of munc18. EMBO J 18, 4372–4382. [DOI] [PMC free article] [PubMed] [Google Scholar]
- Feierbach B, Chang F (2001). Roles of the fission yeast formin for3p in cell polarity, actin cable formation and symmetric cell division. Curr Biol 11, 1656–1665. [DOI] [PubMed] [Google Scholar]
- Feierbach B, Verde F, Chang F (2004). Regulation of a formin complex by the microtubule plus end protein tea1p. J Cell Biol 165, 697–707. [DOI] [PMC free article] [PubMed] [Google Scholar]
- Fraldi A, Annunziata F, Lombardi A, Kaiser HJ, Medina DL, Spampanato C, Fedele AO, Polishchuk R, Sorrentino NC, Simons K, Ballabio A (2010). Lysosomal fusion and SNARE function are impaired by cholesterol accumulation in lysosomal storage disorders. EMBO J 29, 3607–3620. [DOI] [PMC free article] [PubMed] [Google Scholar] [Retracted]
- Ganesan SJ, Feyder MJ, Chemmama IE, Fang F, Rout MP, Chait BT, Shi Y, Munson M, Sali A (2020). Integrative structure and function of the yeast exocyst complex. Protein Sci 29, 1486–1501. [DOI] [PMC free article] [PubMed] [Google Scholar]
- Gerber SH, Rah J, Min S, Liu X, Wit H, Dulubova I, Meyer AC, Rizo J, Arancillo M, Hammer RE, et al. (2008). Conformational switch of syntaxin-1 controls synaptic vesicle fusion. Science 321, 1507–1510. [DOI] [PMC free article] [PubMed] [Google Scholar]
- Goehring NW, Grill SW (2013). Cell polarity: mechanochemical patterning. Trends Cell Biol 23, 72–80. [DOI] [PubMed] [Google Scholar]
- Jourdain I, Dooley HC, Toda T (2012). Fission yeast Sec3 bridges the exocyst complex to the actin cytoskeleton. Traffic 13, 1481–1495. [DOI] [PMC free article] [PubMed] [Google Scholar]
- Kelly FD, Nurse P (2011). Spatial control of Cdc42 activation determines cell width in fission yeast. Mol Biol Cell 22, 3801–3811. [DOI] [PMC free article] [PubMed] [Google Scholar]
- Kokkoris K, Castro DG, Martin SG (2014). The Tea4-PP1 landmark promotes local growth by dual Cdc42 GEF recruitment and GAP exclusion. J Cell Sci 127, 2005–2016. [DOI] [PubMed] [Google Scholar]
- Kroschwald S, Maharana S, Mateju D, Malinovska L, Nüske E, Poser I, Richter D, Alberti S (2015). Promiscuous interactions and protein disaggregases determine the material state of stress-inducible RNP granules. Elife 4, e06807. [DOI] [PMC free article] [PubMed] [Google Scholar]
- MacDonald C, Munson M, Bryant NJ (2010). Autoinhibition of SNARE complex assembly by a conformational switch represents a conserved feature of syntaxins. Biochem Soc Trans 38, 309–212. [DOI] [PMC free article] [PubMed] [Google Scholar]
- Martin SG, Arkowitz RA (2014). Cell polarization in budding and fission yeasts. FEMS Microbiol Rev 38, 228–253. [DOI] [PubMed] [Google Scholar]
- Martin SG, Chang F (2006). Dynamics of the formin for3p in actin cable assembly. Curr Biol 16, 1161–1170. [DOI] [PubMed] [Google Scholar]
- Martin SG, McDonald WH, Yates JR, Chang F (2005). Tea4p links microtubule plus ends with the formin for3p in the establishment of cell polarity. Dev Cell 8, 479–491. [DOI] [PubMed] [Google Scholar]
- Martin SG, Rincón SA, Basu R, Pérez P, Chang F (2007). Regulation of the formin for3p by cdc42p and bud6p. Mol Biol Cell 18, 4155–4167. [DOI] [PMC free article] [PubMed] [Google Scholar]
- Mata J, Nurse P (1997). tea1 and the microtubular cytoskeleton are important for generating global spatial order within the fission yeast cell. Cell 89, 939–949. [DOI] [PubMed] [Google Scholar]
- McQuin C, Goodman A, Chernyshev V, Kamentsky L, Cimini BA, Karhohs KW, Doan M, Ding L, Rafelski SM, Thirstrup D, et al. (2018). CellProfiler 3.0: next-generation image processing for biology. PLoS Biol 16, e2005970. [DOI] [PMC free article] [PubMed] [Google Scholar]
- Mitchison JM, Nurse P (1985). Growth in cell length in the fission yeast Schizosaccharomyces pombe. J Cell Sci 75, 357–376. [DOI] [PubMed] [Google Scholar]
- Moreno S, Klar A, Nurse P (1991). Molecular genetic analysis of fission yeast Schizosaccharomyces pombe. Methods Enzymol 194, 795–823. [DOI] [PubMed] [Google Scholar]
- Moseley JB, Mayeux A, Paoletti A, Nurse P (2009). A spatial gradient coordinates cell size and mitotic entry in fission yeast. Nature 459, 857–860. [DOI] [PubMed] [Google Scholar]
- Nakano K, Imai J, Arai R, Toh-e A, Matsui Y, Mabuchi I (2002). The small GTPase Rho3 and the diaphanous/formin For3 function in polarized cell growth in fission yeast. J. Cell Sci 115, 4629–4639. [DOI] [PubMed] [Google Scholar]
- Ng AYE, Ng AQE, Zhang D (2018). ER-PM contacts restrict exocytic sites for polarized morphogenesis. Curr Biol 28, 146–153.e6. [DOI] [PubMed] [Google Scholar]
- Patel SS, Belmont BJ, Sante JM, Rexach MF (2007). Natively unfolded nucleoporins gate protein diffusion across the nuclear pore complex. Cell 129, 83–96. [DOI] [PubMed] [Google Scholar]
- Pelham HRB (1999). SNAREs and the secretory pathway—Lessons from yeast. Exp. Cell Res 247, 1–8. [DOI] [PubMed] [Google Scholar]
- Polgar N, Fogelgren B (2018). Regulation of cell polarity by exocyst-mediated trafficking. Cold Spring Harb Perspect Biol 10, a031401. [DOI] [PMC free article] [PubMed] [Google Scholar]
- Protopopov V, Govindan B, Novick P, Gerst JE (1993). Homologs of the synaptobrevin/VAMP family of synaptic vesicle proteins function on the late secretory pathway in S. cerevisiae. Cell 74, 855–861. [DOI] [PubMed] [Google Scholar]
- Pruyne D, Legesse-Miller A, Gao L, Dong Y, Bretscher A (2004). Mechanisms of polarized growth and organelle segregation in yeast. Ann Rev Cell Dev Biol 20, 559–591. [DOI] [PubMed] [Google Scholar]
- Revilla-Guarinos MT, Martín-García R, Antonia Villar-Tajadura M, Estravís M, Coll PM, Pérez P (2016). Rga6 is a fission yeast Rho GAP involved in Cdc42 regulation of polarized growth. Mol Biol Cell 27, 1524–1535. [DOI] [PMC free article] [PubMed] [Google Scholar]
- Ribbeck K, Görlich D (2002). The permeability barrier of nuclear pore complexes appears to operate via hydrophobic exclusion. EMBO J 21, 2664–2671. [DOI] [PMC free article] [PubMed] [Google Scholar]
- Rothman JE (1994). Intracellular membrane fusion. Adv Second Messenger Phosphoprotein Res 29, 81–96. [DOI] [PubMed] [Google Scholar]
- Snaith HA, Thompson J, Yates JR, Sawin KE (2011). Characterization of Mug33 reveals complementary roles for actin cable-dependent transport and exocyst regulators in fission yeast exocytosis. J Cell Sci 124, 2187–2199. [DOI] [PMC free article] [PubMed] [Google Scholar]
- Söllner T, Whiteheart SW, Brunner M, Erdjument-Bromage H, Geromanos S, Tempst P, Rothman JE (1993). SNAP receptors implicated in vesicle targeting and fusion. Nature 362, 318–324. [DOI] [PubMed] [Google Scholar]
- Südhof TC, Rothman JE (2009). Membrane fusion: grappling with SNARE and SM proteins. Science 323, 474–477. [DOI] [PMC free article] [PubMed] [Google Scholar]
- Tatebe H, Nakano K, Maximo R, Shiozaki K (2008). Pom1 DYRK regulates localization of the Rga4 GAP to ensure bipolar activation of Cdc42 in fission yeast. Curr Biol 18, 322–330. [DOI] [PMC free article] [PubMed] [Google Scholar]
- Tatebe H, Shimada K, Uzawa S, Morigasaki S, Shiozaki K (2005). Wsh3/Tea4 is a novel cell-end factor essential for bipolar distribution of tea1 and protects cell polarity under environmental stress in S. pombe. Curr Biol 15, 1006–1015. [DOI] [PubMed] [Google Scholar]
- Tay YD, Leda M, Spanos C, Rappsilber J, Goryachev AB, Sawin KE (2019). Fission yeast NDR/LATS kinase Orb6 regulates exocytosis via phosphorylation of the exocyst complex. Cell Reports 26, 1654–1667. [DOI] [PMC free article] [PubMed] [Google Scholar]
- TerBush DR, Maurice T, Roth D, Novick P (1996). The exocyst is a multiprotein complex required for exocytosis in Saccharomyces cerevisiae. EMBO J 15, 6483–6494. [PMC free article] [PubMed] [Google Scholar]
- Wang H, Tang X, Balasubramanian MK (2003). Rho3p regulates cell separation by modulating exocyst function in Schizosaccharomyces pombe. Genetics 164, 1323–1331. [DOI] [PMC free article] [PubMed] [Google Scholar]
- Wang H, Tang X, Liu J, Trautmann S, Balasundaram D, McCollum D, Balasubramanian MK (2002). The multiprotein exocyst complex is essential for cell separation in Schizosaccharomyces pombe. Mol Biol Cell 13, 515–529. [DOI] [PMC free article] [PubMed] [Google Scholar]
- Wang N, Lee IJ, Rask G, Wu JQ (2016). Roles of the TRAPP-II complex and the exocyst in membrane deposition during fission yeast cytokinesis. PLoS Biol 14, e1002437. [DOI] [PMC free article] [PubMed] [Google Scholar]
- Zhu Y-H, Hyun J, Pan Y-Z, Hopper JE, Rizo J, Wu J-Q (2018). Roles of the fission yeast UNC-13/Munc13 protein Ync13 in late stages of cytokinesis. Mol Biol Cell 29, 2259–2279. [DOI] [PMC free article] [PubMed] [Google Scholar]
Associated Data
This section collects any data citations, data availability statements, or supplementary materials included in this article.


