Dear Editor,
Small cell lung cancer (SCLC) features with high heterogeneity and poor prognosis. The major treatment strategy for SCLC remains combination chemotherapy over past decades, with only minor improvements. 1 And the application of immunotherapy has no impressive benefit for SCLC patients. 2 In this study, we identify a novel subtype of SCLC (SCLC‐I) with immunosuppressive feature and high genomic instability. Importantly, we find that POU2F3 is effective in predicting SCLC‐I, and the POU2F3‐high patients exhibit better responses to immunotherapy.
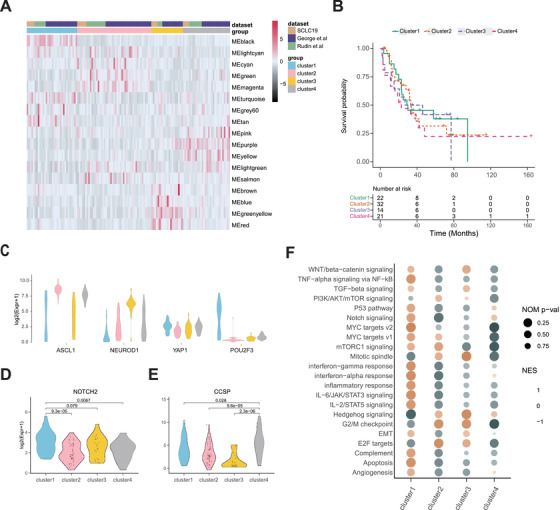
We performed weighted correlation network analysis (WGCNA) 3 to explore heterogeneity of SCLC through integrating transcriptomic data detailed in the Supplementary Material (SM), including 19 Chinese surgical samples and 112 samples from two public data. 4 , 5 We firstly transformed gene expression data into co‐expression module to capture genes with similar expression pattern and extracted 17 coherent modules. All SCLC samples were clustered into four subtypes (Figure 1A), which showed no obvious difference in survival (Figure 1B). Each subtype showed comparable percentages in these three datasets (Figure 1A, Figure S5A), indicative of equal contribution of these datasets in the integrative analysis.
FIGURE 1.

Subtyping 129 human small cell lung cancer (SCLC) using weighted gene co‐expression network. (A) Heatmap of eigenvectors of 17 network modules from weighted correlation network analysis (WGCNA). We combined three datasets after removing the batch effect by ComBat from ‘sva’ package in R. We divided the network into modules according to the correlations between the genes. The minimum size of the module was set as 10. We obtained 1016 genes for calculating adjacency matrix (power = 3). The co‐expression network was finally partitioned into 17 modules. All samples were divided into four clusters according to the module eigengenes by hierarchical clustering analysis (Euclidean distance, ward.D2 linkage). (B) Survival analysis of four SCLC clusters. (C) Violin plots indicating the range of expression of four markers (ASCL1, NEUROD1, YAP1 and POU2F3) among different clusters. (D) Violin plot of NOTCH2 level in each cluster. (E) Violin plot of CCSP level in each cluster. (F) Gene set enrichment analysis (GSEA) with normalized enrichment score (NES) and Nominal p‐values for hallmark gene sets associated with four clusters. The brighter color of NES indicates the up‐regulation of the pathway
To compare our findings with the previous study, in which SCLC was classified into SCLC‐A, SCLC‐N, SCLC‐P and SCLC‐Y, 6 we evaluated the relative expression of these markers in our clusters. We observed that cluster 2 and cluster 3 corresponded to the SCLC‐A and SCLC‐N, respectively (Figure 1C). Consistent with the observation from Gay et al., 7 we found that YAP1 had low expression and did not exclusively define a subtype of SCLC (Figure 1C). We found that CCSP (SCGB1A1), a secreted protein mainly produced by club cells to maintain airway integrity, 8 was specifically highly expressed in cluster 4 (Figure 1E, Figure S3E), indicating that certain SCLC might originate from club cells. Hereafter, we named cluster 4 as SCLC‐C. The cluster 1 showed low ASCL1 and NEUROD1 expression and high POU2F3 and NOTCH2 expression (Figure 1C,D). Gene set enrichment analysis (GSEA) demonstrated that the interferon‐gamma response, interferon‐alpha response, inflammatory response and IL‐6/JAK/STAT3 signaling were enriched in SCLC‐I subtype (Figure 1F), which clearly confirmed its immune‐related characteristic. We therefore named cluster 1 as 'immune subtype (SCLC‐I)'.
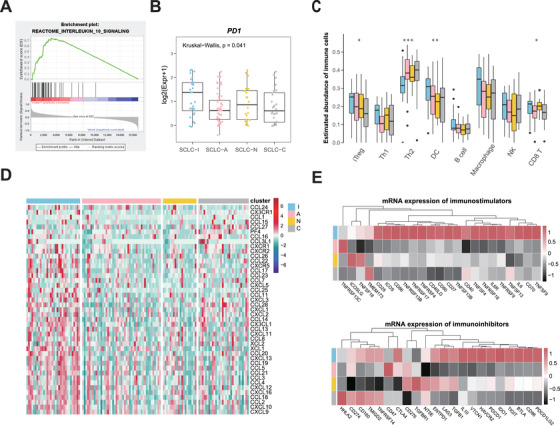
Further analysis showed that the enrichment of immune‐related pathways, such as IL‐10 signaling and other interleukin‐related pathways, in SCLC‐I versus other subtypes (Figure 2A, Figure S4B). Multiple immuno‐inhibitory factors such as PD1, IL‐10, IDO1, CD96 and BTLA, were highly expressed in SCLC‐I (Figure 2B,E, Figure S4). Immune cell infiltration is considered to be primary immune signature and strongly associated with the clinical outcome of cancer immunotherapies. 9 Using ImmuCellAI, 10 we found that the abundance of dendritic cells, macrophage, induced regulatory T cells (iTreg) and CD8+ T cells were significantly increased in SCLC‐I (Figure 2C). Moreover, we observed that most of the chemokines, such as CXCL10, CCL17, CCL18, were up‐regulated in SCLC‐I subtype (Figure 2D). Taken together, SCLC‐I subtype is featured with the activation of immune checkpoint molecules and infiltration of immune suppressive cells such as iTreg, which might help the immune escape.
FIGURE 2.

Immune signatures in the four small cell lung cancer (SCLC) subtypes. (A) Representative gene set enrichment analysis plot showing the enrichment of IL‐10 signaling pathway in SCLC‐I subtype. (B) Boxplots of PD1 expression in each cluster. (C) Relative abundance of indicated immune cell types in each cluster (calculated using the ImmuCellAI algorithm). The Kruskal‐Wallis test was conducted and annotated as follows: ***p < 0.001, **p < 0.01, *p < 0.05. (D) Heatmap of chemokines expression in each cluster. Chemokines are secreted proteins promoting immune cell infiltration and play an important role in tumour microenvironment. (E) The mean mRNA levels of immunostimulators (up) and immunoinhibitors (bottom) in each cluster. Annotated colors represent four subtypes (Skyblue = SCLC‐I, Pink = SCLC‐A, Gold = SCLC‐N, and Grey = SCLC‐C)
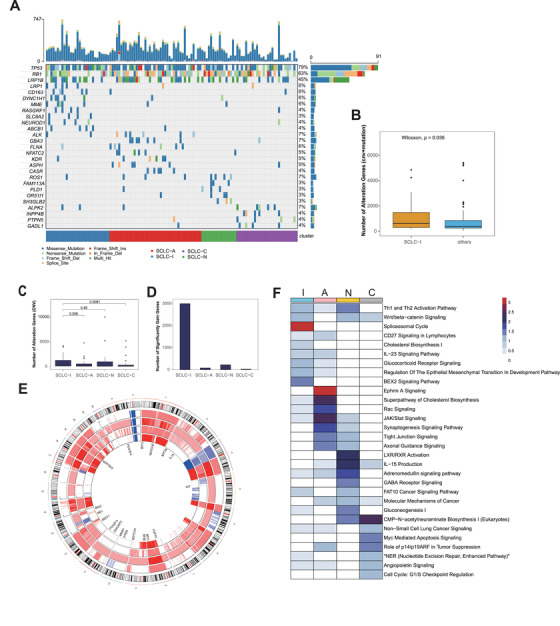
To explore the unique genetic alterations of each subtype, we performed analyses of 115 samples with available genomic sequencing data and RNA‐sequencing data. We found that each subtype harbored specific gene mutations, for example, LRP1, CD163, MME, ABCB1 mutations were frequently observed in SCLC‐I (Figure 3A). In comparison with other samples, SCLC‐I group showed significantly higher genetic alterations (Figure 3B,C), which indicated the increased genomic instability. SCLC‐I had more gene amplifications on Chr2, Chr6, Chr11, Chr12 and Chr19, whereas SCLC‐A had more gene amplifications on Chr17, SCLC‐N had more amplified genes on Chr9 and Chr21, and SCLC‐C had more amplified genes on Chr14 (Figure 3E, Table S2). Over 3000 genes were observed significantly amplified with high alteration frequency (>50%) in SCLC‐I (Figure 3D, Table S2). Further analysis showed that the cholesterol biosynthesis I pathway was significantly enriched in SCLC‐I subtype (Figure 3F). Consistent with the GSEA result using gene expression profile (Figure 1F), the WNT/beta‐catenin signaling was enriched in both SCLC‐I and SCLC‐N subtypes. Collectively, these data show that SCLC‐I subtype has higher level of genomic instability and each subtype harbors unique gene mutations and copy number variations.
FIGURE 3.

Copy number alterations and mutations in the four small cell lung cancer (SCLC) subtypes. (A) Top bar graph shows the number of nucleotide substitution mutations in each patient. Tumour samples are arranged from left to right according to different subtypes. Genes with high mutation rate or significantly mutated in each subtype (prop.test) are shown in waterfall plot. (B) Total number of gene alterations (mutations, gene amplifications and deletions) in SCLC‐I versus the rest of SCLC specimens. (C) Number of copy number alteration genes (sum of amplified and loss genes) of all clusters. (D) Number of significant gain genes (p < 0.05) with high alteration frequency (>50%) in four subtypes. (E) Correlation network analysis (CNA) heatmap across all chromosomes using median copy number in each subtype. We replace copy number as follows: −2 <= 0, −1 <= 1, 0 <= 2, 1 <= 3, 2 <= 4 and greater. From outside to inside, there are SCLC‐I, SCLC‐A, SCLC‐N and SCLC‐C. Some significant alteration genes in each subtype are highlighted in the inner ring. (F) Pathway enrichment analysis (IPA) using significant amplified genes with high genetic alteration frequency (freq > 50%, p < 0.001 for SCLC‐I, p < 0.05 for others) in each subtype. Heatmap is colored by '−log10( p ‐value)'
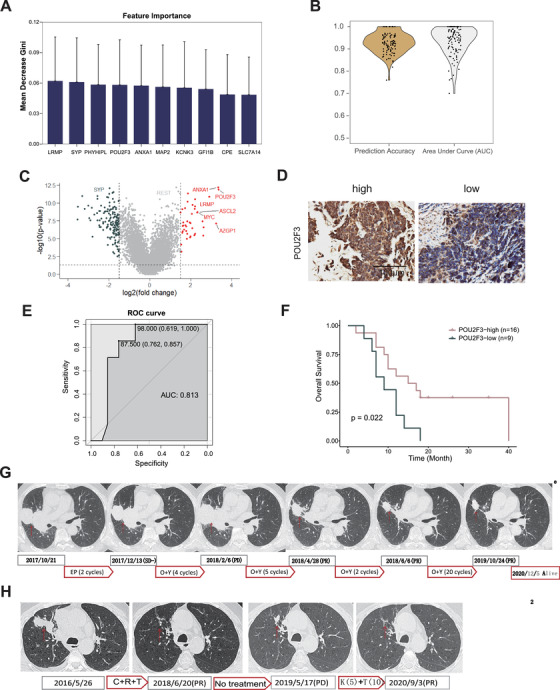
To determine whether our findings have clinical relevance, we then identified the biomarker for SCLC‐I. According to feature selection from random forest model, we found that 10 genes (POU2F3, ANXA1, LRMP, GFI1B, SLC7A14, PHYHIPL, MAP2, SYP, KCNK3 and CPE) were most important in distinguishing SCLC‐I from other subtypes (Figure 4A, SM 6 and Figure S6A). Using these genes to build random forest model on 100 sets of different testing data, we got the average prediction accuracy of 92.74% and average score of area under curve (AUC) of 93.32% (Figure 4B, Table S3). Among 10 genes used for SCLC‐I prediction, POU2F3 stood out as the most significantly up‐regulated gene with high expression (Figures 4C and 1C and Table S5). Moreover, the SCLC‐P samples identified in the previous study 6 were all included in SCLC‐I with up‐regulated immune‐related pathways (Figure S6C).
FIGURE 4.

Patients with high POU2F3 levels respond well to second‐line immunotherapy. (A) Importance of the 10 features from 100‐times random sampling trainings. We built a random forest classifier based on the transcriptomic data to predict small cell lung cancer (SCLC)‐I subtype. We firstly performed 100‐times random samplings to divide training data and testing data. We chose 1000 genes with the highest coefficient of variation from training data to build each model. Then, we obtained the gene list ranked by Gini index. We counted the top 200 genes obtained each time among the 100 results from the 100 sets of training data. Finally, we got these 10 genes appeared more than 60 times. (B) Prediction accuracy and area under curve (AUC) scores using the 10 features over 100 sets of different testing data. (C) Volcano plot showing differentially expressed genes in SCLC‐I versus the other subtypes. (D) Representative POU2F3 immunohistochemical (IHC) staining in SCLC biopsy specimens. (E) Receiver operating characteristic (ROC) curve of POU2F3 IHC staining score corresponding to diagnosis of objective response rate (ORR). (F) Overall survival curves of patients with high or low POU2F3 levels. p value was calculated by Kaplan–Meier analysis with log‐rank test. (G) Representative photos of CT image of patient sjt27 at different time points during the whole treatment. The current clinical guideline for SCLC immunotherapy is 4–6 cycles, and the medication stopped if tumour progressed. We here prolonged the duration of immunotherapy to 8–10 cycles and found the final clinical outcome was effective, although some patients had pseudo progression after 4–6 cycles treatment. EP: carboplatin/etoposide. O+Y: Opdivo+Yervoy. (H) Representative photos of CT images of patient sjt22 at different time points during the whole treatment process. C+R+T: carboplatin+radiotherapy+temozolomide. K+T: Keytruda+temozolomide
We further collected a cohort containing 28 relapsed SCLC samples from patients receiving immunotherapy or chemo‐immunotherapy (Table S4, SM 7) and performed immunohistochemical staining of POU2F3 in these specimens (Figure 4D, Table S4). Our data showed that the patients with high POU2F3 expression exhibited a significantly improved objective response rate (ORR) to immunotherapy, with a high AUC of 0.813 (Figure 4E). Moreover, the POU2F3 protein level was positively correlated with patient prognosis (Figure 4F). Importantly, two patients with high POU2F3 level showed dramatic regression of lung tumours (Figure 4G,H). The positive response to immunotherapy indicated the potentially strong immune cell infiltration in POU2F3‐high SCLC. These results together supported that the SCLC‐I patients are more sensitive to immunotherapy, and POU2F3 might serve as a biomarker for SCLC immunotherapy.
In conclusion, our work systematically uncovers the transcriptomic and genomic heterogeneity in SCLC and characterizes a novel immune subtype with high sensitivity to immunotherapy. We identified POU2F3 as a potential biomarker with a good prediction power to assess SCLC immunotherapy response. Gay et al. identifies an inflamed subtype of SCLC which shows a significant overall survival (OS) benefit relative to all other subtypes with the combined chemotherapy and immunotherapy. 7 In our study, the immune subtype seems correspond to a combination of SCLC‐P and SCLC‐I from Gay et al. cohorts. Although we used a different method and biomarkers to identify this special subtype of SCLC, both our study and Gay et al. study have proven the potential of SCLC re‐clustering in current clinical immunotherapy. Of course, the small size of the validation cohort is a limiting factor. Future clinical efforts and larger cohorts are required to validate the effectiveness of immunotherapy in this subtype.
CONFLICT OF INTEREST
The authors declare that the research was conducted in the absence of any commercial or financial relationships that could be construed as a potential conflict of interest.
Supporting information
Supporting information
TableS1
TableS2
TableS3
TableS4
TableS5
ACKNOWLEDGEMENTS
This work was supported by the National Basic Research Program of China (grant numbers: 2017YFA0505500 to Luonan Chen and Hongbin Ji and 2020YFA0803300 to Hongbin Ji), the Strategic Priority Research Program of the Chinese Academy of Sciences (grant numbers: XDB19020201 to Hongbin Ji and XDB38040400 to Luonan Chen), the National Natural Science Foundation of China (grant numbers: 31930022 and 31771476 to Luonan Chen; 82030083, 31621003, 81872312, and 82011540007 to Hongbin Ji; 81871875 to Liang Hu), Basic Frontier Scientific Research Program of Chinese Academy of Science (grant number: ZDBS‐LY‐SM006 to Hongbin Ji), International Cooperation Project of Chinese Academy of Sciences (grant number: 153D31KYSB20190035 to Hongbin Ji), Innovative research team of high‐level local universities in Shanghai (grant number: SSMU‐ZLCX20180500 to Hongbin Ji) and Science and Technology Commission of Shanghai Municipality (grant numbers: 15XD1504000 Hongbin Ji and 2017SHZDZX01 to Luonan Chen).
Yabin Chen, Zhaoyuan Fang, Ying Tang, Yujuan Jin and Chenchen Guo contributed equally to this work.
Contributor Information
Xinying Xue, Email: xuexinying2988@bjsjth.cn.
Hongbin Ji, Email: hbji@sibcb.ac.cn.
Luonan Chen, Email: lnchen@sibs.ac.cn.
REFERENCES
- 1. Govindan R, Page N, Morgensztern D, et al. Changing epidemiology of small‐cell lung cancer in the United States over the last 30 years: analysis of the surveillance, epidemiologic, and end results database. J Clin Oncol. 2006;24:4539‐4544. [DOI] [PubMed] [Google Scholar]
- 2. Horn L, Mansfield AS, Szczesna A, et al. First‐Line atezolizumab plus chemotherapy in extensive‐stage small‐cell lung cancer. N Engl J Med. 2018;379:2220‐2229. [DOI] [PubMed] [Google Scholar]
- 3. Langfelder P, Horvath S. WGCNA: an R package for weighted correlation network analysis. BMC Bioinformatics. 2008;9:559. [DOI] [PMC free article] [PubMed] [Google Scholar]
- 4. George J, Lim JS, Jang SJ, et al. Comprehensive genomic profiles of small cell lung cancer. Nature. 2015;524:47‐53. [DOI] [PMC free article] [PubMed] [Google Scholar]
- 5. Rudin CM, Durinck S, Stawiski EW, et al. Comprehensive genomic analysis identifies SOX2 as a frequently amplified gene in small‐cell lung cancer. Nat Genet. 2012;44:1111‐1116. [DOI] [PMC free article] [PubMed] [Google Scholar]
- 6. Rudin CM, Poirier JT, Byers LA, et al. Molecular subtypes of small cell lung cancer: a synthesis of human and mouse model data. Nat Rev Cancer. 2019;19:289‐297. [DOI] [PMC free article] [PubMed] [Google Scholar]
- 7. Gay CM, Stewart CA, Park EM, et al. Patterns of transcription factor programs and immune pathway activation define four major subtypes of SCLC with distinct therapeutic vulnerabilities. Cancer Cell. 2021;39:346‐360.e7. [DOI] [PMC free article] [PubMed] [Google Scholar]
- 8. Wong AP, Keating A, Waddell TK. Airway regeneration: the role of the Clara cell secretory protein and the cells that express it. Cytotherapy. 2009;11:676‐687. [DOI] [PubMed] [Google Scholar]
- 9. Pandya PH, Murray ME, Pollok KE, et al. The immune system in cancer pathogenesis: potential therapeutic approaches. J Immunol Res. 2016;2016:4273943. [DOI] [PMC free article] [PubMed] [Google Scholar]
- 10. Miao YR, Zhang Q, Lei Q, et al. ImmuCellAI: a unique method for comprehensive T‐cell subsets abundance prediction and its application in cancer immunotherapy. Adv Sci (Weinh). 2020;7:1902880. [DOI] [PMC free article] [PubMed] [Google Scholar]
Associated Data
This section collects any data citations, data availability statements, or supplementary materials included in this article.
Supplementary Materials
Supporting information
TableS1
TableS2
TableS3
TableS4
TableS5


