Abstract
We have recently generated immortalized fetal brown adipocyte cell lines from insulin receptor substrate 1 (IRS-1) knockout mice and demonstrated an impairment in insulin-induced lipid synthesis as compared to wild-type cell lines. In this study, we investigated the consequences of IRS-1 deficiency on mitogenesis in response to insulin. The lack of IRS-1 resulted in the inability of insulin-stimulated IRS-1-deficient brown adipocytes to increase DNA synthesis and enter into S/G2/M phases of the cell cycle. These cells showed a severe impairment in activating mitogen-activated protein kinase kinase (MEK1/2) and p42-p44 mitogen-activated protein kinase (MAPK) upon insulin stimulation. IRS-1-deficient cells also lacked tyrosine phosphorylation of SHC and showed no SHC–Grb-2 association in response to insulin. The mitogenic response to insulin could be partially restored by enhancing IRS-2 tyrosine phosphorylation and its association with Grb-2 by inhibition of phosphatidylinositol 3-kinase activity through a feedback mechanism. Reconstitution of IRS-1-deficient brown adipocytes with wild-type IRS-1 restored insulin-induced IRS-1 and SHC tyrosine phosphorylation and IRS-1–Grb-2, IRS-1–SHC, and SHC–Grb-2 associations, leading to the activation of MAPK and enhancement of DNA synthesis. Reconstitution of IRS-1-deficient brown adipocytes with the IRS-1 mutant Tyr895Phe, which lacks IRS-1–Grb-2 binding, restored SHC–IRS-1 association and SHC–Grb-2 association. However, the lack of IRS-1–Grb-2 association impaired MAPK activation and DNA synthesis in insulin-stimulated mutant cells. These data provide strong evidence for an essential role of IRS-1 and its direct association with Grb-2 in the insulin signaling pathway leading to MAPK activation and mitogenesis in brown adipocytes.
A complete understanding of insulin actions on cell growth and metabolism requires the identification of a complex network of signaling pathways. Insulin initiates its biological effects by binding to and activating its endogenous tyrosine kinase receptors (9, 28). These receptors are believed to transduce signals by phosphorylation on tyrosine residues of several cellular substrates, including insulin receptor substrate (IRS) proteins (IRS-1, -2, -3, and -4) (14, 15, 33, 34). These phosphorylated substrates then bind proteins containing Src homology 2 (SH2) domains, including the p85 regulatory subunit of phosphatidylinositol 3-kinase (PI 3-kinase) (2), growth factor receptor binding protein 2 (Grb-2), which links signaling via SOS to activation of the Ras complex (23), and protein tyrosine phosphatase SHP2 (12), that lead to activation of various downstream signaling pathways. However, IRS proteins display important differential sensitivities for binding these SH2 proteins (27). Another substrate for activated insulin receptors is SHC, which exists in three isoforms: p66, p52, and p46 (20). Like IRS proteins, SHC proteins are tyrosine phosphorylated upon insulin receptor activation but can only associate with Grb-2 (22, 23).
Recent studies performed in animal models by homologous recombinant gene targeting suggest that IRS proteins play important and distinctive roles in insulin and insulin-like growth factor I (IGF-I) signaling. Whereas IRS-1 has been shown to be the mayor player in IGF-I-induced mitogenesis (5), IRS-2 is more tightly linked to glucose homeostasis. In fact, in mice made deficient for IRS-1, glucose metabolism and growth are reduced by 50 to 60%, despite the fact that IRS-2 and other proteins can act as alternative substrates of the insulin receptor kinase (1, 19, 24). In contrast, IRS-2-deficient mice have a phenotype of type 2 diabetes due to insulin resistance and β-cell failure (35, 36). These phenotypes suggest that IRS-2 may play a greater role in glucose homeostasis, while IRS-1 is more important for somatic cell growth. More recently, deletion of IRS-3 did not show a discernible phenotype from that of wild-type mice (16), whereas mice lacking IRS-4 exhibited mild defects in growth, reproduction, and glucose homeostasis (6). However, the relative role of the different IRS proteins in mediating insulin action in the individual tissues is still unclear.
Several reports from our laboratories have demonstrated that fetal brown adipocytes are an excellent cell model for studying insulin action since these cells bear a high number of high-affinity insulin receptors as well as both IRS-1, IRS-2, and other insulin signaling molecules (26, 30–32). More recently, in order to dissect the insulin signaling pathways leading to the different insulin biological effects, we have developed immortalized fetal brown adipocyte cell lines from IRS-1-deficient mice (IRS-1−/−), heterozygous mice (IRS-1+/−), and wild-type mice (IRS-1+/+). IRS-1 has been shown to be an essential molecule to maintain the adipogenic phenotype, despite the fact that IRS-2 is overexpressed in IRS-1-deficient brown adipocytes (29). In the present study, we investigated the molecular mechanisms by which the lack of IRS-1 results in the inability of brown adipocytes to activate the Ras/mitogen-activated protein kinase (MAPK) pathway, DNA synthesis, and the entry of the cells in the S/G2/M phases of the cell cycle. We have been able to partly restore MAPK activation and DNA synthesis in IRS-1-deficient cells by pretreatment with PI 3-kinase inhibitors, which presumably act through a feedback mechanism. In addition, we have found that adding back IRS-1, but not the mutant Y895F, which lacks Grb-2 binding, to the IRS-1-deficient brown adipocytes can restore signaling and mitogenic function.
MATERIALS AND METHODS
Materials.
Fetal calf serum (FCS) and culture media were obtained from Gibco Inc. (Gaithersburg, Md.). Insulin, wortmannin, and anti-mouse immunoglobulin G (IgG)-agarose were from Sigma Chemical Co. (St. Louis, Mo.). Protein A-agarose was from Roche Molecular Biochemicals (Mannheim, Germany). LY294002 was from Calbiochem (Calbiochem-Novabiochem Intl, La Jolla, Calif.). The antibodies against the insulin receptor β-chain (sc-09) and Grb-2 (sc-255) were purchased from Santa Cruz (Santa Cruz Biotechnology, Palo Alto, Calif.). The polyclonal anti-IRS-1, monoclonal antiphosphotyrosine (clone 4G10), and polyclonal anti-SHC antibodies were purchased from Upstate Biotechnology (Lake Placid, N.Y.). For SHC immunoprecipitations, a polyclonal anti-SHC antibody was purchased from Transduction Laboratories Inc. (Lexington, Ky.). The anti-phospho MAPK (Thr202/Tyr204), anti-phospho MEK1/2 (Ser217/221), anti-MEK1/2, and anti-MAPK antibodies were purchased from New England Biolabs (Beverly, Mass.). [γ-32P]ATP (3,000 Ci/mmol) and [3H]thymidine (0.2 μCi/ml;1 μM) were from Amersham (Aylesbury, United Kingdom). All other reagents used were of the purest grade available.
Cell culture.
Brown adipocytes were obtained from interscapular brown adipose tissue of 17.5 to 18.5 fetuses from 2 to 3 pregnant mice of normal genotype or from a pool of tissue of fetuses obtained from 2 to 3 pregnant IRS-1+/− mice mated with IRS-1−/− males and were further submitted to collagenase dispersion as previously described (17). Then cells were infected with the puromycin-resistance retroviral vector pBabe, which encodes simian virus 40 large T antigen as described previously (29). Following infection, fetal brown adipocytes were maintained in culture medium for 72 h before selection with puromycin (1 μg/ml) for 1 week. Several IRS-1+/+, IRS-1+/−, and IRS-1−/− cell lines were cloned and expanded, and the expression of IRS-1 was assessed by Western blotting (29). Three wild-type and IRS-1−/− clones were cultured in Dulbecco modified Eagle medium (DMEM) supplemented with 10% FCS and puromycin (1 μg/ml).
Immunoprecipitations.
Quiescent cells were treated without or with several doses of insulin as indicated and lysed at 4°C in 1 ml of a solution containing 10 mM Tris-HCl, 5 mM EDTA, 50 mM NaCl, 30 mM sodium pyrophosphate, 50 mM NaF, 100 μM Na3VO4, 1% Triton X-100, and 1 mM phenylmethylsulfonyl fluoride, pH 7.6 (lysis buffer). Lysates were clarified by centrifugation at 15,000 × g for 10 min. After protein content determination, equal amounts of protein (500 to 600 μg) were immunoprecipitated at 4°C with the corresponding antibodies. The immune complexes were collected on protein A-agarose or anti-mouse IgG-agarose beads. Immunoprecipitates were washed with lysis buffer and extracted for 5 min at 95°C in 2× sodium dodecyl sulfate-polyacrylamide gel electrophoresis (SDS-PAGE) sample buffer (200 mM Tris-HCl, 6% SDS, 2 mM EDTA, 4% 2-mercaptoethanol, 10% glycerol, pH 6.8) and analyzed by SDS-PAGE.
Western blotting.
After SDS-PAGE, proteins were transferred to Immobilon membranes and were blocked using 5% nonfat dried milk or 3% bovine serum albumin (BSA) in 10 mM Tris-HCl, 150 mM NaCl, pH 7.5, and incubated overnight with several antibodies as indicated in 0.05% Tween 20, 10 mM Tris-HCl, 150 mM NaCl, pH 7.5. Immunoreactive bands were visualized using the ECL Western blotting protocol (Amersham).
Protein determination.
Protein determination was performed by the Bradford dye method (4) using Bio-Rad reagent and BSA as the standard.
DNA constructs and expression vectors.
The green fluorescent protein–wild-type IRS-1 (GFP–IRS-1wt) and green fluorescent protein–IRS-1 mutant F895 (GFP–IRS-1F895) plasmids were created by subcloning wild-type IRS-1 cDNA and IRS-1 mutant Y895F cDNA constructs in frame into the HindIII site within the pGFPC2 vector (CLONTECH, Palo Alto, Calif.). The pCMVhis IRS-1wt and pCMVhis IRS-1F895 cDNA constructs were prepared as described previously (18).
Transfections.
IRS-1-deficient brown adipocytes (clone 4) were cultured for 24 h in the presence of 10% FCS, and when 60 to 70% confluence was reached cells were transfected according to the calcium phosphate-mediated protocol with the plasmid constructs indicated for each case. For pCMVhis IRS-1wt and pCMVhis IRS-1F895 constructs, 10 μg of DNA was added to each dish. After 4 to 6 h of incubation, cells were shocked with 3 ml of 15% glycerol for 2 min, washed, and then fed with DMEM-10% FCS. Twenty-four hours after transfection, histidinol (10 mM) was added to select stable transfectants. Several histidinol-resistant cell lines were obtained, and the expression of IRS-1wt and the mutant IRS-1F895 was assessed by Western blotting.
GFP–IRS-1wt and GFP–IRS-1F895 constructs were used for transient transfection experiments. Fifteen micrograms of DNA was added to each dish, and after 4 to 6 h of incubation cells were shocked with 3 ml of 15% glycerol for 2 min, washed, and then fed with DMEM-10% FCS. After 48 h of culture under these conditions, cells were detached from the monolayer, and green fluorescent cells were purified by cell sorting in a FACStar PLUS (Becton-Dickinson, San Jose, Calif.) flow cytometer. Fluorescent cells were collected in DMEM supplemented with 20% FCS and subsequently plated back and immediately used for further experiments. GFP-positive cells were visualized using an MRC-1024 confocal microscope (Bio-Rad, Hempestead, United Kingdom).
[3H]Thymidine incorporation into DNA.
Cells were plated at 0.5 × 10⁶/dish in 6-cm dishes in DMEM with 10% FCS. After 24 h, the medium was changed to DMEM with 0.05% insulin-free BSA, and cells were further cultured for 24 h in the absence or presence of various doses of insulin. DNA synthesis was determined by [3H]thymidine incorporation (0.2 μCi/ml) over the last 4 h of culture (17). After two washes with ice-cold phosphate-buffered saline (PBS), cells were lysed in 0.1% SDS. Trichloroacetate-precipitable DNA was then counted for incorporated radioactivity. All assays were performed in triplicate and expressed in counts per minute/dish.
Analysis of cell cycle by flow cytometry.
Cells were plated at 0.5 × 10⁶/dish in 6-cm dishes in DMEM with 10% FCS. After 24 h, the medium was changed to DMEM with 0.05% insulin-free BSA and cells were further cultured for another 24 h in the absence or presence of various doses of insulin. Cells were stained with the Kinesis test from Bio-Rad. The percentage of cells in G0/G1 and S plus G2/M phases of the cell cycle were determined in a FACScan flow cytometer (Becton-Dickinson) using Modfit software (Verity Software) and a doublet discriminator to analyze single cells.
RESULTS
Brown adipocytes from IRS-1-deficient mice do not respond to insulin by increasing DNA synthesis.
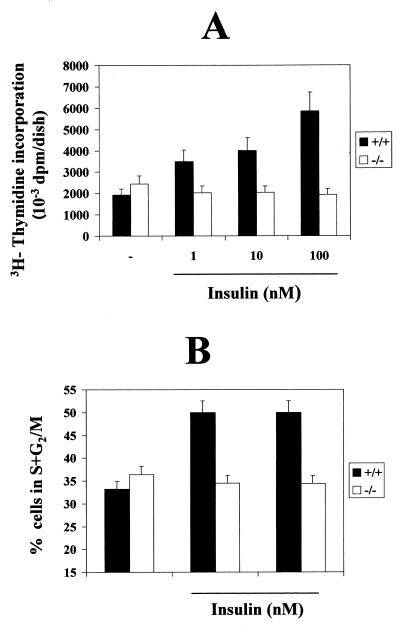
The immortalized brown adipocyte cell lines derived from the IRS-1−/− mice completely lacked IRS-1 protein expression (29), whereas the IRS-1+/+ cell lines expressed high levels of endogenous IRS-1 similar to those of primary brown fat cells (31). To analyze the effect of the IRS-1 null mutation on brown adipocyte insulin-induced cell growth, quiescent (24-h serum-starved) IRS-1−/− and control (IRS-1+/+) cells were cultured in a serum-free medium in the absence or presence of various doses of insulin (1, 10, and 100 nM) for 24 h. DNA synthesis was measured in both cell lines by [3H]thymidine incorporation during the last 4 h of culture. Although immortalized fetal brown adipocytes showed an intrinsic mitogenic competence in the absence of insulin as described previously for primary cells (17), IRS-1+/+ cells showed markedly increased (threefold) DNA synthesis in the presence of insulin, the maximal effect being elicited at 100 nM (Fig. 1A). The basal rate of DNA synthesis in the IRS-1−/− brown adipocytes was similar to that in the wild type. However, these cells did not respond to insulin by increasing DNA synthesis. The lack of effect of insulin-induced mitogenesis in IRS-1-deficient brown adipocytes was also assessed by measuring the percentage of cells in S plus G2/M phases of the cell cycle, either in the absence or in the presence of insulin. As shown in Fig. 1B, the presence of insulin (10 to 100 nM) for 24 h significantly increased the percentage of IRS-1+/+ cells in S plus G2/M phases of the cell cycle compared to nontreated cells. However, no insulin effect in the distribution of the cells along the phases of the cell cycle was observed in IRS-1−/− brown adipocytes.
FIG. 1.
Mitogenic response to insulin in wild-type and IRS-1-deficient brown adipocytes. (A) Three clones of wild-type (+/+) and IRS-1-deficient (−/−) immortalized brown adipocytes were cultured for 24 h in serum-free medium either in the absence or presence of insulin (1, 10, and 100 nM). DNA synthesis was determined by [3H]thymidine incorporation (0.2 μCi/ml) over the last 4 h of culture. After two washes with ice-cold PBS, cells were lysed and trichloroacetate-precipitable DNA was then counted for incorporated radioactivity. Results are expressed as disintegrations per minute (dpm) per dish and are means ± standard errors from six independent experiments, each one performed in triplicate. (B) Cells were cultured for 24 h either in the absence or presence of various doses of insulin as described for panel A. At the end of the culture time, the percentage of cells in S plus G2/M phases of the cell cycle was determined as described in Materials and Methods. Results are means ± standard errors from six independent experiments.
IRS-1−/− brown adipocytes failed to activate MEK1/2 and p42-p44 MAPK in response to insulin.
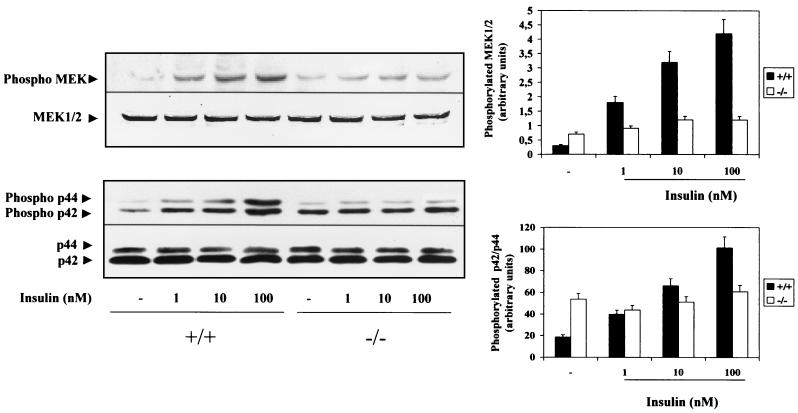
Activation of the Ras-MAPK signaling cascade has been shown to be an essential requirement for insulin–IGF-I-induced brown adipocyte mitogenic responses (21). To assess the impact of the lack of IRS-1 expression on this pathway, we determined insulin-induced MEK1/2 and p42-p44 MAPK activation in IRS-1+/+ and IRS-1−/− brown adipocytes. Quiescent (20-h serum-starved) IRS-1+/+ and IRS-1−/− cell lines were stimulated with insulin (1 to 100 nM) for 5 min. Then cells were lysed and equals amount of protein were submitted to SDS-PAGE followed by Western blotting with anti-phospho MEK1/2 and anti-phospho p42-p44 MAPK antibodies. Insulin induced both MEK1/2 and MAPK phosphorylation in a dose-dependent manner in wild-type brown adipocytes (Fig. 2). In contrast, no insulin effect was observed in IRS-1−/− brown adipocytes, although basal phosphorylation of both kinases was higher than that observed in wild-type cells. Furthermore, total MEK1/2 and MAPK content remained unchanged in all the cell lines, indicating that IRS-1 mediates insulin-induced MAPK activation in brown adipocytes.
FIG. 2.
Insulin did not activate MAPK cascade in IRS-1-deficient brown adipocytes. Quiescent (20-h serum-starved) wild-type (+/+) and IRS-1-deficient (−/−) brown adipocytes were stimulated with insulin (1 to 100 nM) for 5 min. Control cells were cultured in the absence of the hormone. Cells were then lysed and equal amounts of protein (50 μg) were submitted to SDS-PAGE followed by Western blot analysis with the anti-phospho MEK1/2, anti-MEK1/2, anti-phospho MAPK, and anti-MAPK antibodies. The positions of phosphorylated MEK1/2 and p42-p44 MAPK are indicated by arrowheads. Results from a representative experiment are shown. The autoradiograms corresponding to five independent experiments, using two clones of each cell type, were quantitated by scanning densitometry. Results are expressed as arbitrary units of phosphorylated MEK1/2 and phosphorylated p42-p44 MAPK and are means ± standard errors.
Insulin-induced tyrosine phosphorylation of SHC and its association with Grb-2 is severely impaired in IRS-1-deficient brown adipocytes.
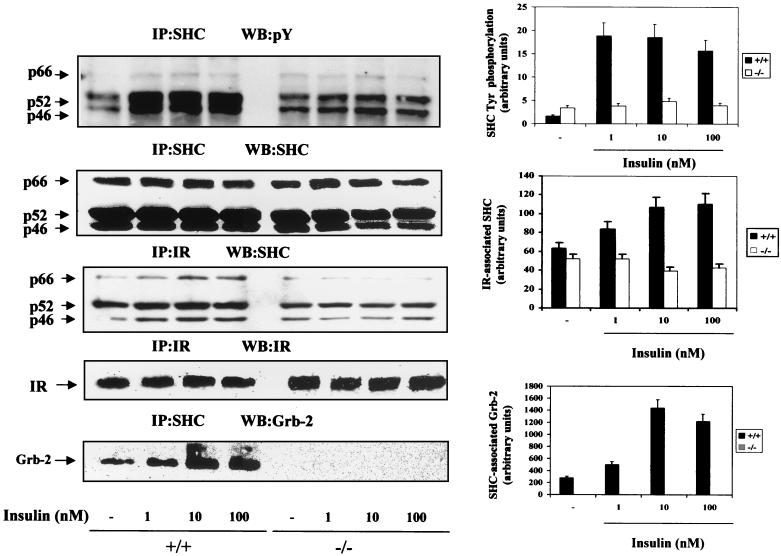
SHC is another insulin receptor substrate implicated in the activation of the Ras-MAPK signaling pathway via association with the adapter protein Grb-2 (22, 23). The fact that insulin-induced MAPK activation is abolished in IRS-1-deficient brown adipocytes prompted us to investigate the role of SHC signaling in these cells. When quiescent IRS-1+/+ brown adipocytes were cultured in serum-free medium for 20 h, there was a significant tyrosine phosphorylation of p52 and p46 SHC proteins in the basal state (Fig. 3). In these cells, insulin (1 to 100 nM) stimulation for 5 min resulted in a marked increase in SHC tyrosine phosphorylation as compared to the controls. IRS-1-deficient cells showed basal tyrosine phosphorylation of SHC higher than that observed in wild-type brown adipocytes, but these cells did not further increase SHC phosphorylation in response to insulin. However, the total amount of SHC proteins remained unchanged in all cell lines. We also observed a lack of effect of insulin in IRS-1−/− cells when the anti-insulin receptor β-chain immunoprecipitates were analyzed by Western blotting with anti-SHC antibody, the amount of insulin receptor β-chain being unchanged in all cell lines. Immunoprecipitation with anti-SHC antibody followed by anti-Grb-2 Western blotting revealed a marked increase in SHC–Grb-2 association upon insulin stimulation of wild-type brown adipocytes; maximal effect was elicited at a 10 nM insulin concentration. However, IRS-1-deficient brown adipocytes lacked SHC–Grb-2 association in response to insulin. These data suggest that in IRS-1-deficient brown adipocytes SHC cannot compensate for the loss of IRS-1-mediated signaling through Grb-2.
FIG. 3.
Insulin effect on SHC tyrosine phosphorylation and its association with an insulin receptor and Grb-2 in wild-type and IRS-1-deficient brown adipocytes. Quiescent (20-h serum-starved) wild-type (+/+) and IRS-1-deficient (−/−) brown adipocytes were stimulated with insulin (1 to 100 nM) for 5 min. Control cells were cultured in the absence of the hormone. At the end of the culture time, cells were lysed and 600 μg of total protein was immunoprecipitated (IP) with anti-SHC or anti-insulin receptor (IR) antibodies. The resulting immune complexes were analyzed by Western blotting (WB) with anti-Tyr(P), anti-SHC, anti-IR, and anti-Grb-2 antibodies as indicated in each panel. The positions of p66, p52, and p46 SHC proteins and IR β-chain and Grb-2 are indicated by arrows. The results shown are representative of three experiments, which used two clones of each cell type. The corresponding autoradiograms were quantitated by scanning densitometry. Results are expressed as arbitrary units of SHC tyrosine phosphorylation, IR-associated SHC, or SHC-associated Grb-2 and are means ± standard errors.
IRS-1 coimmunoprecipitates with SHC in wild-type brown adipocytes.
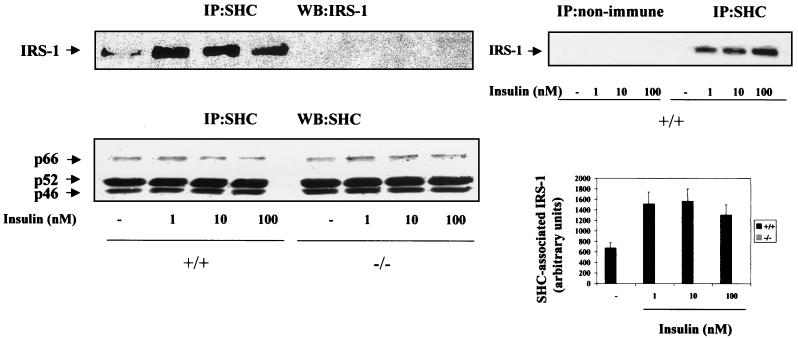
The loss of insulin-induced SHC tyrosine phosphorylation and its subsequent association with Grb-2 in brown adipocytes lacking IRS-1 suggested the possibility of the formation of a signaling complex including SHC and IRS-1 in wild-type brown adipocytes. Western blot analysis of cell lysates from wild-type cells following insulin (1 to 100 nM) stimulation revealed the presence of IRS-1 in anti-SHC immunoprecipitates (Fig. 4). Indeed, IRS-1–SHC coimmunoprecipitation was not observed when the cell lysates were incubated with anti-mouse IgGs as a nonimmune control (Fig. 4, upper right panel). Interestingly, phosphorylated IRS-2 does not coimmunoprecipitate with SHC either in wild-type or IRS-1-deficient brown adipocytes (results not shown).
FIG. 4.
IRS-1 coimmunoprecipitates with SHC in wild-type brown adipocytes. Quiescent (20-h serum-starved) wild-type (+/+) and IRS-1-deficient (−/−) brown adipocytes were stimulated with insulin (1 to 100 nM) for 5 min. Control cells were cultured in the absence of the hormone. At the end of the culture time, cells were lysed and 600 μg of total protein was immunoprecipitated (IP) with the anti-SHC monoclonal antibody. The resulting immune complexes were analyzed by Western blotting (WB) with polyclonal anti-IRS-1 and anti-SHC antibodies. The positions of IRS-1 and p66, p52, and p46 SHC proteins are indicated by arrowheads. The results shown are representative of three experiments, which used two different clones of IRS-1+/+ cells. The corresponding autoradiograms were quantitated by scanning densitometry. Results are expressed as arbitrary units of SHC-associated IRS-1 and are means ± standard errors (bottom right panel). As a nonimmune control, cell lysates from untreated and insulin-stimulated wild-type brown adipocytes were incubated with anti-SHC antibody or anti-mouse IgGs and were analyzed by Western blotting with the anti-IRS-1 antibody (upper right panel).
PI 3-kinase inhibitors enhanced IRS-2–Grb-2 association and partially restored insulin-induced mitogenesis in IRS-1-deficient cells.
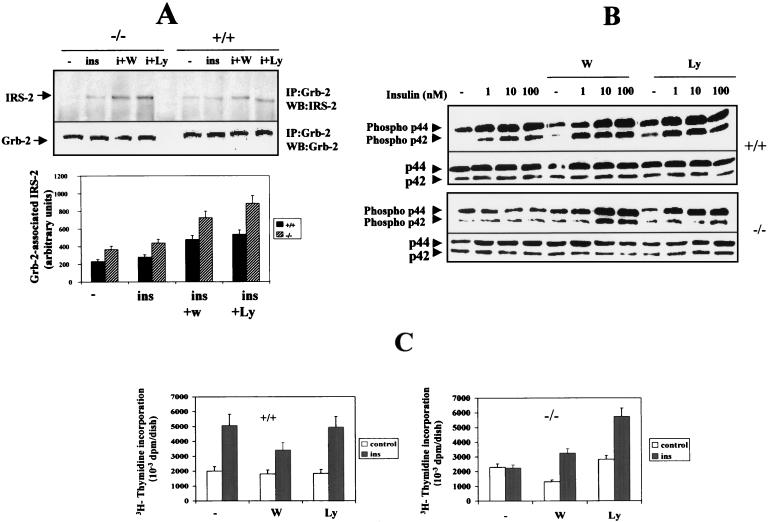
Previous studies in our laboratory have demonstrated that, despite the fact that brown adipocytes express IRS-2, its association with Grb-2 is virtually absent in primary brown adipocytes (31). In addition, insulin-induced IRS-1 and IRS-2 tyrosine phosphorylation can be enhanced by pretreatment of these cells with PI 3-kinase inhibitors as a result of a reduction of the serine/threonine phosphorylation state of both IRS-1 and IRS-2 (30). Since IRS-1−/− brown adipocytes overexpress IRS-2, we addressed the possibility of restoring insulin-induced mitogenesis in these cells by enhancing IRS-2 tyrosine phosphorylation and subsequently its association with Grb-2. To test this, quiescent IRS-1+/+ and IRS-1−/− cells were pretreated for 45 min with either 40 nM wortmannin or 5 μM LY294002 and were stimulated with 10 nM insulin for a further 5 min. Cells were then lysed, and equal amounts of protein were immunoprecipitated with the anti-Grb-2 antibody and submitted to Western blot analysis with anti-IRS-2 antibody. As shown in Fig. 5A, the presence of IRS-2 in anti-Grb-2 immunoprecipitates upon insulin stimulation was very low in both wild-type and IRS-1−/− cell lines. However, pretreatment with PI 3-kinase inhibitors increased IRS-2–Grb-2 association twofold in wild-type brown adipocytes and threefold in IRS-1-deficient cells, the expression of Grb-2 being unchanged in both cell lines.
FIG. 5.
PI 3-kinase inhibitors increased insulin-induced Grb-2-associated IRS-2 and the mitogenic response in IRS-1-deficient brown adipocytes. (A) Quiescent IRS-1+/+ (+/+) and IRS-1−/− (−/−) brown adipocytes were pretreated for 45 min with either 40 nM wortmannin (W) or 5 μM LY294002 (Ly) and then stimulated with 10 nM insulin (ins; also designated i) for a further 5 min. Cells were lysed and immunoprecipitated (IP) with the anti-Grb-2 antibody and analyzed by Western blotting (WB) with anti-IRS-2 or anti-Grb-2 antibodies. Results from a representative experiment are shown. The autoradiograms corresponding to three independent experiments, which used two different clones of each cell type, were quantitated by scanning densitometry. Results are expressed as arbitrary units of Grb-2-associated IRS-2 and are means ± standard errors. (B) Cells were preincubated with 40 nM wortmannin (W) or 5 μM LY294002 (Ly) as described for panel A. Then cells were further stimulated for 5 min with various doses of insulin and were lysed. Equal amounts of protein (30 to 50 μg) were submitted to Western blot analysis with anti-phospho p42-p44 MAPK and anti-MAPK antibodies. Results from a representative experiment of three experiments are shown. (C) Quiescent wild-type and IRS-1−/− brown adipocytes were cultured for 24 h with 100 nM insulin in both the absence and presence of either 40 nM wortmannin or 5 μM LY294002. [3H]thymidine incorporation into acid-insoluble material was determined during the last 4 h of culture. Results are expressed as disintegrations per minute (dpm) per dish and are means ± standard errors from six independent experiments, which used three different clones of each cell type.
We further analyzed whether the enhanced IRS-2–Grb-2 association in IRS-1-deficient cells by PI 3-kinase inhibitors had a positive effect on insulin-induced MAPK activation and subsequent proliferation of these cells. Fig. 5B shows an anti-phospho p42-p44 MAPK Western blot of wild-type and IRS-1−/− brown adipocytes which had been pretreated with 5 μM LY294002 or 40 nM wortmannin for 45 min and stimulated with various doses of insulin (1 to 100 nM) for a further 5 min. Whereas no insulin effect on MAPK activation was observed in IRS-1-deficient brown adipocytes, these cells recovered MAPK activation in response to insulin after pretreatment with PI 3-kinase inhibitors, the activation of p42-p44 MAPK being substantially recovered under these experimental conditions (Fig. 5B). The effect of PI 3-kinase inhibitors on insulin-induced DNA synthesis in wild-type and IRS-1-deficient brown adipocytes is shown in Fig. 5C. Treatment of IRS-1−/− cells with 40 nM wortmannin or 5 μM LY294002 together with 100 nM insulin for 24 h also resulted in a marked increase in [3H]thymidine incorporation as compared with control cells cultured in the absence of the hormone. As shown in Fig. 1 and 5C, in the absence of pretreatment with wortmannin or the LY compound IRS-1−/− cells did not respond to insulin in increasing DNA synthesis.
Reconstitution of IRS-1 expression in IRS-1-deficient cells.
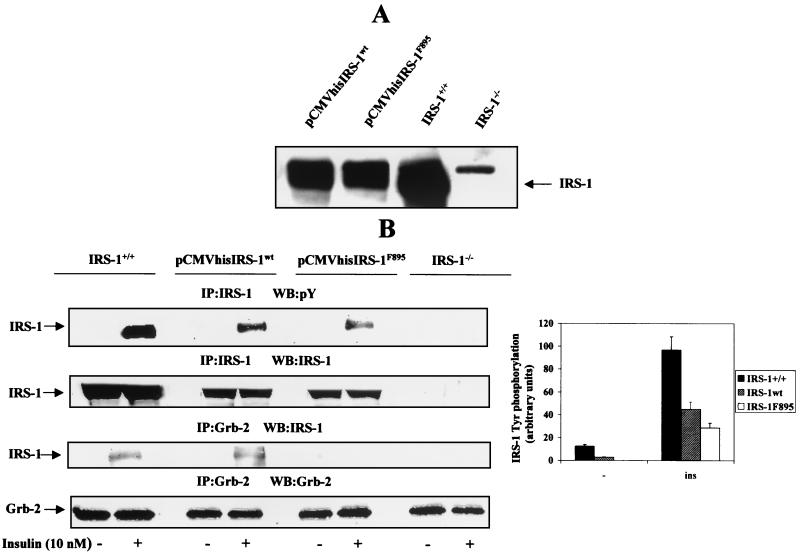
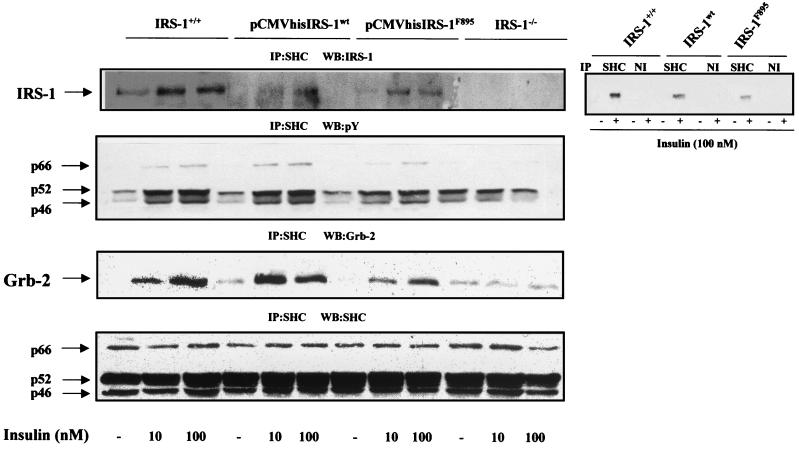
To investigate whether the loss of IRS-1 expression is responsible for the lack of insulin-stimulated cell growth, we reconstituted IRS-1 expression in IRS-1-deficient brown adipocytes. These cells were transfected with the pCMVhis vector containing the cDNA for IRS-1wt, and stable transfected cell lines were selected in 10 mM histidinol-containing medium. In parallel, we transfected a pCMVhis IRS-1F895 mutant, in which the tyrosine in position 895 (which has been shown to be responsible for Grb-2 association) was replaced by phenylalanine (18), and histidinol-resistant cell lines were selected for further experiments. Figure 6A shows that IRS-1wt and IRS-1F895 expression in the reconstituted cell lines represents about 50 to 60% and 40%, respectively, of that seen in wild-type cells. Next, we tested if exogenously expressed IRS-1wt and IRS-1F895 were functional by their tyrosine phosphorylation response to insulin stimulation. Quiescent cells were serum-starved for 20 h and then stimulated with 10 nM insulin for a further 5 min. Cell lysates were immunoprecipitated with the anti-IRS-1 antibody and analyzed by Western blotting with the anti-Tyr(P) antibody. Both overexpressed IRS-1wt and IRS-1F895 underwent tyrosine phosphorylation in response to insulin. In these cells, the levels of tyrosine phosphorylation of both IRS-1wt and IRS-1F895 in response to insulin paralleled those seen in protein expression (Fig. 6B). In addition, anti-IRS-1 Western blotting of anti-Grb-2 immunoprecipitates revealed that, whereas reconstituted IRS-1wt associated with Grb-2 after insulin stimulation, no association with Grb-2 was found in the insulin-stimulated IRS-1F895 cell line. By contrast, both IRS-1wt and IRS-1F895 could be detected in anti-SHC immunoprecipitates, indicating that the mutation Y895F in IRS-1 did not impair its coimmunoprecipitation with SHC upon insulin stimulation (Fig. 7). However, IRS-1–SHC coimmunoprecipitation was not observed when the cell lysates were incubated with anti-mouse IgGs as a nonimmune control (upper right panel, Fig. 7). Furthermore, tyrosine phosphorylation of SHC and its association with Grb-2 in response to insulin stimulation, which were absent in IRS-1−/− cells, were recovered up to levels parallel to those seen in protein expression after adding back either IRS-1wt or IRS-1F895.
FIG. 6.
Reconstitution of IRS-1 expression in IRS-1-deficient brown adipocytes. (A) IRS-1-deficient brown adipocytes (clone 4) were cultured in the presence of 10% FCS until 60 to 70% confluence was reached. Then cells were transfected with pCMVhis IRS-1wt and pCMVhis IRS-1F895 cDNA constructs according to the calcium phosphate-mediated protocol. Twenty-four hours after transfection, histidinol (10 mM) was added to select stable transfectants. Several histidinol-resistant cell lines were obtained, and the expression of IRS-1wt and the mutant IRS-1F895 was assessed by Western blot analysis with anti-IRS-1 antibody. (B) Quiescent cells were stimulated with 10 nM insulin for 5 min, and total cell lysates were immunoprecipitated (IP) with anti-IRS-1 or anti-Grb-2 antibodies. The resulting immune complexes were analyzed by Western blotting (WB) with anti-Tyr(P), anti-IRS-1, and anti-Grb-2 antibodies as indicated for each panel. The positions of IRS-1 and Grb-2 are indicated. A representative experiment is shown. The autoradiograms corresponding to three independent experiments, which used two clones of reconstituted cells, were quantitated by scanning densitometry. Results are expressed as arbitrary units of tyrosine phosphorylated IRS-1 and are means ± standard errors.
FIG. 7.
Reconstitution of IRS-1wt or IRS-1F895 restored IRS-1–SHC coimmunoprecipitation and SHC signaling. Quiescent cells (IRS-1+/+, IRS-1−/−, and pCMVhis IRS-1wt and pCMVhis IRS-1F895 transfectants) were stimulated with insulin (10 to 100 nM) for 5 min. Control cells were cultured in the absence of hormone. Total cell lysates were immunoprecipitated (IP) with anti-SHC antibody and were subsequently analyzed by Western blotting with anti-IRS-1, anti-Tyr(P), anti-Grb-2, and anti-SHC antibodies as indicated on each panel. The results shown are representative of 4 to 5 experiments, which used two clones of reconstituted cells. As a nonimmune control, cell lysates from untreated and insulin (100 nM)-stimulated wild-type, pCMVhis IRS-1wt, and pCMVhis IRS-1F895 brown adipocytes were incubated with anti-SHC antibody or anti-mouse IgGs and analyzed by Western blotting with the anti-IRS-1 antibody (right panel).
Reconstitution of IRS-1–Ras–MAPK signaling cascade and mitogenesis in IRS-1-deficient cells.
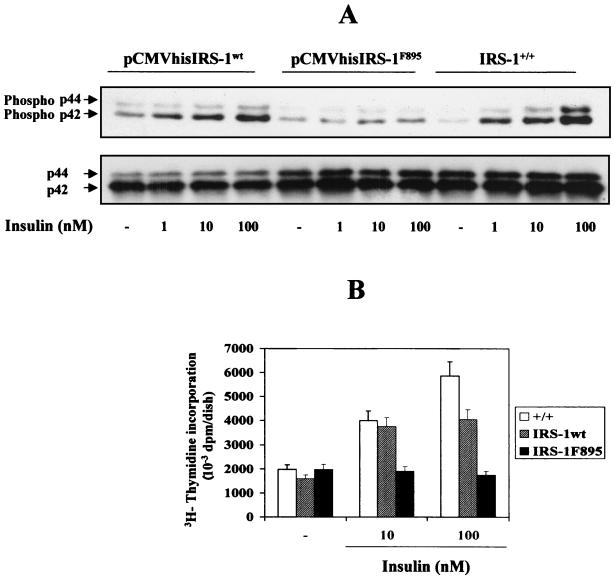
Finally, we determined whether the IRS-1–Ras–MAPK signaling cascade and the mitogenesis induced by insulin in brown adipocytes were recovered in these stable transfectants. As shown in Fig. 8, insulin induced MAPK phosphorylation in a dose-dependent manner in IRS-1+/+ brown adipocytes and IRS-1wt-reconstituted brown adipocytes. In contrast, no insulin effect was observed in cells transfected with the mutant IRS-1F895. These results suggest that in brown adipocytes the IRS-1–Grb2 association mediates insulin-induced MAPK activation rather than having some compensatory effect via the SHC signaling pathway. In parallel, the mitogenic effect of insulin as determined by [3H]thymidine incorporation was recovered when IRS-1wt, but not IRS-1F895, was expressed in IRS-1-deficient cells.
FIG. 8.
Reconstitution of IRS-1wt, but not IRS-1F895, restores MAPK activation and mitogenesis in brown adipocytes. (A) Quiescent cells (IRS-1+/+ and pCMVhis IRS-1wt and pCMVhis IRS-1F895 stable transfectants) were stimulated with various doses of insulin for 5 min, and total protein was submitted to Western blot analysis with anti-phospho MAPK and anti-MAPK antibodies. Results from a representative experiment out of three, which used two clones of reconstituted cells, are shown. (B) Cells were cultured for 24 h in a serum-free medium either in the absence or presence of insulin (10 to 100 nM). DNA synthesis was determined by [3H]thymidine incorporation (0.2 μCi/ml) over the last 4 h of culture. Results are expressed as disintegrations per minute (dpm) per dish and are means ± standard errors from six independent experiments, each one performed in triplicate. +/+, IRS-1+/+.
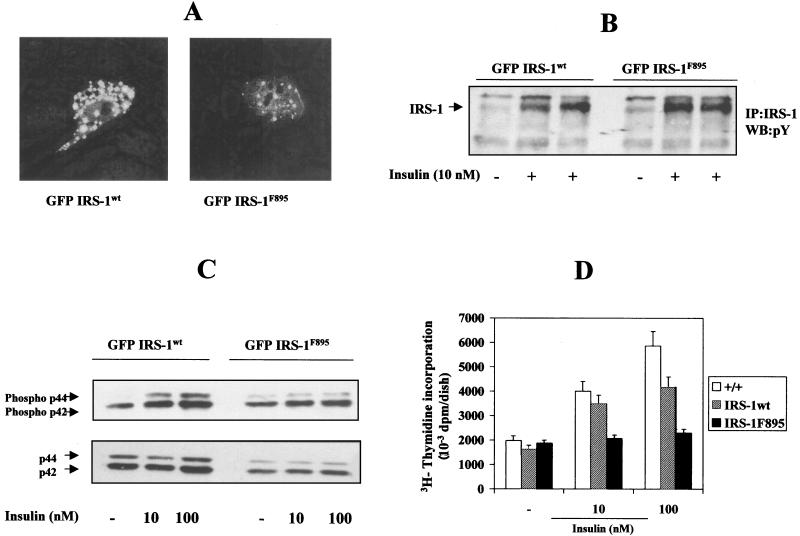
The role of IRS-1 in insulin-induced MAPK activation and mitogenesis was confirmed by transient transfection of IRS-1-deficient brown adipocytes with IRS-1wt and IRS-1F895 subcloned in the pGFPC2 vector. After transfection, positive cells could be visualized by confocal microscopy due to their green fluorescence (Fig. 9A) and could be separated by cell sorting to be used for further experiments. These transfectants showed significant tyrosine phosphorylation levels of both IRS-1wt and IRS-1F895 upon insulin stimulation, as shown in the anti-Tyr(P) Western blot analysis of anti-IRS-1 immunoprecipitates (Fig. 9B). In addition, MAPK phosphorylation in response to insulin was recovered when IRS-1wt, but not IRS-1F895, was transiently added back to IRS-1-deficient cells (Fig. 9C). Likewise, the mitogenic effect of insulin was recovered in IRS-1wt-transfected cells but not in IRS-1F895 transfectants (Fig. 9D).
FIG. 9.
Reconstitution of insulin-induced mitogenesis by transient transfection with GFP–IRS-1wt, but not with GFP–IRS-1F895, construct. (A) IRS-1-deficient brown adipocytes were transfected with the GFP–IRS-1wt and GFP–IRS-1F895 cDNA constructs as described in Materials and Methods. A representative image of fluorescent cells is shown. (B) Quiescent cells were stimulated with 10 nM insulin for 5 min, and total cell lysates were immunoprecipitated (IP) with anti-IRS-1 antibody. The resulting immune complexes were analyzed by Western blotting (WB) with the anti-Tyr(P) antibody. The position of IRS-1 is indicated. A representative experiment is shown. (C) Quiescent cells (IRS-1+/+ and pGFPIRS-1wt and pGFPIRS-1F895 transfectants) were stimulated with insulin (10 and 100 nM) for 5 min, and total cell lysates were submitted to Western blot analysis with the anti-phospho MAPK and anti-MAPK antibodies. A representative autoradiogram is shown. (D) Cells were cultured for 24 h in a serum-free medium either in the absence or presence of insulin (10 to 100 nM). DNA synthesis was determined by [3H]thymidine incorporation (0.2 μCi/ml) over the last 4 h of culture. After two washes with ice-cold PBS, cells were lysed and trichloroacetate-precipitable DNA was then counted for incorporated radioactivity. Results are expressed as disintegrations per minute (dpm) per dish and are means ± standard errors from six independent experiments, each one performed in triplicate. +/+, IRS-1+/+.
DISCUSSION
A complete understanding of insulin action requires the identification of the intracellular pathways that regulate insulin-stimulated growth, development, and metabolism. In this regard, during the last years several laboratories have provided considerable characterization of the role of docking proteins, such as IRS proteins and SHC, that interact with the insulin receptor and mediate intracellular signals in the insulin action cascade. Moreover, a variety of recent studies have demonstrated that animal models lacking IRS-1 or IRS-2 produced by targeted gene mutation can be very useful to study the specific role of each docking protein in the complex insulin signaling network. Accordingly, our laboratory addressed this issue by generating immortalized fetal brown adipocyte cell lines from IRS-1 knockout mice. Although these cells maintained the phenotypic features of brown adipocytes under growing conditions (10% FCS) and also overexpressed IRS-2, they lack the insulin effect on increasing cytosolic lipid content (29) and fail to undergo normal adipocyte differentiation (M. Fasshauer and C. R. Kahn, personal communication). In addition, insulin-stimulated IRS-1-deficient cells failed to activate protein kinase B (Akt or PKB), indicating that the IRS-1–PI 3-kinase–Akt signaling pathway is a requirement for insulin-induced lipid synthesis in brown adipocytes (29).
The facts that IRS-1-deficient mice display intrauterine growth retardation (1, 24) and that IGF-I–insulin is a complete mitogen in primary cultures of rat brown adipocytes (17, 21) prompted us to investigate whether IRS-1 is the major docking protein leading the mitogenic signaling cascade in fetal brown adipocytes. Accordingly, in this study we found that whereas brown adipocytes from wild-type mice respond to physiological doses of insulin by increasing DNA synthesis, the growth response of IRS-1-deficient cells to this hormone is severely impaired as a result of a failure to enter S/G2/M phases of the cell cycle, indicating that the lack of IRS-1 impairs the mitogenic effect of insulin in brown adipocytes.
Activation of p42-p44 MAPK by the upstream kinase MEK1/2 has been shown to be an essential requirement in the molecular mechanisms by which insulin induces the proliferation of brown adipocytes (21). However, the role of IRS-1 in MAPK activation may differ from tissue to tissue. Thus, muscles from IRS-1-deficient mice showed an impairment in insulin-induced MAPK activation, while in the liver this response was unaltered (37). Furthermore, 3T3 fibroblasts lacking IRS-1 lost their mitogenic response to IGF-I. However, those cells increased MAPK activity in response to IGF-I but not to PI 3-kinase activity, suggesting that signaling through PI 3-kinase rather than through MAPK is required for proliferation in fibroblasts (5). The results presented here indicate that in brown adipocytes, insulin stimulates MAPK in an IRS-1-dependent manner and that the overexpression of IRS-2 fails to rescue insulin-stimulated entry into S, G2, and M phases of the cell cycle. Importantly, in our model of IRS-1-deficient cells, insulin-induced SHC tyrosine phosphorylation is also impaired, while SHC expression remains unchanged. Indeed, a direct interaction between phosphorylated IRS-1 and SHC using the yeast two-hybrid system has been described previously (10). In intact cells, however, we cannot exclude the possibility that another protein, such as the insulin receptor and/or a different insulin receptor substrate, could mediate the interaction between IRS-1 and SHC. In addition, reconstituted 32D-insulin receptor cells show insulin-induced SHC phosphorylation and MAPK activation (7). However, those cells constitutively lack the expression of essential players in the insulin action, such as IRS-1 and IRS-2, missing the complexity of the insulin signaling machinery observed in physiological insulin target cells, such as brown adipocytes. Taken together, our results indicate that phosphorylation of IRS-1 upon insulin stimulation is a crucial event for MAPK activation and proliferation in brown adipocytes.
One mechanism by which IRS tyrosine phosphorylation is regulated involves serine/threonine phosphorylation. Previous studies have reported that serine/threonine phosphorylation of IRS-1 induced by okadaic acid or tumor necrosis factor alpha results in decreased tyrosine phosphorylation of IRS-1 and insulin resistance (8, 25). Likewise, PI 3-kinase appears to be a key regulator of IRS-1 and IRS-2 phosphorylation and signaling by promoting serine/threonine phosphorylation in a negative feedback loop (11, 13), this effect being abolished by inhibitors of this enzyme. Furthermore, although IRS-2 is highly expressed in primary brown adipocytes and brown adipocyte cell lines (29, 31), its binding with Grb-2 is virtually undetectable, as has also been reported for 32D reconstituted cells (27). Thus, we attempted to restore the mitogenic response in IRS-1-deficient cells by enhancing IRS-2 tyrosine phosphorylation and its signaling through the Ras-MAPK pathway. Pretreatment of IRS-1-deficient brown adipocytes with either wortmannin or LY294002 before insulin stimulation significantly enhanced IRS-2–Grb-2 association and partly restored the activation of p42-p44 MAPK in response to insulin. As it has been previously demonstrated that MAPK activation is required for insulin-induced brown adipocyte proliferation (21), the recovery of phosphorylated MAPK upon insulin stimulation in the presence of two unrelated PI 3-kinase inhibitors also increased DNA synthesis in IRS-1-deficient cells. Consequently, despite the fact that IRS-2 is endogenously overexpressed in IRS-1-deficient cells, this protein does not compensate for the lack of IRS-1 in inducing mitogenesis, unless its tyrosine phosphorylation is enhanced through a feedback mechanism via inhibition of PI 3-kinase.
Finally, if the loss of IRS-1 expression is responsible for the observed reduction in insulin-stimulated growth, then reconstitution of IRS-1 expression would be predicted to correct most, if not all, of these signaling effects. For this goal, we transfected IRS-1−/− cells with the pCMVhis IRS-1wt construct and generated stable cell lines. This method allowed us to recover 40 to 60% of the IRS-1 expression seen in wild-type cells. In parallel, we generated stable transfectants expressing pCMVhis IRS-1F895, a mutant lacking Grb-2 binding (18). The fact that both transfectants exhibited tyrosine phosphorylation of IRS-1 but only IRS-1wt associated Grb-2 in response to insulin allowed us to compare the IRS-1–Ras–MAPK signaling cascades in both IRS-1 reconstituted brown adipocyte cell lines.
The reintroduction of both IRS-1wt and IRS-1F895 restored both SHC tyrosine phosphorylation and IRS-1–SHC association upon insulin stimulation, virtually lost in IRS-1-deficient brown adipocytes. Interestingly, a downstream event, such as SHC–Grb-2 association, was also recovered accordingly in both transfectants with the amount of IRS-1 protein content found in reconstituted cells. More importantly, insulin induced MAPK phosphorylation and DNA synthesis in IRS-1wt-reconstituted cells. However, none of these events could be recovered when the mutant IRS-1F895 was added back to the cells, indicating that the contribution of SHC signaling to the Grb-2–Ras–MAPK pathway in these cells is not sufficient to induce mitogenesis in the absence of IRS-1–Grb-2 signaling. These results were confirmed in cells transiently expressing these proteins and selected by fluorescence-activating cell sorting. A possible explanation to account for these data may arise from the possible location of SHC and IRS-1 in different cell compartments recruiting distinct Grb-2–SOS pools, the IRS-1–Grb-2–SOS one being indispensable to achieve Ras-MAPK activation and mitogenesis.
In conclusion, our data demonstrate that the lack of IRS-1 causes an impairment of insulin to stimulate MAPK and mitogenesis in brown adipocytes. This impairment is partly overcome by inhibition of PI 3-kinase and is concurrent with an enhancement of IRS-2–Grb-2 association. The reconstitution of IRS-1-deficient brown adipocytes by wild-type IRS-1 but not by the Y895F IRS-1 mutant completely restores MAPK activation and mitogenesis in response to insulin, indicating that IRS-1–Grb-2 association but not SHC–Grb-2 association is an essential requirement in mediating insulin signaling leading to MAPK activation and mitogenesis in brown adipocytes.
ACKNOWLEDGMENTS
This work was supported by grant PM97-0050 from the Ministerio de Educación y Cultura, Spain.
We also recognize the valuable technical skill of M. López.
REFERENCES
- 1.Araki E, Lipes M A, Patti M E, Brüning J C, Haag III B L, Johnson R S, Kahn C R. Alternative pathway of insulin signalling in mice made with targeted disruption of the IRS-1 gene. Nature. 1994;372:186–190. doi: 10.1038/372186a0. [DOI] [PubMed] [Google Scholar]
- 2.Backer J M, Myers M G, Jr, Schoelson S E, Chin D J, Sun X J, Miralpeix M, Hu P, Margolis B, Skolnik E Y, Schlessinger J, White M F. The phosphatidylinositol 3-kinase is activated by association with IRS-1 during insulin stimulation. EMBO J. 1992;11:3469–3479. doi: 10.1002/j.1460-2075.1992.tb05426.x. [DOI] [PMC free article] [PubMed] [Google Scholar]
- 3.Baserga R. Growth regulation of the PCNA gene. J Cell Sci. 1991;98:433–436. doi: 10.1242/jcs.98.4.433. [DOI] [PubMed] [Google Scholar]
- 4.Bradford M. A rapid and sensitive method for the quantitation of microgram quantities of protein utilizing the principle of protein-dye binding. Anal Biochem. 1976;72:248–254. doi: 10.1016/0003-2697(76)90527-3. [DOI] [PubMed] [Google Scholar]
- 5.Brüning J C, Winnay J, Cheatham B, Kahn C R. Differential signaling by insulin receptor substrate 1 (IRS-1) and IRS-2 in IRS-1-deficient cells. Mol Cell Biol. 1997;17:1513–1521. doi: 10.1128/mcb.17.3.1513. [DOI] [PMC free article] [PubMed] [Google Scholar]
- 6.Fantin V R, Wang Q, Lienhard G E, Keller S R. Mice lacking insulin receptor substrate 4 exhibit mild defects in growth, reproduction, and glucose homeostasis. Am J Physiol Endocrinol Metab. 2000;278:E127–E133. doi: 10.1152/ajpendo.2000.278.1.E127. [DOI] [PubMed] [Google Scholar]
- 7.Harada S, Smith R M, White M F, Jarret L. Insulin-induced egr-1 and c-fos expression requires insulin receptor, Shc, and mitogen-activated protein kinase, but not insulin receptor substrate-1 and phosphatidylinositol 3-kinase activation. J Biol Chem. 1996;271:30222–30226. doi: 10.1074/jbc.271.47.30222. [DOI] [PubMed] [Google Scholar]
- 8.Hotamisligil G S, Peraldi P, Budavari A, Ellis R, White M F, Spiegelman B M. IRS-1-mediated inhibition of insulin receptor tyrosine kinase activity in TNF-α and obesity-induced insulin resistance. Science. 1996;271:665–668. doi: 10.1126/science.271.5249.665. [DOI] [PubMed] [Google Scholar]
- 9.Kasuga M, Karlsson F A, Kahn C R. Insulin stimulates the phosphorylation of the 95,000-dalton subunit of its own receptor. Science. 1982;215:185–187. doi: 10.1126/science.7031900. [DOI] [PubMed] [Google Scholar]
- 10.Kasus-Jacobi A, Perdereau D, Tartare-Deckert S, Van Obberghen E, Girard J, Burnol A F. Evidence for a direct interaction between insulin receptor substrate-1 and Shc. J Biol Chem. 1997;272:17166–17170. doi: 10.1074/jbc.272.27.17166. [DOI] [PubMed] [Google Scholar]
- 11.Kim B, Leventhal P S, White M F, Feldman E L. Differential regulation of insulin receptor substrate-2 and mitogen-activated protein kinase tyrosine phosphorylation by phosphatidylinositol 3-kinase inhibitors in SH-SY5Y human neuroblastoma cells. Endocrinology. 1998;139:4881–4889. doi: 10.1210/endo.139.12.6348. [DOI] [PubMed] [Google Scholar]
- 12.Kuhne M R, Pawson T, Lienhard G E, Feng G-S. The insulin receptor substrate 1 associates with the SH2-containing phosphotyrosine phosphatase Syp. J Biol Chem. 1993;268:11479–11481. [PubMed] [Google Scholar]
- 13.Lam K, Carpenter C L, Ruderman N B, Friel J C, Kelly K L. The phosphatidylinositol 3-kinase serine phosphorylates IRS-1: stimulation by insulin and inhibition by wortmannin. J Biol Chem. 1994;269:20648–20652. [PubMed] [Google Scholar]
- 14.Lavan B E, Fantin W R, Chang E T, Lane W S, Keller S R, Lienhard G E. A novel 160-kDa phosphotyrosine protein in insulin-treated embryonic kidney cells is a new member of the insulin receptor substrate family. J Biol Chem. 1997;272:21403–21407. doi: 10.1074/jbc.272.34.21403. [DOI] [PubMed] [Google Scholar]
- 15.Lavan B E, Lane W S, Lienhard G E. The 60-kDa phosphotyrosine protein in insulin-treated adipocytes is a new member of the insulin receptor substrate family. J Biol Chem. 1997;272:11439–11443. doi: 10.1074/jbc.272.17.11439. [DOI] [PubMed] [Google Scholar]
- 16.Liu S C, Wang Q, Lienhard G E, Keller S R. Insulin receptor substrate 3 is not essential for growth or glucose homeostasis. J Biol Chem. 1999;274:18093–18099. doi: 10.1074/jbc.274.25.18093. [DOI] [PubMed] [Google Scholar]
- 17.Lorenzo M, Valverde A M, Teruel T, Benito M. IGF-I is a mitogen also involved in differentiation-related gene expression in fetal brown adipocytes. J Cell Biol. 1993;123:1567–1575. doi: 10.1083/jcb.123.6.1567. [DOI] [PMC free article] [PubMed] [Google Scholar]
- 18.Myers M G, Jr, Wang L M, Sun X J, Zhang Y, Yenush L, Schlessinger J, Pierce J H, White M F. Role of IRS-1-GRB-2 complexes in insulin signaling. Mol Cell Biol. 1994;14:3577–3587. doi: 10.1128/mcb.14.6.3577. [DOI] [PMC free article] [PubMed] [Google Scholar]
- 19.Patti M E, Sun X J, Brüning J C, Araki E, Lipes M A, White M F, Kahn C R. 4PS/insulin receptor substrate (IRS)-2 is the alternative substrate of the insulin receptor in IRS-1-deficient mice. J Biol Chem. 1995;270:24670–24673. doi: 10.1074/jbc.270.42.24670. [DOI] [PubMed] [Google Scholar]
- 20.Pelicci G L, Lanfrancone L, Grignani F, McGlade J, Cavallo F, Forni G, Nicoletti I, Pawson T, Pelicci P G. A novel transforming protein (SHC) with an SH2 domain is implicated in mitogenic signal transduction. Cell. 1992;70:93–104. doi: 10.1016/0092-8674(92)90536-l. [DOI] [PubMed] [Google Scholar]
- 21.Porras A, Alvarez A M, Valladares A, Benito M. P42/p44 mitogen-activated protein kinases activation is required for the insulin-like growth factor-I/insulin induced proliferation, but inhibits differentiation, in rat fetal brown adipocytes. Mol Endocrinol. 1998;12:825–834. doi: 10.1210/mend.12.6.0122. [DOI] [PubMed] [Google Scholar]
- 22.Rozakis-Adock M, McGlade J, Mbamala G, Pelicci G, Daly R, Li W, Batzer A, Thomas S, Brugge J, Pelicci P G, Schlessinger J, Pawson T. Association of the Shc and GRB2/Sem5 SH2-containing proteins is implicated in activation of the Ras pathway by tyrosine kinases. Nature. 1992;360:689–692. doi: 10.1038/360689a0. [DOI] [PubMed] [Google Scholar]
- 23.Skolnik E Y, Lee C H, Batzer A G, Vicentini L M, Zhou M, Daly R J, Myers M G, Jr, Backer J M, Ullrich A, White M F, Schlessinger J. The SH2/SH3 domain-containing protein GRB-2 interacts with tyrosine phosphorylated IRS-1 and Shc: implications for insulin control of ras signalling. EMBO J. 1993;12:1929–1936. doi: 10.1002/j.1460-2075.1993.tb05842.x. [DOI] [PMC free article] [PubMed] [Google Scholar]
- 24.Tamemoto H, Kadowaki T, Tobe K, Yagi T, Sakura H, Hayakawa T, Terauchi Y, Ueki K, Yaburagi Y, Satoh S, Sekihara H, Yoshioka S, Horikoshi H, Furuta Y, Ikawa Y, Kasuga M, Yazaki Y, Aizawa S. Insulin resistance and growth retardation in mice lacking insulin receptor substrate-1. Nature. 1994;372:182–186. doi: 10.1038/372182a0. [DOI] [PubMed] [Google Scholar]
- 25.Tanti J F, Grèmeaux T, Van Obberghen E, Le Marchand-Brustel Y. Serine/threonine phosphorylation of insulin receptor substrate 1 modulates insulin receptor signaling. J Biol Chem. 1994;269:6051–6057. [PubMed] [Google Scholar]
- 26.Teruel T, Valverde A M, Benito M, Lorenzo M. Insulin-like growth factor-I and insulin induced adipogenic-related gene expression in foetal brown adipocyte primary cultures. Biochem J. 1996;319:627–632. doi: 10.1042/bj3190627. [DOI] [PMC free article] [PubMed] [Google Scholar]
- 27.Uchida T, Myers M G, Jr, White M F. IRS-4 mediates protein kinase B signaling during insulin stimulation without promoting antiapoptosis. Mol Cell Biol. 2000;20:126–138. doi: 10.1128/mcb.20.1.126-138.2000. [DOI] [PMC free article] [PubMed] [Google Scholar]
- 28.Ullrich A, Bell J R, Chen E Y, Herrera R, Petrucelli L M, Dull T J, Gray A, Coussens L, Liao Y-C, Tsubokawa M, Mason A, Seeburg P H, Grunfeld C, Rosen O M, Ramachandran J. Human insulin receptor and its relationship to the tyrosine kinase family of oncogenes. Nature. 1985;313:756–761. doi: 10.1038/313756a0. [DOI] [PubMed] [Google Scholar]
- 29.Valverde A M, Kahn C R, Benito M. Insulin signaling in IRS-1-deficient brown adipocytes: requirement of IRS-1 for lipid synthesis. Diabetes. 1999;48:2122–2131. doi: 10.2337/diabetes.48.11.2122. [DOI] [PubMed] [Google Scholar]
- 30.Valverde A M, Lorenzo M, Navarro P, Benito M. Phosphatidylinositol 3-kinase is a requirement for insulin-like growth factor-I-induced differentiation, but not for mitogenesis, in fetal brown adipocytes. Mol Endocrinol. 1997;11:595–607. doi: 10.1210/mend.11.5.9924. [DOI] [PubMed] [Google Scholar]
- 31.Valverde A M, Lorenzo M, Pons S, White M F, Benito M. IRS-1 and IRS-2 differential signaling in the insulin/IGF-I pathways in fetal brown adipocytes. Mol Endocrinol. 1998;12:688–697. doi: 10.1210/mend.12.5.0106. [DOI] [PubMed] [Google Scholar]
- 32.Valverde A M, Teruel T, Lorenzo M, Benito M. Involvement of Raf-1 kinase and protein kinase Cζ in insulin-like growth factor-induced mitogenesis in brown adipocyte primary cultures. Endocrinology. 1996;137:3832–3841. doi: 10.1210/endo.137.9.8756554. [DOI] [PubMed] [Google Scholar]
- 33.White M F. The insulin signalling system and the IRS proteins. Diabetologia. 1997;40:S2–S17. doi: 10.1007/s001250051387. [DOI] [PubMed] [Google Scholar]
- 34.White M F, Kahn C R. The insulin signaling system. J Biol Chem. 1994;269:1–4. [PubMed] [Google Scholar]
- 35.Whithers D J, Gutierrez J S, Towery H, Burks D J, Ren J M, Previs S, Zhang Y, Bernal D, Pons S, Shulman G I, Bonner-Weir S, White M F. Disruption of IRS-2 causes type 2 diabetes in mice. Nature. 1998;391:900–903. doi: 10.1038/36116. [DOI] [PubMed] [Google Scholar]
- 36.Whithers D J, Burks D J, Towery H H, Altamuro S L, Flint C L, White M F. IRS-2 coordinates IGF-I receptor-mediated β-cell development and peripheral insulin signalling. Nat Genet. 1999;23:32–40. doi: 10.1038/12631. [DOI] [PubMed] [Google Scholar]
- 37.Yamauchi T, Tobe K, Tamemoto H, Ueki K, Kaburagi Y, Yamamoto-Honda R, Takahashi Y, Yoshizawa F, Aizawa S, Akanuma Y, Sonenberg N, Yazaki Y, Kadowaki T. Insulin signaling and insulin actions in the muscles and livers of insulin-resistant, insulin receptor substrate 1-deficient mice. Mol Cell Biol. 1996;16:3074–3084. doi: 10.1128/mcb.16.6.3074. [DOI] [PMC free article] [PubMed] [Google Scholar]


