

SUMMARY:
Our study details the stepwise evolution of gilteritinib resistance in FLT3-mutated acute myeloid leukemia (AML). Early resistance is mediated by the bone marrow microenvironment, which protects residual leukemia cells. Over time, leukemia cells evolve intrinsic mechanisms of resistance, or late resistance. We mechanistically define both early and late resistance by integrating whole exome sequencing, CRISPR-Cas, metabolomics, proteomics, and pharmacologic approaches. Early resistant cells undergo metabolic reprogramming, grow more slowly, and are dependent upon Aurora kinase B (AURKB). Late resistant cells are characterized by expansion of pre-existing NRAS mutant subclones and continued metabolic reprogramming. Our model closely mirrors the timing and mutations of AML patients treated with gilteritinib. Pharmacological inhibition of AURKB resensitizes both early resistant cell cultures and primary leukemia cells from gilteritinib-treated AML patients. These findings support a combinatorial strategy to target early resistant AML cells with AURKB inhibitors and gilteritinib before the expansion of pre-existing resistance mutations occurs.
Keywords: AML, FLT3, Tumor Microenvironment, Gilteritinib, Aurora Kinase B, NRAS, Drug Resistance, Tyrosine Kinase Inhibitor
Graphical Abstract

eTOC Blurb:
Gilteritinib is an effective FLT3 inhibitor for AML, but residual cells survive in the marrow microenvironment. Over time, these early resistant cells evolve intrinsic mechanisms of resistance leading to relapse. Joshi et al. use a comprehensive approach to interrogate the evolution of resistance; identifying AURKB as critical for early resistance.
INTRODUCTION:
Acute myeloid leukemia (AML) is an aggressive hematologic malignancy that disproportionately affects older adults. It is characterized by an aberrant proliferation of immature myeloblasts that infiltrate the bone marrow and impair normal hematopoiesis. Driver mutations in the fms related receptor tyrosine kinase 3 (FLT3) gene are among the most common in AML and occur in >30% of all patients(Stirewalt and Radich, 2003, Fletcher et al., 2020). FLT3 mutations predominantly consist of internal tandem duplication (ITD) events within the receptor juxtamembrane domain and, to a lesser extent, point mutations in the tyrosine kinase domain (TKD), resulting in constitutive FLT3 activation, pro-survival downstream signaling, and expansion of leukemic cells(Stirewalt and Radich, 2003). FLT3-ITD mutations are associated with increased risk of relapse, providing impetus for the development of several generations of FLT3 inhibitors (FLT3i).
While FLT3i rapidly clear peripheral leukemic cells in circulation, residual AML cells persist in the bone marrow microenvironment(Zeng et al., 2009, Weisberg et al., 2012, Yang et al., 2014) where their survival and expansion lead to disease relapse. Importantly, residual cells are dependent upon growth factors and cytokines within the AML microenvironment for survival, which confer early resistance, also known as disease persistance(Wang and Zhong, 2018, Konopleva et al., 2009, Sato et al., 2011, Konopleva et al., 2002, Battula et al., 2017, Ruvolo et al., 2018, Kornblau et al., 2018, Traer et al., 2016, Javidi-Sharifi et al., 2019, Carey et al., 2017, Melgar et al., 2019). Due to the small number of residual cells available for study, very little is understood about their biology and the mechanisms that keep them alive. For that reason, drug resistance is most often studied after relapse, which we call late resistance, and is usually defined by resistance mutations(Smith et al., 2012, Zhang et al., 2019, Smith et al., 2017). While some of these mutations can be predicted via well-established in vitro mutagenesis and transformation assays(Smith et al., 2012, Smith et al., 2015, Smith et al., 2014, Tarver et al., 2020), a fundamental understanding of the adaptations that foster early resistance and evolution to late resistance have yet to be thoroughly investigated.
Gilteritinib is a potent FLT3i that was recently FDA-approved for relapsed/refractory AML(Perl et al., 2019, Dhillon, 2019). In this study, we comprehensively analyze the temporal evolution of early to late gilteritinib resistance by integrating whole exome sequencing, CRISPR-Cas9 screening, metabolomics, proteomics, phosphoproteomics, and small-molecule inhibitor screening. To model microenvironmental-driven resistance, AML cells were cultured with exogenous protective proteins that are normally secreted by bone marrow stromal cells, which promoted ligand-dependent early resistance. Removal of these ligands transiently restored sensitivity to gilteritinib but eventually led to the expansion of activating intrinsic mutations in late resistance. Multiple orthogonal approaches showed that late resistance to gilteritinib is primarily driven by clonal selection of NRAS activating mutations and hyperactivation of downstream MAPK signaling, consistent with patients that relapse to gilteritinib(McMahon et al., 2019). In contrast, early resistance was not dependent upon NRAS signaling but exhibited metabolic reprogramming, slower growth, and reliance upon Aurora kinase B signaling (AURKB). These experimental observations were corroborated in gilteritinib-treated AML patient samples, which displayed slower cell growth, alterations in metabolism, and profound sensitivity to the combination of gilteritinib and AURKB inhibition. Our approach provides a method to understand the unique biology of early and late resistant AML cells, as well as develop novel combination strategies in early resistance that may block expansion of late resistant mutations.
RESULTS:
Microenvironmental factors promote development of early gilteritinib resistance
To model microenvironmental protection in gilteritinib resistance, we used exogenous fibroblast growth factor 2 (FGF2) and FLT3 ligand (FL). These proteins are secreted by marrow stromal cells and protect FLT3 AML cell lines and primary AML cells from multiple FLT3i(Traer et al., 2016, Javidi-Sharifi et al., 2019, Sato et al., 2011). We treated MOLM14 cells, a human AML FLT3-ITD+ cell line, with increasing concentrations of gilteritinib (0 to 100 nM) +/− 10 ng/mL of FGF2 or FL for 72 hours (Figure 1A). Both FGF2 and FL provided protection against gilteritinib in this short-term assay. To mimic prolonged gilteritinib exposure within the protective bone marrow microenvironment that occurs in patients, we continuously cultured MOLM14 with 100 nM of gilteritinib in media alone (N = 4), or media supplemented with 10 ng/mL of FGF2 or FL (N = 4 for each). MOLM14 parental cells treated with gilteritinib without protective ligands never resumed growth (Figure 1B, yellow line). However, all cultures supplemented with FGF2 or FL eventually resumed growth, highlighting the importance of extrinsic survival factors in facilitating early resistance to gilteritinib (Figure 1B, solid teal and maroon lines). After ~4 months with ligand, we put selective pressure on the early resistant cultures by removing FGF2 and FL. While this temporarily restored sensitivity to gilteritinib, the cultures eventually resumed exponential growth, evolving to ligand-independent growth and late resistance (Figure 1B, dotted lines). Immunoblot analysis of FLT3, MAPK, and PI3K/AKT pathways in ligand-dependent early resistant cultures demonstrated that FL partially restored FLT3 activity, and FGF2 reactivated MAPK and AKT through activation of FGFR1 (Figure 1C-D). In contrast, in the late resistant ligand-independent cultures, FLT3 itself remained inactive, but there was clear reactivation of downstream MAPK and PI3K/AKT signaling (Figure 1C-D). We also created a parallel gilteritinib resistance model with the human AML FLT3-ITD+ cell line, MV4;11 and found with this second independent model a similar biphasic pattern of resistance (Figure S1A and Table S1). To understand the mechanisms of early and late gilteritinib resistance, we utilized five distinct but complementary approaches: whole exome sequencing (WES), genome-wide CRISPR-Cas screening, metabolomics, proteomics and phosphoproteomics, and small-molecule inhibitor screening (Figure 1E).
Figure 1: Emergence of early and late gilteritinib resistant cultures.

A. MOLM14 parental cells were treated with a gradient of gilteritinib ± recombinant FGF2 or FL (10 ng/mL). Viability was measured after 72 hours and normalized to untreated cells. The mean of five replicates ± SE are shown.
B. MOLM14 cells were cultured continuously with 100 nM gilteritinib ± FGF2 or FL (10 ng/mL; N = 4 for each). Mean fold increase in viable cells is plotted ± SE.
C. Immunoblot blot analyses of MOLM14 parental cells treated for 48 hours with 100 nM gilteritinib or DMSO (first two lanes of each panel) compared with early (left panel, lanes 3 – 10) and late (right panel, lanes 3 – 10) extended gilteritinib resistant MOLM14 cultures.
D. Graphic summary of immunoblot results from early and late gilteritinib resistant cultures.
E. Schematic of approach to study the evolution of gilteritinib resistance.
NRAS mutations are dominant during late resistance, but not required in early resistance
We performed WES analysis of late gilteritinib-resistant MOLM14 and MV4;11 cultures and discovered activating NRAS point mutations in 13 of the 15 cultures, although the mutations were not always identical (Figure 2A and S1B). One late resistant culture had a FLT3F691L gatekeeper mutation, which has also been shown to promote resistance to gilteritinib(McMahon et al., 2019), as well as other FLT3i(Smith et al., 2012, McMahon et al., 2019, Zhang et al., 2019). In three other cultures, we detected a novel FLT3N701K mutation, which also drives resistance to gilteritinib in a manner similar to F691L(Joshi et al., 2021). All mutations detected by WES analyses in late gilteritinib-resistant cultures were confirmed by Sanger sequencing (Figure 2B, S1C) and FLT3-ITD+ status was maintained, as confirmed by Pindel software(Ye et al., 2009). We then assessed the time at which these mutations arose during long-term culture. By Sanger sequencing, the mutations were undetectable for up to 4 months in the presence of ligand in MOLM14 cultures (Figure 2B and 2S), however they were detectable in early resistant MV4;11 cultures after 5 months (Figure S1C and S3), indicating more overlap between early and late resistance in this cell line.
Figure 2: NRAS mutations are enriched in late but not early resistance.
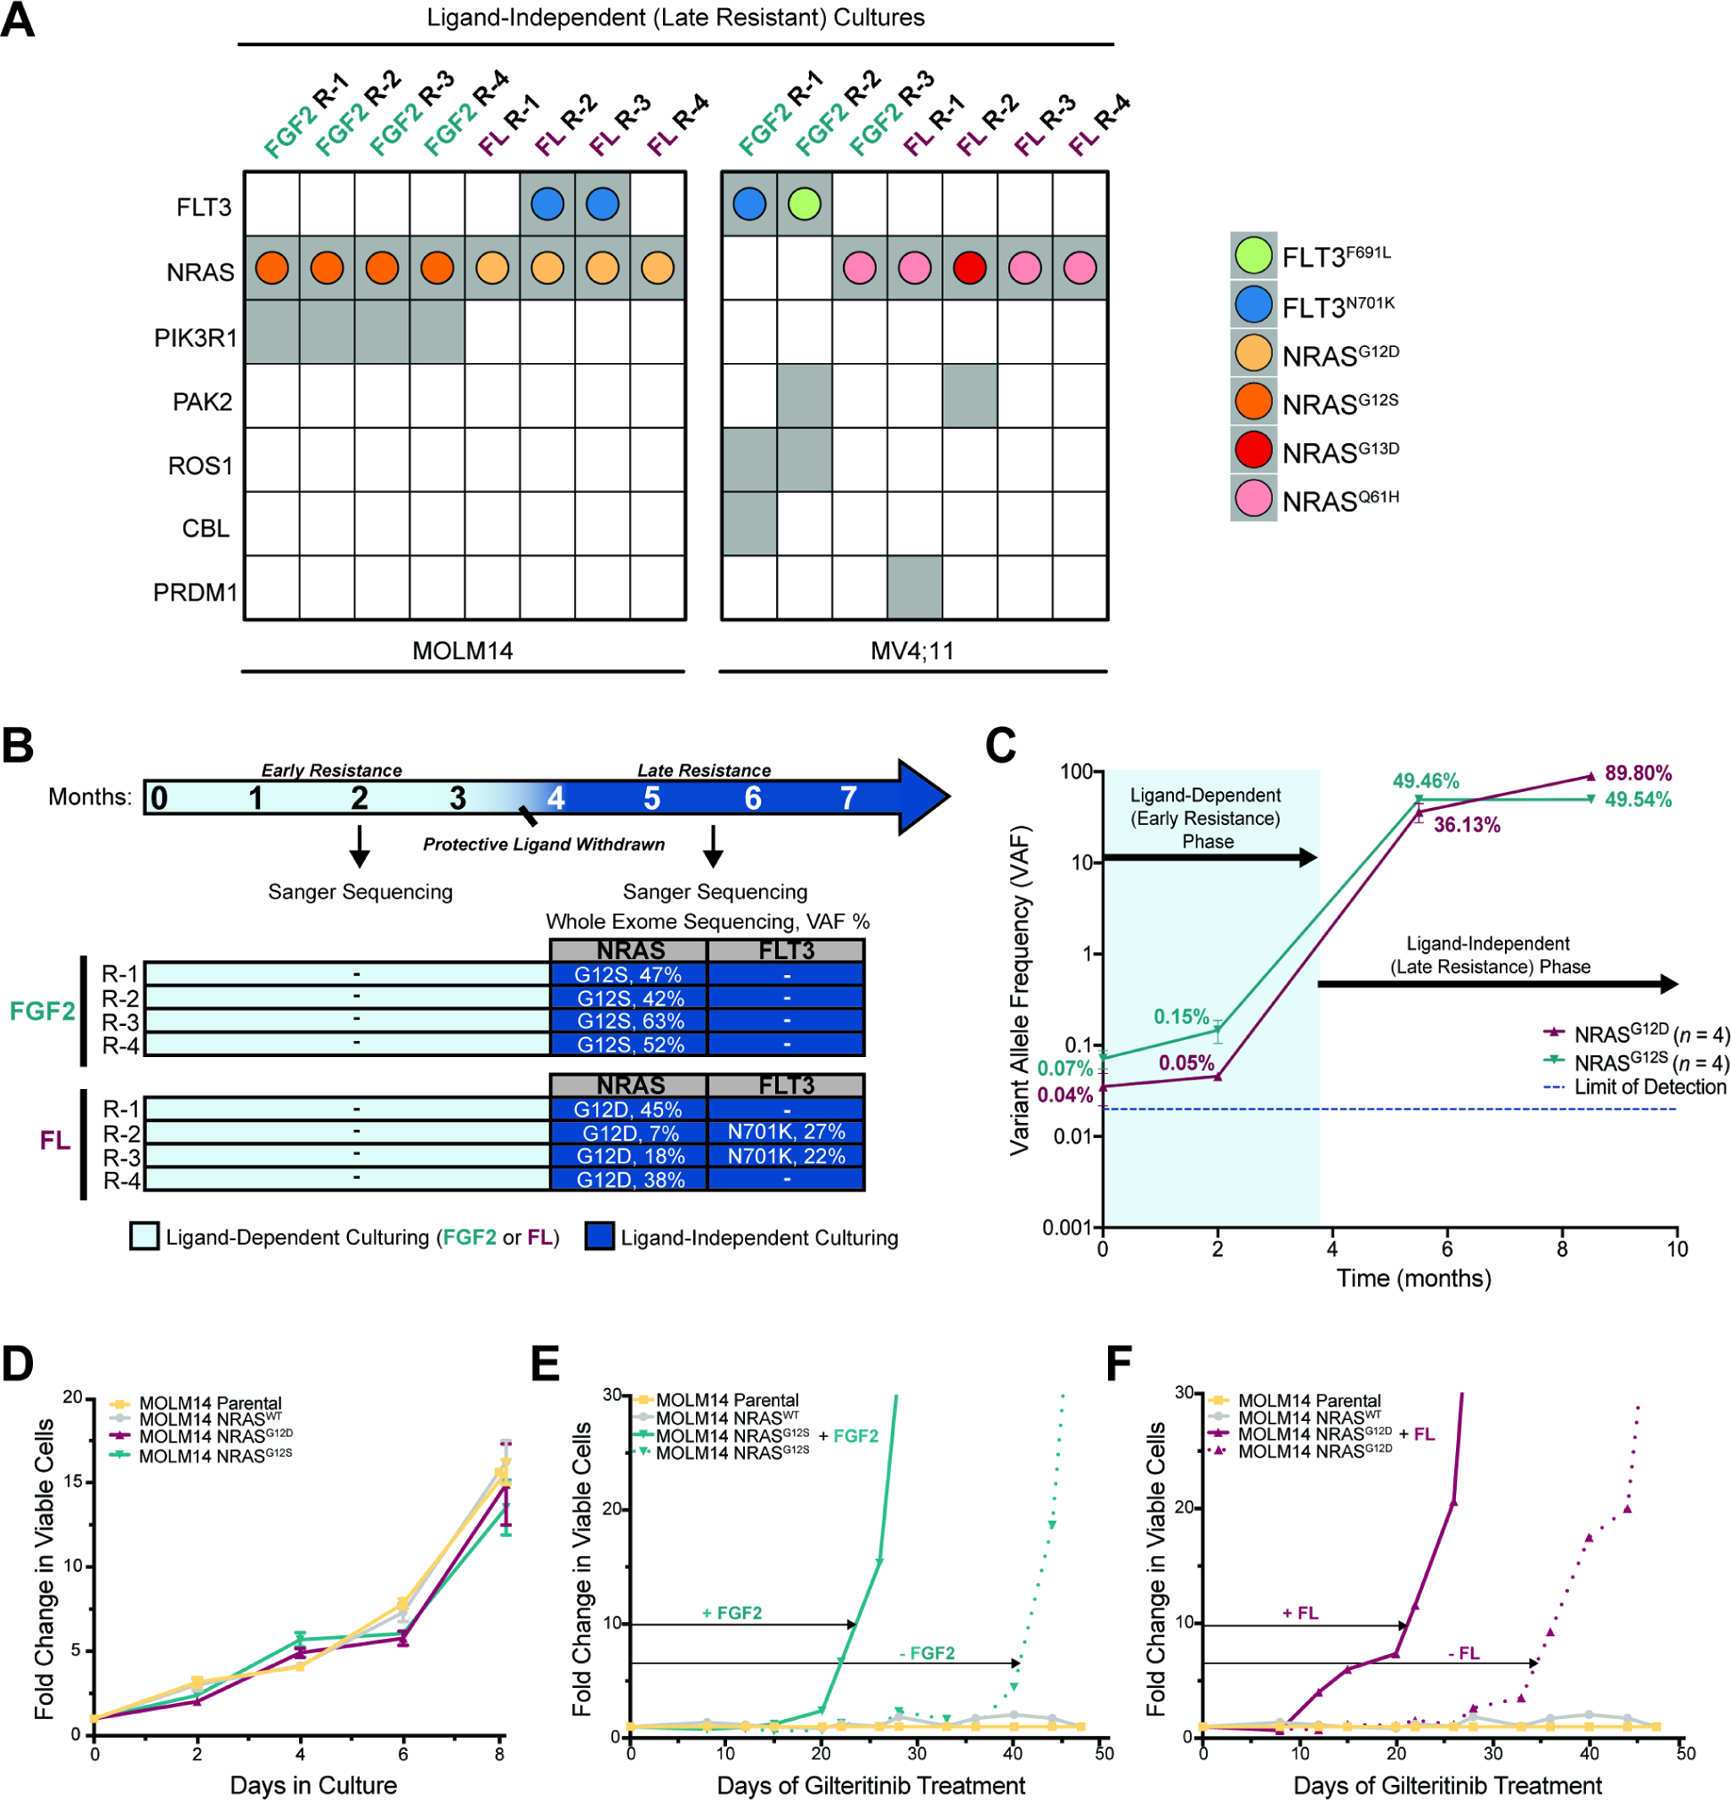
A. Mutations (gray squares) identified by WES in late gilteritinib resistant MOLM14 and MV4;11 replicate cultures. AML drivers or genes in common cancer pathways are shown. Colored dots within the gray squares represent specific FLT3 or NRAS mutations.
B. Overlap between WES analyses and mutation confirmation by Sanger sequencing. Arrows indicate timepoints at which WES or Sanger sequencing were performed. Mutations not detected are indicated with “-”.
C. ddPCR analyses for detection of NRAS G12S/D mutations in parental, ligand-dependent, and independent MOLM14 cultures over time. Mean of 4 biological replicates ± SE are shown.
D. NRAS G12S/D mutations provide no growth advantage relative to MOLM14 parental or NRASWT cells in the absence of gilteritinib. Fold change in number of viable cells relative to day 0 is plotted. Mean of triplicates ± SE are shown.
E-F. NRAS mutant cell lines develop resistance to 100 nM gilteritinib treatment after one month in culture, whereas MOLM14 parental and NRASWT do not. FGF2 or FL (10ng/mL), accelerate development of resistance (solid vs. dotted lines).
To test whether low-level NRAS mutations were pre-existing or arose de novo in the MOLM14 gilteritinib resistance model, we optimized a droplet digital PCR (ddPCR) assay to quantify the variant allele frequency (VAF) of NRAS G12S and G12D. The higher sensitivity of ddPCR enabled us to detect NRAS G12S/D at very low levels in MOLM14 parental cells (< 0.1 %), indicating that these mutations did not arise de novo. The VAF increased slightly in early resistant cultures (≤ 0.15%), and then expanded rapidly once protective ligands were removed in late resistance (Figure 2C). These data suggest that NRAS mutations are not required in the presence of ligand, but become dominant upon ligand removal. In view of this hypothesis, we tested whether NRAS mutations were sufficient to drive gilteritinib resistance in the absence of ligand. We stably expressed NRASWT and NRAS G12S/D mutations into MOLM14 cells and assessed their sensitivity to gilteritinib. In the absence of gilteritinib, we observed no differences in cell proliferation in NRAS mutant cell lines relative to MOLM14 parental and NRASWT cells (Figure 2D). Treatment with 100 nM of gilteritinib significantly inhibited growth of control and NRAS mutant cell lines after 1 week (Figure 2E-F), indicating that NRAS mutations alone are insufficient to immediately confer resistance. Eventually MOLM14 cells engineered with NRASG12S or NRASG12D developed resistance to gilteritinib without the presence of ligand (Figure 2E-F, dotted lines). However, culturing these cells with FGF2 or FL significantly accelerated the onset of resistance, highlighting the ability of the microenvironment to catalyze development of resistance even in the presence of NRAS mutations (Figure 2E-F, solid lines).
Genome-wide CRISPR screens reveal that early resistance is more complex than late resistance
To genetically interrogate signaling pathways that drive resistance, we performed genome-wide CRISPR resensitization screens in representative FGF2 and FL early and late resistance MOLM14 cultures (Figure 3A). CRISPR analysis of FGF2- and FL-dependent cultures did not identify a single gene responsible for early gilteritinib resistance, but rather revealed numerous genes involved in cell cycle progression, lipid metabolism, and PI3K/MAPK signaling pathways (Figure 3B, S2, S3, and Table S5), underscoring the multifaceted character of early resistance.
Figure 3: Early gilteritinib resistance is multifactorial while late resistance exhibits dependency on NRAS.

A. Genome-wide CRISPR resensitization screen workflow.
B. Volcano plots display results from CRISPR resensitization screens performed on FGF2 (left) and FL (right) early gilteritinib resistant (R-4) MOLM14 cells. Mid Log2 fold change is shown per genes. Only sgRNAs that significantly decrease in gilteritinib-treated cells relative to DMSO-treated cells (p < 0.05) are shown.
C. Volcano plot combining results from two independent CRISPR resensitization screens performed with FGF2 and FL late gilteritinib resistant (R-4) MOLM14 cells. Mid Log2 fold change versus P-values(-Log(RRA P-value)) are plotted(Kolde et al., 2012). Horizontal lines connect genes of highest significance in both screens.
D. Growth curves of NRAS knockout single clones in FGF2 (top) and FL (bottom) late cells following treatment with gilteritinib. Viability of gilteritinib-treated cells was measured after 72 hours and normalized to untreated cells. Mean ± SE are shown.
E. WES and CRISPR-Cas implicate importance of NRAS in late resistance.
F. Schematic of NRAS signaling, downstream effectors, and pertinent small-molecule inhibitors.
G-J. FGF2 (G, I) or FL (H, J) late cells were treated with MEK (selumetinib) or PI3K (taselisib) inhibitors alone or in combination with gilteritinib. Viability was measured after 72 hours and normalized to untreated cells. Mean of triplicates ± SE are shown.
In contrast to early resistance, NRAS was by far the most significant hit in the late resistant cultures (Figure 3C). A meta-analysis approach for comparing ranked gene-lists with Robust Rank Aggregation (RRA)(Kolde et al., 2012) identified overlap between the FGF2 and FL late resistant screens and found that NRAS (FDR < 0.002) was the main regulator of late gilteritinib resistance (Figure 3C). Confirmatory CRISPR-Cas deletion of NRAS partially restored sensitivity to gilteritinib in both late resistance cultures, demonstrating a strong dependency on NRAS/MAPK signaling for survival (Figure 3D). The concordance of NRAS dependency uncovered by WES and CRISPR screening (Figure 3E) prompted us to test small-molecule inhibitors(Tyner et al., 2018) of the downstream MAPK and PI3K/AKT signaling pathways (Figure 3F). Two MEK inhibitors, selumetinib and trametinib, and a PIK3CA inhibitor, taselisib, were also able to partially restore sensitivity to gilteritinib (Figure 3G-J and S3, Table S2), reinforcing the importance of NRAS signaling in late resistance.
Metabolic reprogramming starts with early resistance and continues into late resistance
Multiple hits from the FGF2 and FL early CRISPR screens hinted that perturbations in metabolism may contribute to early resistance (Figure 3B and 4A), providing rationale for global metabolic profiling. A 48-hour gilteritinib treatment of MOLM14 parental cells relative to untreated cells (N = 4 for each) indicated that gilteritinib rapidly decreased central energy metabolism and altered glycerophospholipid metabolism (Table S3). These effects were only modestly dampened by the addition of FGF2 or FL over 48 hours. However, examination of metabolites in early and late gilteritinib resistant cultures (N = 4 per group) suggested that long-term FLT3 inhibition resulted in a broad metabolomic reprogramming (Figure 4B). Partial least squares-discriminant analysis revealed dramatic differences in the metabolome of early and late gilteritinib-resistant MOLM14 cultures relative to parental cells (Figure 4C). Consistent with CRISPR screen results of FGF2 early resistant cells (Figure 4A), metabolic profiling of these cells confirmed a trend towards increased sphingolipid/phospholipid metabolites relative to MOLM14 parental cells. These changes became more pronounced in late resistance with significant enrichment of sphingosine 1-phosphate (p = 0.0118), sphinganine 1-phosphate (p = 0.0006), and ethanolamine phosphate (p < 0.0001) in FGF2 late gilteritinib-resistant cells relative to parental (Figure 4D, Table S3). All metabolite comparisons were Sidak adjusted. In conjunction with CRISPR validation experiments (Figure S4A), these data implicate an initial dependency on sphingolipid/phospholipid metabolism in FGF2 early resistant cells that becomes more prominent in late resistance.
Figure 4: Early and late gilteritinib resistant cells exhibit unique metabolic dependencies.

A. Plot summarizes major pathways important in early gilteritinib resistance as identified by CRISPR resensitization screens in Figure 3B.
B. Heat map of hierarchical clustering analysis of significantly changed metabolites (ANOVA; p < 0.05) in early and late gilteritinib resistant cultures relative to MOLM14 parental cells.
C. Partial least squares-discriminant analysis of normalized data from 4B reveals the progression of acquired gilteritinib resistance.
D-E. Comparison of selected metabolite abundance (au) in early and late gilteritinib resistant MOLM14 cultures relative to parental cells. Statistical significance was assessed by one-way ANOVA followed by SIDAK correction. *p < 0.05, **p < 0.01, ***p < 0.001, ****p < 0.0001
F. Overview of carnitine shuttle. CPT1, Carnitine palmitoyltransferase I; CACT, Carnitine-acylcarnitine translocase; CPT2, Carnitine palmitoyltransferase 2
G-I. Oxygen consumption rate (OCR) for MOLM14 parental cells (G), FL early (H), and FL late (I) following inhibition of CPT1 activity with etomoxir (ETO, arrow). Each data point has at least three technical replicates; mean ± SE are shown. Vertical dotted lines show inhibitor injection times used in the Seahorse assay.
FL-derived gilteritinib-resistant cultures, on the other hand, demonstrated increased fatty acid/carnitine metabolism. Acylcarnitine levels in FL early cells (N = 4) were similar to untreated parental cells but significantly higher in FL late resistant cells (N = 4; Figure 4E and Table S3). To assess the functional relevance of fatty acid catabolism in FL early and late cultures, we measured changes in oxidative phosphorylation (OXPHOS) activity using the Seahorse assay (Figure 4G-I). Administration of etomoxir (ETO), an inhibitor of carnitine palmitoyltransferase 1 (CPT1, Figure 4F), had the greatest effect on OXPHOS in late FL resistant cultures (Figure 4I, decreased maximal respiration between the FCCP and Rotenone/Antimycin A dotted lines). This suggests dependence on acylcarnitines for energy despite abundant glucose. CRISPR-Cas inactivation of CPT1A and CPT2 (Figure S4B-C) also increased sensitivity to gilteritinib in FL early and late resistant cultures, further supporting dependence on carnitine metabolism in FL-derived cultures.
Distinct proteomes define early and late gilteritinib-resistant cells
To further define early resistance, we performed proteomics and phosphoproteomics. Protein lysates (N = 4 per group) from parental, early, and late gilteritinib-resistant MOLM14 and MV4;11 cells were digested and analyzed by mass spectrometry using an isobaric labeling-based, integrated analysis approach in which a total of 7,694 proteins and 36,004 phosphopeptides were identified(Mertins et al., 2018, Piehowski et al., 2018) (Figure 5A). Principal component analysis (PCA) visualization demonstrated a clear separation among MOLM14 parental, early resistant, and late resistant cultures, along with a distinct clustering by ligand (Figure 5B), similar to their metabolic profiles (Figure 4C). The proteome and phosphoproteomes of gilteritinib-resistant MV4;11 cells revealed similar differences between early and late resistance, although not as pronounced as in the MOLM14 model, which likely corresponds to the earlier appearance of NRAS mutations during ligand supplementation (Figure S5A and S1B).
Figure 5: Early and late gilteritinib resistant cultures have distinct proteomic profiles, and early resistance has significantly reduced cell cycle protein activity.

A. Overview of integrated proteomics and phosphoproteomics workflow.
B. Visualization of proteomic (left) and phosphoproteomic (right) profiling by PCA shows clear separation among parental, early, and late resistant MOLM14 cultures.
C. KSEA infers changes in kinase activity (p < 0.05) throughout the development of gilteritinib resistance from parental to early resistance (left plot) and then early to late resistance (right plot). Higher Z scores correspond to increased activity of a given kinase and vice versa (MOLM14 FGF2 and FL resistant cultures analyzed together).
D-E. Pathway and causality analysis using CausalPath (FDR < 0.1), visualized by ChiBE. Protein-protein network diagram in D shows proteins dynamically regulated in early resistant cells relative to MOLM14 parental and E shows protein activity altered in late resistant cells relative to early cells (FGF2 and FL resistant cultures analyzed together).
For the initial analysis, FGF2 and FL early and late resistant MOLM14 cultures (N = 8 per group) were analyzed together. Since phosphorylation modulates multiple cellular processes, kinase-substrate enrichment analysis (KSEA) was used to infer changes in the activity of kinases by evaluating modifications to the phosphorylation levels of their respective substrates(Casado et al., 2013, Wiredja et al., 2017). In early gilteritinib-resistant MOLM14 cells, KSEA indicated a significant decrease (p < 0.05) in activity of proteins facilitating cell cycle progression (CDK 1, 2, 4, 5, 6, 7 and 9; Figure 5C), and a complementary increase in activity of cell cycle checkpoint (PRKCA, CSNK2A1) and DNA damage response (DDR) modulators (ATM; Figure 5C and S6). Early resistant MV4;11 cells showed a similar pattern, including increased activity of additional mitotic checkpoint proteins AURKB, AURKA, and DDR proteins ATM and ATR, many of which were also found in MOLM14 resistant cultures when FGF2 and FL-derived cultures were considered separately (Figure S5B, S6, and S7). Notably, these cell cycle alterations were largely reversed in late resistant MOLM14 and MV4;11 cells, as evident by the significant increase in CDK phosphorylation from early to late resistance (Figure 5C and S5B). While FGF2 and FL contributed to MAPK and PI3K signaling in early resistant cultures relative to parental cells, these pathways were more prominently increased in late, ligand-independent resistant MOLM14 and MV4;11 cells after expansion of NRAS mutant subclones (Figure 2B, 5C, S1B, S5B, S6, and S7).
We also utilized CausalPath, a method that uses curated signaling pathway data from Pathway Commons to infer causal relationships between differential proteomic and phosphoproteomic readouts(Babur et al., 2018). In agreement with KSEA, CausalPath suggested early resistance is predominantly characterized by a decrease in cell cycle progression as evident by decreased CDK1, CDK2, MYC, and cyclin D3 signaling in early resistant MOLM14 cultures (Figure 5D). Early resistance network diagrams also highlighted proteins associated with lipid metabolism, including CPT1A, NRF1, CAPNS1, and SPAST, consistent with the metabolic remodeling that begins in early gilteritinib resistance (Figure 5D and S5C). Activity of CDKs and MAPK, reflected in their phosphorylation, were then increased in late MOLM14 and MV4;11 resistant lines after acquisition of NRAS mutations (Figure 5E and S5D-E). Collectively, proteomic and phosphoproteomic profiling of early and late gilteritinib resistant MOLM14 and MV4;11 cultures independently validated many of the genes and pathways identified by WES, CRISPR-Cas9, and metabolomic analyses, as well as implicating additional signaling pathways.
Early gilteritinib resistance is dependent upon Aurora kinase B for cell cycle regulation
Our phosphoproteomic data strongly implicated that alterations in cell cycle contribute to early gilteritinib resistance. Accordingly, we analyzed the cell cycle profile of MOLM14 parental and early and late gilteritinib-resistant cultures using propidium iodide (PI) staining of DNA content. As expected, short-term gilteritinib treatment for 24 or 48 hours essentially halts cell cycle (S and G2/M) of MOLM14 parental cells (Figure 6A). Cell cycle analyses of FGF2 and FL early gilteritinib-resistant MOLM14 cultures revealed a decrease in the number of cells entering S phase relative to untreated parental cells (Figure 6A, C), consistent with decreased activity of CDK2, 4, and 6 inferred by KSEA (Figure 5C-D). At the same time, the number of cells in G2/M were relatively unchanged, suggesting an overall decrease in cell cycle progression (Figure 6A, C). To further distinguish actively cycling cells from non-cycling cells in G0, cells were co-labelled with PI (x-axis) and Ki67 (y-axis), a marker of proliferating cells. Early resistant cultures had the highest percentage of non-cycling cells (Figure 6B-C). In contrast, late resistant cultures had a similar cell cycle profile to untreated parental MOLM14s (Figure 6A, C). These data corroborate the predicted changes in cell cycle by phosphoproteomics analysis (Figure 5C-D).
Figure 6: Early resistant cultures have a slower cell cycle and inhibition of AURKB resensitizes early resistant MOLM14 cells to gilteritinib.

A. Representative cell cycle analysis profile of MOLM14 parental, treated with 100 nM gilteritinib for 24 and 48 hours, early, and late resistant cultures maintained with 100 nM gilteritinib. Analyses were performed in triplicate using PI staining and flow cytometry.
B. Representative contour plots are shown. Cell cycle (PI) plotted against proliferation (Ki-67) to determine G0 vs G1.
C. Quantification of cell cycle profile shown in A and B. Percent of cells per phase ± SD.
D-E. FGF2 (D) and FL (E) early gilteritinib resistant MOLM14 cell lines were treated with the AURKB inhibitor, AZD2811, and gilteritinib as single agents or in combination. Viability was measured after 72 hours and normalized to untreated cells. Experiments were performed in triplicate. Mean ± SE are plotted.
F-G. CRISPR-Cas knockout of AURKB in FGF2 (H) and FL (I) early resistant MOLM14 cells restored gilteritinib sensitivity. Viability was measured in triplicate as stated above. Mean ± SE are plotted.
The slowing of cell cycle in early resistant cultures suggested regulation by checkpoint molecules. We noted robust upregulation of Aurora kinases, which are key mitotic regulatory serine/threonine kinases(Bertran-Alamillo et al., 2019), in both MOLM14 and MV4;11 resistant cultures, and Aurora kinase B (AURKB) activity in particular was significantly increased by KSEA analysis (Figures S5B, S6, and S7). We tested a specific AURKB inhibitor, AZD2811, in the FGF2 and FL early gilteritinib resistant MOLM14 cultures and found that these cultures were uniquely sensitive to AZD2811 alone, and in combination with gilteritinib (Figure 6D-E and Table S2). In comparison, pharmacologic inhibition of AURKA and AURKC showed little activity in early resistance cultures, suggesting that early gilteritinib resistance is AURKB dependent (Figure S8A-H and Table S2). To confirm the specificity for AURKB, CRISPR-mediated knockout of AURKB was found to enhance sensitivity to gilteritinib in early resistant cell lines (Figure 6F-G), whereas CRISPR-mediated inactivation of AURKA or AURKC did not (Figure S8I-L). As further confirmation of the specificity of AZD2811 for AURKB, genetic deletion of AURKB by CRISPR rendered them insensitive to further inhibition by AZD2811 (Figure S8M).
Model of early and late gilteritinib resistance recapitulates human disease
Clinically, early resistance to gilteritinib is characterized by low-level residual disease confined to the bone marrow, and late resistance by increasing leukemic burden and disease relapse. NRAS mutations are the most commonly acquired mutations in relapsed/refractory AML(McMahon et al., 2019), which is recapitulated by the expansion of NRAS mutations in our late resistant cultures. To evaluate the clinical relevance of our early resistant cultures, we selected 12 patients treated with gilteritinib who had both pre-treatment samples and paired samples after 1 or 2 months of gilteritinib. Most patients still had detectable leukemia cells by flow cytometry after gilteritinib treatment, although the percentage was often low (Table S4), limiting the number of cells for analysis. AML cells were enriched using CD33+ and CD34+ bead selection and analyzed with a targeted proteomics panel, consisting of prioritized proteins from our MOLM14 and MV4;11 resistant cultures (Figure 5, S5). One patient sample was omitted due to low protein yield. PCA demonstrated a clear discrimination between the remaining 11 pre-treatment (PT) and early resistant (ER) samples (Figure 7A). Of the 123 proteins surveyed with targeted proteomics, 52 proteins were significantly altered after gilteritinib treatment (q < 0.05). Unsupervised hierarchical clustering analysis revealed significant alterations in three major signaling processes: 1) a prominent decrease in abundance of proteins that regulate cell cycle progression, including CDK1, CDK2, CDK4, and CDK9; 2) an increase in MAPK signaling proteins, and 3) an increase in proteins involved in fatty acid metabolism (Figure 7B-C). Marrow stroma from corresponding patient samples (N = 7) also showed a significant increase (p < 0.028) in FGF2 mRNA expression following gilteritinib treatment (Figure 7D), consistent with previous results(Traer et al., 2016).
Figure 7: Targeted proteomics of primary early resistant AML samples shows reduced cell cycle proteins, increase in lipid metabolism proteins, and alterations in MAPK signaling proteins. Ex vivo treatment confirms AURKB vulnerability in early resistance.

A. Pre-treatment (PT) and early resistant (ER) AML patient samples (N = 11) were enriched for leukemia cells by CD33+/CD34+ selection and underwent targeted proteomic analysis. PCA of normalized peak intensity ratios shows clear segregation between PT and ER samples.
B. Heatmap of unsupervised hierarchical clustering analysis of differentially-expressed proteins between PT and ER samples (N = 52, q < 0.05).
C. Network cluster analyses of differentially-expressed proteins shows significantly altered clusters of proteins involved in cell cycle, fatty acid metabolism, and MAPK signaling. Glay (undirected)(Su et al., 2010) was used to perform clustering analysis using STRING interactions(Szklarczyk et al., 2018) within the cytoscape interface(Shannon et al., 2003).
D. AML stroma from paired pre-treatment and on-gilteritinib treatment patient samples (N = 7) was cultured in vitro and characterized via RNA-sequencing. FGF2 expression is increased in on-gilteritinib treatment samples.
E. AML cells from paired PT and ER patient samples (N = 4) were enriched with CD33+/CD34+ selection and treated with AURKB inhibitor, AZD2811 and gilteritinib as single agents or in combination. Viability was measured after 72 hours and normalized to untreated cells. Mean of triplicates ± SD are shown.
F. Beat AML data(Tyner et al., 2018) of primary AML patient samples (N = 397) shows positive correlation of AZD2811 sensitivity with FLT3-ITD mutations and negative correlation with NRAS mutations.
Given the similarities in proteome signatures between early gilteritinib-resistant cultures and patient samples, we tested if AURKB inhibition could re-sensitize patient AML cells to gilteritinib ex vivo. Paired primary AML cells from four patients before and after gilteritinib were plated in HS-5 stromal cell conditioned media to mimic the marrow microenvironment(Traer et al., 2016, Javidi-Sharifi et al., 2019), and treated with gilteritinib and AZD2811 alone and in combination. Pre-treatment samples were relatively insensitive to gilteritinib or AZD2811 in the presence of HS-5 conditioned media. However, early resistant samples were strikingly sensitive to the combination of gilteritinib and AZD2811 (Figure 7E), mirroring results of early resistant cell cultures (Figure 6D-E). Examination of a larger number of primary AML samples in the Beat AML dataset(Tyner et al., 2018) (N = 397) revealed that AML cells with FLT3-ITD mutations were significantly more sensitive to AZD2811, whereas AML samples with NRAS mutations tended to be insensitive, providing further evidence that AZD2811 is more effective earlier in disease treatment, prior to expansion of NRAS mutations (Figure 7F).
DISCUSSION:
Genetic alterations resulting in constitutively active receptor tyrosine kinases often promote dependence upon these oncoproteins and their signaling pathways, a process known as “oncogene addiction”(Sharma and Settleman, 2007, Weinstein, 2002). This signaling addiction can be targeted with small-molecule kinase inhibitors. However, for most cancers, residual cells persist and are the seeds for eventual outgrowth of resistant clones and disease relapse. Mutations that either interfere with kinase inhibition or that activate accessory pathways are well defined and frequently found in late resistant cells. In contrast, the mechanisms that facilitate initial disease persistence are less well understood due to the paucity of early resistant cells and their relatively slow growth rate. Recent studies of other malignancies have shown that a subpopulation of “drug tolerant persister” cells are intrinsically more resilient to cancer drugs(Sharma et al., 2010, Banelli et al., 2015, Lantermann et al., 2015, Sosa et al., 2014, Hata et al., 2016). While the term persistent implies that the cells are merely quiescent or static, our data show otherwise. These cells are uniquely dependent upon survival factors in the AML microenvironment, grow more slowly, and rely on dynamic metabolic changes to survive. Therefore, we prefer the term early resistance to describe this active process. The adaptability of early resistant cells allows them time to evolve mechanisms that free them from their dependency on the marrow microenvironment, however during this process they also acquire new sensitivities(Zhao et al., 2016, Lin et al., 2020). Targeting the vulnerabilities of early resistant cells is an attractive strategy to improve the durability of response to kinase inhibitors.
Most cell line models of resistance reproduce tumor-intrinsic mutations(Smith et al., 2012, Smith et al., 2014, Bradeen et al., 2006, Zhang et al., 2019) that are found at relapse, rather than extrinsically-mediated, non-genetic adaptations that define early resistance in patients. By exposing AML cells to the microenvironmental ligands FGF2 and FL, we created a two-step model that captured the unique features of early resistance (Figure 7B-C), as well as the evolution to intrinsic late resistance (Figure 1B). This approach allowed us to consider not only the features of early and late gilteritinib resistance as discrete events, but also as a continuous evolutionary process. The marrow microenvironment expresses a number of growth factors and cytokines that affect leukemia cells, but expression levels of both FGF2 (Figure 7D) and FL(Traer et al., 2016, Sato et al., 2011, Traer et al., 2014) increase during treatment, indicating that these ligands are regulated during early resistance to FLT3i(Traer et al., 2014, Traer et al., 2016). FGF2 and FL reproduce two fundamental paradigms of resistance in FLT3 AML. FGF2 activates FGFR1 and downstream MAPK/AKT signaling in a classic accessory resistance pathway in AML(Traer et al., 2016, Javidi-Sharifi et al., 2019, Wilson et al., 2012), as well as other kinase-driven malignancies(Ware et al., 2013, Terai et al., 2013, Traer et al., 2014). In contrast, FL leads to partial re-activation of FLT3. Despite their different mechanisms of resistance, both ligands converge on the MAPK and AKT pathways, which are critical for FLT3i resistance(Traer et al., 2016, Sato et al., 2011, Yang et al., 2014, Ruvolo et al., 2018), and thus are representative of in vivo ligand/receptor interactions(Ruvolo et al., 2018, Kornblau et al., 2018, Carey et al., 2017, van Gastel et al., 2020), even if they don’t capture the complete in vivo complexity of the marrow microenvironment.
Our model demonstrates that initial resistance to gilteritinib does not rely on NRAS mutations, despite their presence at low levels in early resistant cells (Figure 2C), emphasizing that non-mutational, metabolic, and phenotypic adaptations are more critical for survival in early resistance. In contrast, NRAS mutations are frequently found at relapse in patients with AML, typically after ~6 months of treatment(McMahon et al., 2019, Perl et al., 2019), and we saw expansion of NRAS mutations in our late resistant cultures in a similar timeframe (Figure 2A-C and S1B)(Joshi et al., 2021). In addition to NRAS mutations, we also identified mutations in FLT3 that interfere with gilteritinib binding (FLT3F691L in particular, Figure 2A), which are also found in a small subset of relapsed AML patients treated with gilteritinib(Perl et al., 2019, McMahon et al., 2019, Zhang et al., 2019, Smith et al., 2012). Taken together, gilteritinib resistance follows a predictable, non-stochastic pattern of non-mutational, early resistance phase that leads to eventual expansion of intrinsic mutations and late resistance.
Although we performed numerous mechanistic studies on early resistant cultures after they resumed growth (~day 30, Figure 1B), the events prior to resumption of ligand-dependent growth remained unclear. We performed proteomics on MOLM14 parental cells treated with gilteritinib at 30 minutes and 3 hours to assess the acute changes mediated by gilteritinib +/− FGF2 or FL (Figure S9 and S10). KSEA revealed significant upregulation of DNA damage proteins (ATM and ATR) and metabolism (mTOR), with significant downregulation of cell cycle proteins (CDK1, CDK2, AURKA and AURKB) with gilteritinib alone. The majority of proteins identified by KSEA remained the same with the addition of ligand, however AURKA, AURKB, ATM and ATR were not significantly downregulated, suggesting that ligand dampens these pathways. We further evaluated transcriptional changes in MOLM14 cells by RNA-Seq following acute treatment with gilteritinib (48 hours) +/− FGF2 or FL and again at early resistance (day 30). Reactome pathway analysis(Jassal et al., 2020) identified that acute gilteritinib treatment induced cell cycle arrest, upregulation of DNA damage response, autophagy, apoptosis, and shutdown of central energy metabolism (Figure S10). Addition of FGF2 or FL showed no clear impact on these pathways at 48 hours, but by ~day 30 cells are able to overcome the cell cycle arrest, although they still cycled more slowly than parental and late resistant cells (Figure 5C, 6A-C, S5B, S9, S11, and S12). Likewise, primary AML cells also reduce cell cycle proteins in early resistance (Figure 7B-C). Thus, we hypothesize that a small number of cells with preserved AURKB activity and altered metabolism (Figure 4) are able to escape the initial cell cycle arrest induced by gilteritinib and resume growth in early resistance. Inhibition of AURKB activity with AZD2811 restored gilteritinib sensitivity in early resistant cell cultures and even more impressively in early resistant primary patient samples (Figure 6D-G, and 7E).
To evaluate if regulation of AURKB in early resistance was unique to gilteritinib, or a conserved mechanism of resistance to FLT3 inhibitors, we also performed proteomics and phosphoproteomics of early and late quizartinib resistant MOLM14 cultures. Quizartinib is a another potent FLT3i, but in contrast to gilteritinib, late resistance is usually driven by FLT3-TKD mutations, which results in restoration of FLT3 signaling(Smith et al., 2012, Traer et al., 2016). Early quizartinib resistant cultures largely remained ligand-dependent and do not develop resistance mutations, similar to early gilteritinib resistant cultures. KSEA analyses revealed significant CDC7 activity in early quizartinib resistance (Figure S13A). CDC7 is another regulator of cell cycle that is upstream of AURKB(Ito et al., 2019). CRISPR-Cas9 deletion of either CDC7 or AURKB were able to resensitize early resistant cultures to their respective FLT3i (Figure S13B-I), providing evidence that CDC7/AURKB is a conserved mechanism of resistance to FLT3 inhibition. In addition, Aurora kinases have also been implicated in resistance to EGFR inhibitors in lung cancers(Shah et al., 2019, Bertran-Alamillo et al., 2019) and, therefore the Aurora kinases may serve as a common path to early resistance in both solid and liquid tumors.
Along with slower cell cycle, early gilteritinib-resistant cells also evolved a unique metabolic profile compared to parental MOLM14 cells (Figure 4B-E). Prior studies with quizartinib showed an immediate effect on the metabolism of AML cells(Gregory et al., 2016, Gregory et al., 2018, Gallipoli et al., 2018) and we confirm that this also applies to gilteritinib (Figure S6). FGF2 or FL did not restore the pre-treatment metabolic phenotype, but rather revealed distinct adaptations, indicating the influence of the microenvironment on metabolism(Ye et al., 2020, Savino et al., 2020, van Gastel et al., 2020, Forte et al., 2020) (Figure 4). FGF2 late cultures displayed altered sphingolipid metabolism whereas FL late cultures preferentially utilized carnitine/fatty acid metabolism (Figure 4D-I). While these particular patterns were present in early resistance, they became more pronounced with the expansion of NRAS mutations in late resistance, suggesting that specific subpopulations may have distinct metabolism that provides a selective advantage in the absence of ligand. Further single cell studies are needed to examine metabolic heterogeneity and explore when and how such rewiring occurs, however targeted proteomics of primary samples indicate that changes in metabolism can be detected after 1–2 months in vivo (Figure 7B-C), which is consistent with our in vitro model. Consistent with our studies, alteration of metabolism with drug resistance in AML has been reported previously(van Gastel et al., 2020, Stevens et al., 2020, Jones et al., 2020, Farge et al., 2017, Pei et al., 2020). In particular, leukemia stem cells (LSCs) primarily rely on OXPHOS(Lagadinou et al., 2013, Jones et al., 2018), but the source of energy varies in the setting of resistance(Pei et al., 2020, Jones et al., 2020, Stevens et al., 2020). Similar findings from our study bring to light the evolution of a unique metabolism that develops with resistance to gilteritinib.
In conclusion, our stepwise, non-stochastic model of gilteritinib resistance recapitulates clinical resistance and provides a novel framework to interpret the evolution of resistance. A number of therapeutic strategies to overcome resistance can be proposed from our work. Targeting NRAS mutations that confer late gilteritinib resistance offers one potential approach for combination therapy, as both MEK and PI3K inhibitors partially restored gilteritinib efficacy (Figure 3F-J). These combinations have been proposed in AML(Traer et al., 2016, McMahon et al., 2019, Zhang et al., 2019, Zhang et al., 2020) and other cancers(Tricker et al., 2015, Smida et al., 2016, Morgillo et al., 2017). However, not all patients treated with gilteritinib develop RAS mutations(Perl et al., 2019), and it is unclear if the addition of these inhibitors would forestall the expansion of RAS mutations or drive early resistant cells to adopt alternative resistance mechanisms. Therefore, targeting unique sensitivities in early resistance may be more effective. While targeting metabolic dependencies of early resistant cells is appealing, the plasticity seen in our model and that of others(Pei et al., 2020, Jones et al., 2020, Chen et al., 2020, Forte et al., 2020, Stevens et al., 2020, van Gastel et al., 2020) suggests that targeting only one metabolic vulnerability may be insufficient. The lack of potent small-molecule inhibitors of metabolism is another limitation, as we tested numerous metabolic inhibitors but they tended to work only at very high concentrations (data not shown). In contrast, our early resistant cultures and primary early resistant AML cells were all exquisitely sensitive to the combination of AZD2811 and gilteritinib (Figure 7E) irrespective of their unique metabolic profiles. Exploiting this unique vulnerability of early resistance may therefore thwart multiple mechanisms of late resistance and improve the durability of response to gilteritinib.
STAR METHODS:
RESOURCE AVAILABILITY
Lead Contact
Further information and requests for resources and reagents should be directed to and will be fulfilled by the Lead Contact, Elie Traer (traere@ohsu.edu).
Materials Availability
This study did not generate new unique reagents.
Data and Code Availability
All datasets generated from this study have been deposited in publicly available repositories. The whole exome sequencing (WES) datasets generated during this study are available at NCBI Sequence Read Archive (Accession Code - PRJNA666471). CRISPR-Cas datasets generated during this study are available at NCBI GEO (Accession Code - GSE158717). RNA-Sequencing data generated during this study is available at NCBI GEO (Accession Code - GSE168583). Proteomics and phosphoproteomics on cell lines generated during this study are available via https://cptac-data-portal.georgetown.edu/cptacPublic/. Targeted proteomics data from clinical samples is available at https://panoramaweb.org/PNNL-PTRC.url (Email: panorama+ptrc@proteinms.net; Password: fWiTRFmK).
Information on accessing data is also provided in the Key Resources Table.
KEY RESOURCES TABLE
| REAGENT or RESOURCE | SOURCE | IDENTIFIER |
|---|---|---|
| Antibodies | ||
| Phospho-Akt (Ser473) | Cell Signaling Technology | Cat#9271S; RRID:AB_329825 |
| Akt | Cell Signaling Technology | Cat#9272S; RRID:AB_329827 |
| Phospho-p44/42 MAPK (Erk1/2) (Thr202/Tyr204) | Cell Signaling Technology | Cat#9101S; RRID:AB_331646 |
| p44/42 MAPK (Erk1/2) | Cell Signaling Technology | Cat#9102S; RRID:AB_330744 |
| Phospho-Stat5 (Tyr694) | Cell Signaling Technology | Cat#9351S; RRID:AB_2315225 |
| Total Stat5 | Cell Signaling Technology | Cat#25656S; RRID:AB_2798908 |
| Phospho-FLT3 (Tyr589/591) | Cell Signaling Technology | Cat#3464S; AB_2107051 |
| Phospho-FLT3 (Tyr842) | Cell Signaling Technology | Cat#4577S; RRID:AB_916078 |
| Phospho-FLT3 (Tyr969) | Cell Signaling Technology | Cat#3463S; RRID:AB_823453 |
| Total FLT3 | Cell Signaling Technology | Cat#3462S; RRID:AB_2107052 |
| FGFR1 | Cell Signaling Technology | Cat#9740S; RRID:AB_11178519 |
| FGF2 | Santa Cruz Technologies | Cat#SC-79; RRID:AB_631497 |
| FL | ABCAM | Cat#AB52648; RRID:AB_2104974 |
| GAPDH | Thermo Fisher | Cat#AM4300; RRID:AB_437392 |
| IRDye 800CW Goat anti-Rabbit IgG | LICOR | Cat#926–32211; RRID:AB_621843 |
| IRDye 680RD Goat anti-Mouse IgG | LICOR | Cat#926–68070; RRID:AB_10956588 |
| anti-Ki67-Alexa647 | Biolegend | Cat#350510; RRID:AB_10900821 |
| Biological Samples | ||
| Patient AML cells | LLS Beat AML gilteritinib trial (NCT03013998, S8 sub-study) | |
| Patient stromal cells | LLS Beat AML gilteritinib trial (NCT03013998, S8 sub-study) | |
| Chemicals, Peptides, and Recombinant Proteins | ||
| Human FLT3 | PeproTech | Cat#300–19 |
| Human FGF2 | PeproTech | Cat# 100–18B |
| Gilteritinib | Selleck Chemicals | Cat#S7754 |
| AZD2811 | AztraZeneca | N/A |
| Critical Commercial Assays | ||
| DNeasy Blood & Tissue Kit | Qiagen | Cat#69506 |
| ddPCR NRASG12D assay | BioRad | Cat# dHsaMDV2010095 |
| ddPCR NRASG12S assay | BioRad | Cat# dHsaMDV2010093 |
| QuikChange II XL kit | Agilent Technologies Inc. | Cat#200522 |
| Seahorse XF Long Chain Fatty Acid Oxidation Stress Test Kit | Agilent Technologies Inc. | Cat#103672–100 |
| miRNeasy Mini Kit | Qiagen | Cat#217004 |
| EasySep™ Human CD33 Positive Selection Kit II | StemCell Technologies | Cat#17876 |
| EasySep™ Human CD34 Positive Selection Kit II | StemCell Technologies | Cat#17856 |
| Deposited Data | ||
| Whole exome sequencing of MOLM14 & MV4;11 late gilteritinib resistant cultures | This paper | NCBI Sequence Read Archive: PRJNA666471 |
| CRISPR/Cas9 screening of early and late gilteritinib resistant MOLM14 cells | This paper | NCBI GEO: GSE158717 |
| Proteomics & Phosphoproteomics on parental, acute treatment, and early & late gilteritinib resistant MOLM14 & MV4;11 cultures | This paper | https://cptac-data-portal.georgetown.edu/cptacPublic/ |
| Targeted proteomics on AML patient samples | This paper | https://panoramaweb.org/PNNL-PTRC.url |
| Early gilteritinib resistant RNA-SEQ vs. acute gilteritinib treatment (48 hour) | This paper | NCBI GEO: GSE168583 |
| Experimental Models: Cell Lines | ||
| MOLM-14 | Yoshinobu Matsuo Lab | |
| MV4;11 | ATCC | Cat#CRL-9591 |
| HEK 293T/17 | Brian Druker Lab | |
| Early and late gilteritinib resistant MOLM14 and MV4;11 cell lines | This paper | |
| Oligonucleotides | ||
| Single CRISPR guides listed in Supplemental Table 5 | ||
| Recombinant DNA | ||
| pLenti CMV GFP DEST 736–1 | Addgene | Cat#19732 |
| pLentiCRISPRv2 | Addgene | Cat#52961 |
| psPAX2 | Addgene | Cat#12260 |
| lentiCas9-Blast | Addgene | Cat#52962 |
| Yusa CRISPR library | Addgene | Cat#67989 |
| Software and Algorithms | ||
| Flowjo v10 | Flowjo | |
| Metaboanalyst | https://www.metaboanalyst.ca | |
| Cytoscape | https://cytoscape.org | |
| WebGestalt | http://www.webgestalt.org | |
| PRISM v8 | Prism | |
| Reactome | https://reactome.org | |
| Other | ||
EXPERIMENTAL MODEL AND SUBJECT DETAILS
Cell lines
Human MOLM14 cells were generously provided by Dr. Yoshinobu Matsuo (Fujisaki Cell Center, Hayashibara Biochemical Labs, Okayama, Japan). Human MV4;11 cells were purchased from ATCC (Manassas, VA). MOLM14 and MV4;11 cell lines were grown in RPMI (Life Technologies Inc., Carlsbad, CA) supplemented with 10% FBS (Atlanta Biologicals, Flowery Branch, GA), 2% L-glutamine, 1% penicillin/streptomycin (Life Technologies Inc.), and 0.1% amphotericin B (HyClone, South Logan, UT). Authentication was performed on all cell lines used in this study at the OHSU DNA Services Core facility.
Clinical samples
All clinical specimens utilized in this study were collected with informed consent from patients with AML according to the Beat AML clinical trial protocol approved by the Western IRB and local institutional IRBs (Study of Biomarker-Based Treatment of Acute Myeloid Leukemia, NCT01728402, Dr. Traer is PI of S8 arm). Newly diagnosed elderly AML patients with activating FLT3 mutations were treated with gilteritinib as single agent for a month. If the percentage of leukemia cells remained < 5% in their marrow after 1 month, patients could continue gilteritinib monotherapy. Patients with > 5% leukemia cells in their marrow had decitabine added to their therapy. Frozen mononuclear cells from paired pre-treatment and on-gilteritinib treatment (early resistant) patient samples (N = 12) were thawed with DNase I (100 μg/mL; Stem Cell Technologies Inc., Cambridge, MA) and counted. CD33+ and CD34+ isolation was performed using EasySep Human CD33 and CD34 Positive Selection II Kits (Stem Cell Technologies Inc.) using the manufacturer’s protocol. Following isolation, samples were counted and flash frozen for targeted proteomics or used for ex vivo inhibitor testing as described below.
METHOD DETAILS
Generation of ligand-dependent (early) and -independent (late) gilteritinib resistant cell lines
To establish resistant cultures, 10 million MOLM14 or MV4;11 cells were treated with 100 nM of gilteritinib (Selleck Chemicals, Houston, TX) in media alone (N = 4) or in media supplemented with 10 ng/mL of FGF2 (N = 4) or FLT3 ligand (N = 4, FL; PeproTech Inc., Rocky Hill, NJ). All cultures were maintained in 10 mL of media. Every 2 or 3 days, recombinant ligands and gilteritinib were replaced and cell viability was evaluated using the Guava personal flow cytometer (Millipore Inc., Burlington, MA). Following ligand withdrawal, gilteritinib and media were similarly replenished and viability was monitored every 2 to 3 days. A list of all generated resistant cell lines is available in Table S1. All cell lines were tested for mycoplasma on a monthly schedule.
Immunoblotting
Ten million from MOLM14 parental and gilteritinib resistant cell lines were spun down and lysed with 50 μL of Cell Lysis Buffer (Cell Signaling Technologies Inc., Danvers, MA) containing a Complete Mini Protease Inhibitor Cocktail Tablet, Phosphatase Inhibitor Cocktail 2, and phenylmethanesulfonyl fluoride (PMSF) solution (Sigma-Aldrich Inc., St Louis, MO) and clarified by centrifugation at 14,000 g, 4 °C for 15 minutes. Protein was quantified using a bicinchoninic acid (BCA) assay (ThermoFisher Scientific Inc., Waltham, MA). 50 μg of each protein lysate was loaded on NuPAGE 4–12% Bis-Tris gradient gels (ThermoFisher Scientific Inc.), transferred on Immobilon-FL PVDF membranes (Millipore Inc.), and blocked for 1 hour. Following overnight incubation with primary antibody at 4 °C, the membrane s were washed and probed with fluorescent IRDye 800CW goat anti-rabbit IgG and IRDye 680RD Goat anti-mouse IgG antibodies (1:15,000; LI-COR Biosciences, Lincoln, NE). The membranes were then imaged with the Odyssey Infrared Imaging System (LI-COR Biosciences).
Whole Exome Sequencing
Genomic DNA for all cell lines was extracted using the DNeasy Blood & Tissue Kit (Qiagen Inc., Germantown, MD) according to the manufacturer’s protocol. High throughput sequencing was performed on all MOLM14 and MV4;11 parental and late/ligand-independent gilteritinib resistant cell lines. Paired-end 100 base reads were generated using the Illumina HiSeq 2500 (Illumina Inc., San Diego, CA) for parental and gilteritinib resistant cell lines after capture with the Nextera DNA Exome kit v1.2. These data are publicly available at the Short Read Archive (PRJNA666471). Each sample was pre-processed using GATK 4.1(McKenna et al., 2010) including alignment to build 37 (GRCh37) of the human genome using BWA(Li, 2013). Raw mutations were called for all replicates relative to the parental cell lines using MuTect2. The mutations were annotated using the Variant Effect Predictor v99.1(McLaren et al., 2016). The final set of mutations were: selected after limiting to those that passed filter, predicted to have a non-synonymous change or indel, seen in less than 1% of GNOMAD(Karczewski et al., 2020), and had at least 5 reads with a tumor variant allele frequency (VAF) of greater than 8%. Mutations were further manually curated excluding known problematic genes/mutations and adding back in a low frequency (VAF: 0.067) NRAS p.G12D for sample MOLM14 FL Late (R-2). All NRAS and FLT3 mutations were confirmed by Sanger sequencing with the following primers (5’->3’):
FLT3 F691L/N701K forward primer: ACCCACAGACTTCACGGTGCCT
FLT3 F691L/N701K reverse primer: TCAGCAGAGAACCAAGCCCTCC
NRAS G12D/G12S forward primer: GCATAGTGTTCGGCTTTGGG
NRAS G12D/G12S reverse primer: AGTCTCGCTACTATGGCCTG
NRAS G13D forward primer: AGGATCAGGTCAGCGGGCTACC
NRAS G13D forward primer: GCGGGGGTCCTTCCATTTGGTG
NRAS Q61H forward primer: ACTCTGGTTCCAAGTCATTCCCA
NRAS Q61H forward primer: TGAACTTCCCTCCCTCCCTGCC
Sequencing was performed using Eurofins (Louisville, KY) and analyzed using Sequencher and DNASTAR software.
Droplet Digital PCR
Digital Droplet PCR (ddPCR) reactions (20 μL) were prepared with 2X dUTP-free ddPCR supermix (Bio-Rad Laboratories Inc., Hercules, CA), 20X NRAS mutant (FAM) and wildtype (HEX) primer/probe set, and purified genomic DNA that contained approximately 60,000 copies (~200 ng) of NRAS. The following commercially available assays were validated and utilized: NRASG12D (dHsaMDV2010095) and NRASG12S (dHsaMDV2010093). To determine the limit of detection, known mutant NRASG12D or NRASG12S plasmids were titrated with NRASWT plasmid. For all MOLM14 parental (N = 3) and resistant cell lines (N = 4 for FGF2-derived, N = 4 for FL-derived), genomic DNA was isolated at 0, 2, 5.5, and 8.5 months. The ddPCR reaction mixture and droplet generation oil were transferred to the Droplet Generator DG8 Cartridge (Bio-Rad Laboratories Inc.) and droplets were generated with QX200 ddPCR Droplet Generator (Bio-Rad Laboratories Inc.). Droplets were transferred to a 96-well PCR plate, heat-sealed, and placed in the C1000 Touch™Thermo Cycler (Bio-Rad Laboratories). Cycling conditions were as follows: 95°C for 10 min, 40 cycles of 94°C for 30 sec, 55°C for 1 min followed by 98°C for 10 min (ramp rate 2°C/sec). Results were analyzed and visualized by QuantaSoft™ software to determine variant allele frequency. All biological replicates were merged in downstream analysis.
Site-Directed Mutagenesis
All NRAS (G12D and G12S) mutations were introduced by site-directed mutagenesis using the QuikChange II XL kit (Agilent Technologies Inc., Santa Clara, CA) with the following primers (5’->3’):
NRAS G12D forward primer: GCTTTTCCCAACACCATCTGCTCCAACCACCAC
NRAS G12D reverse primer: GTGGTGGTTGGAGCAGATGGTGTTGGGAAAAGC
NRAS G12S forward primer: CTTTTCCCAACACCACTTGCTCCAACCACCACC
NRAS G12S reverse primer: GGTGGTGGTTGGAGCAAGTGGTGTTGGGAAAAG
Mutagenesis primers were designed using the QuikChange Primer Design Program available through Agilent and purchased from Eurofins. Constructs were verified by Sanger sequencing with primers listed above.
Lentivirus production and transduction
HEK 293T/17 cells were transfected using Lipofectamine-2000 (Life Technologies Inc.) with single transfer vectors in combination with packaging plasmids, psPAX2 (Addgene, #12260) and VSVG (Life Technologies Inc.). The following transfer vectors were obtained from Addgene: pLenti CMV GFP DEST 736–1 (#19732) and pLentiCRISPRv2 (#52961). NRAS WT, G12D, and G12S plasmids were made with the CMV GFP backbone. Viral supernatants were collected, filtered through 0.45 μM filters, and used for transduction as previously described(Nechiporuk et al., 2019). Briefly, 0.5–1 mL of supernatant was spinoculated with 1×10⁶ cells in 2 mL of growth media in the presence of 10 mM Hepes (ThermoFisher Scientific Inc.) and 8 μg/ml of Polybrene (Santa Cruz Biotechnology, Dallas, TX.) using a six-well format. Centrifugation was carried out at 2600 rpm for 2 hrs at 35°C. Infected cells from either library or single guide RNAs were selected with appropriate antibiotics, (puromycin, 2 μg/ml or blasticidin, 10 μg/ml), for 5–7 days to achieve stable integration. Cells were used for downstream assays following 2–3 weeks post-transduction.
CRISPR-Cas9 resensitization screening & single gene inactivation by individual sgRNAs
Early and late gilteritinib resistant Cas9-expressing cells were generated using lentiCas9-Blast (Addgene, #52962). Loss-of-function screens were performed using the Kosuke Yusa(Tzelepis et al., 2016) human genome-wide sgRNA library purchased from Addgene (#67989), as described(Nechiporuk et al., 2019), targeting 18,010 genes with 90,709 sgRNAs (average of 5 guides per gene). High titer lentivirus was generated using standard calcium phosphate precipitation procedures in HEK 293T/17 cells. Viral supernatant was concentrated and the titer was determined using a viral titration kit (ABM good, Canada).
100 million cells were used for viral transduction at MOI 0.3 using the above spinoculation protocol, selected with puromycin for 5–7 days to ensure stable viral integration. 5 million cells were collected to ensure library representation and overall cultures were grown to 120 million. 30 million transduced cells were separated in individual flasks and treated with DMSO or 100 nM of gilteritinib, in duplicate, for 14–21 days. For screens on early gilteritinib resistant Cas9-expressing cells, screen cultures were maintained in 10 ng/mL of FGF2 or FL, respectively. 20–30 million cells were collected at each time point from each sample to ensure 300X representation of the library. Early and Late CRISPR PCR-amplified barcode libraries were generated as previously described(Nechiporuk et al., 2019) and deep sequencing was performed on the NovaSeq and HiSeq 2500, respectively (Illumina Inc.). These data are available at GEO (GSE158717).
The 100 base reads were trimmed leaving only the sgRNA sequences using cutadapt(Martin, 2011). Alignments were performed with Bowtie2 relative to the database of sgRNA sequences requiring unique matches(Langmead and Salzberg, 2012). Read counts were then generated per sgRNA using MaGeCK count(Li et al., 2014). EdgeR was run after first filtering out lowly-represented sgRNAs (those not seen in the plasmid or those with ≤ 100 counts per million in more than half the samples of the comparison) generating log2 fold changes (gilteritinib treatment vs DMSO) and 2-sided P-values per sgRNA. The sgRNA-level statistics were summarized to gene-level by selecting the sgRNA with the middle P-value as a representative. Robust Rank Aggregation (RRA) was performed for both early and late gilteritinib resensitization screens after ranking genes by their mid P-value(Kolde et al., 2012). For the early CRISPR screens, as no overlapping genes were found, genes were prioritized using constituent sgRNA significance (median p value < 0.05) and average log fold change focusing on genes involved in metabolism, cell cycle alterations, MAPK or PI3K/AKT pathways.
Inactivation of individual genes was carried out by cloning sgRNAs into plentiCRISPRv2 (Addgene, #52961) per manufacturer’s suggestion. All sgRNAs used in this study are provided in Table S5. GraphPad Prism 8 was used to model dose-specific, normalized cell viability values with 4-parameter logistic regression curves to determine IC50s.
Small-molecule inhibitor screening and analysis pipeline
Small-molecule inhibitors, purchased from LC Laboratories Inc. (Woburn, MA), MedChemExpress (Monmouth Junction, NJ), and Selleck Chemicals (Houston, TX) were reconstituted in DMSO and stored at −80°C. Cells were seeded into 384-well assay plates using a Multidrop™ Combi Reagent Dispenser (ThermoFisher Scientific Inc.) at a density of 1,000 cells/well in 50 μL of RPMI media supplemented with 10% fetal bovine serum, 2% L-glutamine, 1% penicillin-streptomycin, and 0.1% amphotericin B. For inhibitor screening with early resistance cell lines, the media was supplemented with 10 ng/mL of FGF2 or FL, respectively. Inhibitors were dispensed into the plates with an HP D300e Digital Dispenser (Tecan, Mannedorf, Switzerland). A 7-point inhibitor dilution series was utilized with 2-fold or 3-fold concentration increments between adjacent doses. The final concentration of DMSO was ≤ 0.1% in all wells. All conditions were plated with at least three replicates. Each plate also included at least 32 “no cell” media-only wells as a negative control and 10 untreated wells utilized as a positive control. After three days of culture at 37°C in 5% CO2, cell viability was inferred using a methanethiosulfonate (MTS)-based assay (CellTiter96 Aqueous One Solution; Promega) and absorbance (490 nm) was read between 3 to 24 hours after adding MTS reagent using a BioTek Synergy 2 plate reader (BioTek, Winooski, VT). MTS absorbances of inhibitor-treated wells were normalized to those of untreated cells.
For experiments with multiple MTS read times, the following quality control (QC) metrics were considered in choosing the optimal read time for analysis: positive to negative control well ratio, percentage of inhibitor wells with an absorbance value less than the negative control average, percentage of inhibitor wells with an absorbance value greater than the positive control average, and the median inhibitor- and dose-specific coefficient of variation (CV) computed on same-plate replicates. To enhance reliability of results, an inhibitor tested on a specific plate was excluded if had a raw absorbance median CV (across the 7 doses) greater than 10%. Entire experiments were discarded before inhibitor efficacy analysis and subsequently rerun if pre-MTS microscopic plate inspection or post-MTS QC parameters (including the above-mentioned metrics as well as the average difference in absorbance between positive and negative control wells and the negative control well CV) were deemed unreliable.
To allow inhibitor efficacy comparisons across plates and experiments, raw absorbance values in inhibitor wells were normalized to a plate’s negative and positive controls (specifically, by subtracting the plate’s average absorbance value for media-only wells, dividing by the plate’s average absorbance value for untreated wells not on the plate edge, multiplying by 100, and bounding the resulting percentage at 0 and 100). These cell viability percentages were then averaged across the same-plate replicates at the inhibitor-specific dose level with standard errors of the mean computed for graphical display. Linear interpolation between observed dose-response values (i.e., log10-concentration on x-axis and normalized, replicate-averaged cell viability on y-axis) was employed to fit a line to each 7-point small-molecule inhibitor profile. The half-maximal inhibitory concentration (IC50) and area under the curve (AUC) were derived from this line and used to quantify inhibitor effect. Fitted lines that did not intersect 50% cell viability were given an IC50 equal to the minimum or maximum drug concentration depending on if the entire line was below or above 50%, respectively. Since concentration ranges and dilution increments could vary by inhibitor, raw AUC values were transformed to percentages of the maximum possible AUC to improve interpretability. Summary of small-molecule inhibitor screening results is available in Tables S2.
Metabolomics
High throughput metabolomics analysis was performed on frozen cell pellets from MOLM14 parental, short-term treated (48 hour), early, and late gilteritinib resistant cell lines at the University of Colorado School of Medicine Metabolomics Facility, a shared resource of the University of Colorado Cancer Center. Metabolites from frozen pellets were extracted at 2e6 cells per mL using ice cold 5:3:2 methanol:acetonitrile:water (v/v/v) with vigorous vortexing at 4oC followed by centrifugation as described(Nemkov et al., 2017). Clarified supernatants were analyzed (10 μL per injection) by ultra-high-pressure liquid chromatography coupled to mass spectrometry on a Vanquish UHPLC (ThermoFisher Scientific Inc.) coupled to a Q Exactive mass spectrometer (ThermoFisher Scientific Inc.) in positive and negative ion modes (separate runs). The UHPLC utilized a 5 min C18 gradient at 450 μL/min; eluate was introduced to the MS via electrospray ionization as previously described in detail(Nemkov et al., 2019). Profiling of acylcarnitines was performed using a 15 min positive ESI method as described(Reisz et al., 2019). Data analysis and quality control measures were performed as described(Nemkov et al., 2017, Gehrke et al., 2019). Resulting data was analyzed using MetaboAnalyst 4.0, heat maps generated using GENE-E (Broad Institute), and individual metabolites plotted using GraphPad Prism 8.0. For PLS-DA shown in Figure 4C, data was first normalized to a pooled sample from the parental group and autoscaled in MetaboAnalyst 4.0. Data from Principal Component Analysis (PCA) in Figure S8B was first normalized to median and autoscaled in MetaboAnalyst 4.0. Complete metabolite data is presented in Table S3.
Seahorse assays
To measure changes in OXPHOS following etomoxir treatment, we used the Seahorse XF Long Chain Fatty Acid Oxidation Stress Test Kit (Agilent Technologies Inc., 103672–100) according to the manufacturer’s protocol. MOLM14 parental and gilteritinib resistant cell lines were cultured in substrate-limited growth media (with final concentrations of 0.5 mM carnitine, 0.5 mM glucose, 1 mM glutamine, and 1% fetal bovine serum) overnight before performing assay.
Proteomics & phosphoproteomics on cell lines
Protein extraction and digestion
Parental (N = 4) and gilteritinib early (N = 4/ligand) and late (N = 4/ligand) resistant cell lines were washed three times with PBS to remove any trace of fetal bovine serum, pelleted, and flash frozen. All samples were processed in 3 batches of 22 samples. Fresh lysis buffer was prepared for each batch containing 8 M urea (Sigma-Aldrich Inc.), 50 mM Tris pH 8.0, 75 mM sodium chloride, 1 mM ethylenediamine tetra-acetic acid, 2 μg/mL Aprotinin (Sigma-Aldrich Inc.), 10 μg/mL Leupeptin (Roche Inc., Pleasanton, CA), 1 mM PMSF in EtOH, 10 mM sodium fluoride, 1% of phosphatase inhibitor cocktail 2 and 3 (Sigma-Aldrich Inc.), 20 μM PUGNAc, and 0.01 U/μL Benzonase. After adding 500 μL of chilled lysis buffer, the samples were vortexed for 10 seconds and then placed in thermomixer set for 15 minutes at 4°C and 800 rpm. The lysis step was repeated by vortexing samples for an additional 10 seconds and incubating for 15 minutes utilizing the same settings. After incubation, the samples were centrifuged for 10 minutes at 4°C and 18000 rcf to remove cell debris. Following centrifugation, the protein supernatant was transferred to a fresh tube. A BCA assay (ThermoFisher Scientific Inc.) was performed on the supernatant to determine protein yield.
Protein concentrations were normalized based on the BCA assay before the entire sample was reduced with 5 mM dithiothreitol (DTT) (Sigma-Aldrich Inc.) for 1 hour at 37°C and 800 rpm. Reduced cysteines were alkylated with 10 mM iodoacetamide (Sigma-Aldrich Inc.) for 45 minutes at 25°C and 800 rpm in the dark. The sample was diluted four-fold with 50 mM Tris HCl pH 8.0 and then initially digested with Lys-C (Wako Chemicals, Richmond, VA) at a 1:20 enzyme:substrate ratio, followed by an incubation for 2 hours at 25°C, shaking at 800 rpm. Following the initial digest, trypsin (Promega, Madison, WI) was added at a 1:20 enzyme:substrate ratio, followed by a 14-hour incubation set at 25°C and 800 rpm. The sample was quenched by adding formic acid (FA) to 1% and centrifuged for 15 minutes at 1500 rcf to remove any remaining cell debris. The peptides were desalted using a C18 solid phase extraction (SPE) cartridge (Waters Sep-Pak, Milford, MA). Global samples were vialed at 0.1 μg/μL and remaining peptides were pooled with previously cleaned peptides from previous experiment and aliquoted for TMT isobaric labeling (ThermoFisher Scientific Inc.).
TMT labeling
The samples were divided into four tandem mass tag-11 (TMT-11) plex sets, each with approximately 3 mg of total peptides. After drying down, each sample was reconstituted with 50 mM HEPES, pH 8.5 to a concentration of 5 μg/μL. Each isobaric tag aliquot was dissolved in 250 μL anhydrous acetonitrile to a final concentration of 20 μg/μL. The tag was added to the sample at a 1:1 peptide:isobaric label ratio and incubated in thermomixer for 1 hour at 25°C and 400 rpm and then diluted to 2.5 mg/mL with 50 mM HEPES pH 8.5, 20% acetonitrile (ACN). Finally, the reaction was quenched with 5% hydroxylamine and incubated for 15 minutes at 25°C and 400 rpm. The samples were then combined per each plex set and concentrated in a speed-vac before a final C18 SPE cleanup. Each 11-plex experiment was fractionated into 96 fractions by basic pH reversed phase liquid chromatography (bRPLC) separation, followed by concatenation into 12 global fractions for MS analysis(Wang et al., 2011, Dou et al., 2020).
Phosphopeptide enrichment using immobilized metal affinity chromatography (IMAC)
Six samples per plex were created by concatenation from the 12 global TMT fractions. Fe3+-NTA-agarose beads were freshly prepared for phosphopeptide enrichment using the Ni-NTA-agarose beads (Qiagen Inc.). Sample peptides were reconstituted to a 0.5 μg/μL concentration with 80% ACN, 0.1% TFA and incubated with 40 μL of the bead suspension for 30 minutes at RT in a thermomixer set at 800 rpm. After incubation the beads were washed with 100 μL 80% ACN, 0.1% TFA and 50 μL 1% FA to remove any non-specific binding. Phosphopeptides were eluted off beads with 210 μL 500 mM K2HPO4, pH 7.0 directly onto C18 stage tips and eluted from C18 material with 60 μL 50% ACN, 0.1% FA. Samples were dried in speed-vac concentrator and reconstituted with 12 μL of 3% ACN, 0.1% FA.
Liquid Chromatography (LC) coupled to tandem MS analysis
Proteomic fractions were separated using a Waters nano-Aquity UPLC system (Waters Inc.) equipped with a in-house 75 um I.D. x 25 cm length C18 column packed with 1.9 um ReproSil-Pur 120 C18-AQ (Dr. Maisch GmbH). A 100-minute gradient of 95% mobile phase A (0.1% (v/v) formic acid in water) to 19% mobile phase B (0.1% (v/v) FA in ACN) was applied to each fraction. The system was coupled to a Thermo Orbitrap Fusion Lumos mass spectrometer for MS/MS analysis. MS Spectra were collected from 350 to 1800 m/z at a mass resolution setting of 60,000. A top speed method was used for the collection of MS2 spectra at a mass resolution of 50K. An isolation window of 0.7 m/z was used for higher energy collision dissociation (HCD), singly charged species were excluded, and the dynamic exclusion window was 45 seconds.
TMT global proteomics data processing
All 60 Thermo.raw files were processed using mzRefinery to correct for mass calibration errors, and then spectra were searched with MS-GF+ v9881(Gibbons et al., 2015, Kim and Pevzner, 2014, Kim et al., 2008) to match against the RefSeq human protein sequence database downloaded on June 29, 2018 (hg38; 41,734 proteins), combined with 264 contaminants (e.g., trypsin, keratin). A partially tryptic search was carried out with a ± 20 ppm parent tolerance, allowed for isotopic error in precursor ion selection, and searched a decoy database composed of the forward and reversed protein sequences. MS-GF+ considered static carbamidomethylation (+57.0215 Da) on Cys residues and TMT modification (+229.1629 Da) on the peptide N terminus and Lys residues, and dynamic oxidation (+15.9949 Da) on Met residues. The resulting peptide identifications were filtered to a 1% false discovery rate at the unique peptide level. A sequence coverage minimum of 6 per 1000 amino acids was used to maintain a 1% FDR at the protein level after rollup by parsimonious inference.
The intensities TMT 11 reporter ions were extracted using MASIC software(Monroe et al., 2008). Extracted intensities were then linked to peptide-spectrum matches passing the confidence thresholds described above by scan number. The reporter ion intensities from different scans and different bRPLC fractions corresponding to the same gene were grouped. Relative protein abundance was calculated as the ratio of sample abundance to reference channel abundance using the summed reporter ion intensities from peptides that could be uniquely mapped to a gene. The relative abundances were log2 transformed and zero-centered for each gene to obtain final relative abundance values.
TMT phosphoproteomics data processing
The 30.raw files generated from enriched IMAC fractions were used for phosphopeptide identification as in the global proteome data analysis described above with an additional dynamic phosphorylation (+79.9663 Da) modification on Ser, Thr, or Tyr residues. The phosphoproteome data were further processed with the Ascore algorithm(Beausoleil et al., 2006) for phosphorylation site localization, and the top-scoring assignments were reported. For phosphoproteomic datasets, the quantitative data were not summarized by protein, but analyzed at the peptide sequence level. Because all peptides are labeled simultaneously, all technical biases upstream of labeling are assumed to be identical between global and phosphoproteomics datasets. Thus, to account for sample-specific biases in the phosphoproteome analysis, we applied the same correction factors derived from median-centering of the global proteomic dataset for normalization.
Data visualization, KSEA, & CausalPath analyses
PCA visualization was carried out using custom R scripts and packages from the Bioconductor project(Gentleman et al., 2004). Plots were created using all proteins (phosphopeptides for phospho) with abundance ratios measured across all samples in the dataset. We used the Kinase Substrate Enrichment Analysis (KSEAapp) R package to infer kinase activity changes between early and late resistant MOLM14 and MV4;11 cells and their parental cell lines(Wiredja et al., 2017, Casado et al., 2013). We selected those kinases with significantly (p < 0.05) altered activity for visualization in Figure 5. Our analysis can be found on GitHub.
CausalPath was used to identify potential cause-effect relations between proteomic changes (global and phospho) by matching those changes with the signaling relations in pathway databases and checking the compatibility of the change directions with prior information in a site-specific manner. Readouts were compared using a T-test with 0.1 FDR threshold that was determined by the Benjamini-Hochberg method(Babur et al., 2018). The data label randomization feature of CausalPath was used to detect activated and inhibited proteins (0.1 FDR) based on the enrichment of their effects on the downstream network. Network diagrams were generated via ChiBE(Babur et al., 2010, Babur et al., 2014).
Cell cycle analysis
For each parental or gilteritinib resistant MOLM14 cell line, 1e6 cells were fixed in ice-cold 70% ethanol on ice for 20 minutes, washed in cold FACS buffer, and then stained with anti-Ki67 (BioLegend Inc, San Diego, CA) for 45 minutes on ice. After staining, cells were washed twice in FACS buffer and resuspended in FACS buffer containing 0.5 mg/mL PI dye. Cells were examined on BD LSRFortessa flow cytometer (BD Biosciences, San Jose, CA) and the results were analyzed in FlowJo version 9.
Targeted proteomics on AML patient samples
Protein digestion
Flash-frozen pre-treatment and early resistant patient samples (N = 12), following CD33+ and CD34+ isolation, were processed in a single batch to minimize technical variance. The digestion was carried out as described above for MOLM14 and MV4;11 cell line proteomics with the following modifications. The samples were lysed using 100 μL of chilled lysis buffer, and after incubation, placed in a magnetic rack to capture the magnetic beads before transferring the supernatant to new tubes. Peptide yield was determined by BCA assay (ThermoFisher Scientific Inc.), and 0.5 μg/μL aliquots were prepared for heavy peptide spike-in.
Stable isotope-labeled peptides
Proteotypic peptides for the target proteins were selected for targeted proteomics analysis based on well-accepted criteria(Lange et al., 2008), and the corresponding crude heavy stable isotope-labeled peptides were synthesized with 13C/15N on C-terminal lysine or arginine (New England Peptide, Gardner, MA). The heavy peptides were dissolved individually in 15% ACN and 0.1% FA at a concentration of 2 mM and used for creating a peptide mixture with a final concentration of 5 pmol/μL for each peptide.
Selected reaction monitoring (SRM) assay development
The heavy peptides in the peptide mixture were evaluated for peptide response and fragmentation pattern using LC-SRM. For each peptide, transition settings were as follows: (1) precursor charges: 2, 3 and 4; (2) ion charges: 1, 2 and 3; (3) ion type: y; and (4) m/z window: 250–1500. Transition lists were generated with optimal collision energy values by Skyline software (Version 20.1)(MacLean et al., 2010). LC-SRM was then used to evaluate all heavy peptides for stability of peptide retention time, reliable heavy peptides identification, transition interferences, and endogenous peptide detectability. In the end, 3 transitions per peptide were selected for the final assay configuration for targeted quantitation of a total of 244 peptides of the 123 target proteins.
LC-SRM
The digested patient samples were reconstituted in 2% ACN/0.1% FA and spiked with 5 fmol/μL heavy peptides for a final concentration of 0.25 μg/μL, and 2 μL of the resulting samples were analyzed by LC-SRM using a Waters nanoACQUITY UPLC system (Waters Inc.) coupled to a Thermo Scientific TSQ Altis triple quadrupole mass spectrometer (ThermoFisher Scientific Inc.). A 100 μm i.d. × 10 cm, BEH 1.7-μm C18 capillary column (Waters Inc.) was operated at a temperature of 44 ºC. The mobile phases were (A) 0.1% FA in water and (B) 0.1% FA in ACN. The peptide samples were separated at a flow rate of 400 nL/min using a 110-min gradient profile as follows (min:%B): 7:1, 9:6, 40:13, 70:22, 80:40, 85:95, 93:50, 94:95 and 95:1. The parameters of the triple quadruple instrument were set with 0.7 fwhm Q1 and Q3 resolution, and 1.2 s cycle time. Data were acquired in time-scheduled SRM mode (retention time window: 15 min).
Data analysis and visualization
SRM data were analyzed using the Skyline software (Version 20.1)(MacLean et al., 2010). The total peak area ratios of endogenous light peptides and their heavy isotope-labeled internal standards (i.e., L/H peak area ratios) were exported for quantitation(Tyanova et al., 2016). Peak detection and integration were carried out according to two criteria: (1) same retention time and (2) similar peak area ratios for the transitions. All data were manually inspected to ensure correct retention time, peak detection and accurate integration. After median centering normalization and student t-test, the significantly expressed proteins (N = 52) were determined by filtering with permutation-based false discovery rate control (q < 0.05)(MacLean et al., 2010). These normalized data were used for generation of heatmap and network diagram shown in Figure 7B-C.
RNA-Sequencing of acutely-treated (48 hr), early gilteritinib resistant MOLM14 cells, and AML patient stroma samples
MOLM14 parental cells treated with 100 nM of gilteritinib +/− 10 ng/mL of FGF2/FL for 48 hours served as acute treatment samples. Stromal cells from corresponding primary patient samples used in Figure 7A-C were grown in vitro(Traer et al., 2016, Javidi-Sharifi et al., 2019) and flash frozen for RNA isolation. RNA from all samples was isolated with the miRNeasy Mini Kit (Qiagen Inc.) according to the manufacturer’s protocol. RNA was run on a Bioanalyzer to assess quality. Libraries were prepared from total RNA using the TruSeq Stranded mRNA Kit (Illumina Inc.). Briefly, poly(A)+ was extracted using oligo-dT-coated beads, then fragmented by treatment with divalent cations and heat. Double stranded cDNA was then generated using random hexamer primers. Second strand synthesis was done with dUTP replacing dTTP to generate strand-specificity. The cDNAs were ligated to sequencing adapters and amplified using limited rounds of polymerase chain reaction. The libraries were quantified using real time PCR on an ABI StepOnePlus Real Time PCR Workstation (ThermoFisher Scientific Inc.) using a Kapa Library Quantification kit (Roche Inc.). Libraries were sequenced on a NovaSeq 6000 (Illumina Inc.). Fastq files were assembled using Bcl2Fastq (Illumina Inc.). The reads were aligned to Ensembl v75 gene models (GRCh37 build of the human genome) using Kallisto (v0.46.2). Gene-level counts were produced using tximport v1.18.0(Soneson et al., 2015) with the ‘lengthScaledTPM’ option. Differential expression was performed using the limma-trend v3.46.0 methodology(Law et al., 2014). Heatmaps were produced using ComplexHeatmap v2.6.2(Gu et al., 2016).
Ex vivo inhibitor sensitivity assay with primary AML samples
S8 clinical trial patients treated at Oregon Health and Science University (Study of Biomarker-Based Treatment of Acute Myeloid Leukemia, NCT01728402, Dr. Traer is PI of S8 arm) were also consented to local research protocol and these samples were used for ex vivo treatments in Figure 7 (IRB 4422). Frozen mononuclear cells from paired pre-treatment and on-gilteritinib treatment (early resistant) AML patient samples (N = 4 pairs) were thawed with HS-5 stromal conditioned medium and DNase I (100 μg/mL; Stem Cell Technologies Inc.). To remove dead cells, Ficoll gradient centrifugation was utilized and cells were thereafter cultured overnight in HS-5 stromal conditioned media supplemented with StemRegenin 1 (500 nM) and UM729 (1 μM, Stem Cell Technologies Inc.)(Pabst et al., 2014).
Isolated CD33+ and CD34+ cells were seeded into 384-well assay plates at 1,000 cells/well in 50:50 stromal conditioned media and RPMI-1640 media supplemented with fetal bovine serum (10%), L-glutamine, penicillin-streptomycin and antimycotic. Gilteritinib and AZD2811 were distributed in a 7-point concentration series ranging from 10 μM to 0.004 μM as single agents or in combination. The final concentration of DMSO was ≤ 0.1% in all wells. After 72 hours, viability was inferred with MTS reagent as described above (read times: 3 and 6 hours). Raw absorbance values were adjusted to a reference blank value, and then used to determine cell viability (normalized to untreated control wells to produce cell viability estimates). GraphPad Prism 8 was used to model dose-specific, normalized cell viability values with 4-parameter logistic regression curves to determine IC50s.
Supplementary Material
Highlights:
Stepwise model of early to late gilteritinib resistance recapitulates human disease.
Early resistant cells in marrow microenvironment rely on AURKB to resume growth.
Pre-existing NRAS mutations expand in Iate resistance and drive relapse.
Metabolic reprogramming occurs during evolution of gilteritinib resistance.
ACKNOWLEDGEMENTS:
We are grateful to our patients for their time and precious tissue samples. We thank Setareh Sharzehi, Jack Sumner, Massively Parallel Sequencing Shared Resource, and Flow Cytometry core for technical support; and Stephen Christy for organization of patient sample accrual. We thank Stephen E. Kurtz and TingTing Liu for helpful discussions, and Robert L. Raffai (UCSF) for critical review of the manuscript. AZD2811 was kindly provided by AstraZeneca. We thank the Clinical Proteomics Tumor Analysis Consortium (CPTAC) for their support with execution and analysis of all discovery and targeted proteomic studies. This work was supported by the American Cancer Society (MRSG-17–040-01-LIB), Hildegard Lamfrom Physician Scientist Award, and funding from the Leukemia & Lymphoma Society to ET, the CPTAC (U01CA214116 and U24CA210955), the Drug Sensitivity and Resistance Network (U54CA224019), and the Cancer Target Discovery and Development Network (U01CA217862) from the NCI to BJD, KDR, TL, and JWT. Additional funding was provided by the HHMI to BJD. SKJ is supported by the ARCS Scholar Foundation, The Paul & Daisy Soros Fellowship, and the NCI (F30CA239335). TN is supported by the NCI (R50CA251708). AD and JAR acknowledge support from the NCI (P30CA046934).
Footnotes
Publisher's Disclaimer: This is a PDF file of an unedited manuscript that has been accepted for publication. As a service to our customers we are providing this early version of the manuscript. The manuscript will undergo copyediting, typesetting, and review of the resulting proof before it is published in its final form. Please note that during the production process errors may be discovered which could affect the content, and all legal disclaimers that apply to the journal pertain.
DISCLOSURES OF POTENTIAL CONFLICTS OF INTEREST:
BJD potential competing interests – SAB: Aileron Therapeutics, Therapy Architects (ALLCRON), Cepheid, Vivid Biosciences, Celgene, RUNX1 Research Program, Novartis, Gilead Sciences (inactive), Monojul (inactive); SAB & Stock: Aptose Biosciences, Blueprint Medicines, EnLiven Therapeutics, Iterion Therapeutics, Third Coast Therapeutics, GRAIL (SAB inactive); Scientific Founder: MolecularMD (inactive, acquired by ICON); Board of Directors & Stock: Amgen, Vincera Pharma; Board of Directors: Burroughs Wellcome Fund, CureOne; Joint Steering Committee: Beat AML LLS; Founder: VB Therapeutics; Sponsored Research Agreement: EnLiven Therapeutics; Clinical Trial Funding: Novartis, Bristol-Myers Squibb, Pfizer; Royalties from Patent 6958335 (Novartis exclusive license) and OHSU and Dana-Farber Cancer Institute (one Merck exclusive license and one CytoImage, Inc. exclusive license)
ET potential competing interests – Advisory Board/Consulting: Abbvie, Agios, Astellas, Daiichi-Sankyo; Clinical Trial Funding: Janssen, Incyte, LLS BeatAML. Stock options: Notable Labs.
JWT potential competing interests – research support: Agios, Aptose, Array, AstraZeneca, Constellation, Genentech, Gilead, Incyte, Janssen, Petra, Seattle Genetics, Syros, Tolero and Takeda.
AD potential competing interests – founder: Omix Technologies, Inc and Altis Biosciences, LLC; Consultant: Hemanext Inc.
All other authors declare no potential competing interests.
Excel Supplemental Table Information
Supplemental Table 3. Level of all metabolites detected following short-term (48 hour) and long-term gilteritinib treatment (related to Figure 4 and Supplemental Figure 7).
REFERENCES:
- BABUR O, DOGRUSOZ U, CAKIR M, AKSOY BA, SCHULTZ N, SANDER C & DEMIR E 2014. Integrating biological pathways and genomic profiles with ChiBE 2. BMC Genomics, 15, 642. [DOI] [PMC free article] [PubMed] [Google Scholar]
- BABUR O, DOGRUSOZ U, DEMIR E & SANDER C 2010. ChiBE: interactive visualization and manipulation of BioPAX pathway models. Bioinformatics, 26, 429–31. [DOI] [PMC free article] [PubMed] [Google Scholar]
- BABUR Ö, LUNA A, KORKUT A, DURUPINAR F, SIPER MC, DOGRUSOZ U, ASLAN JE, SANDER C & DEMIR E 2018. Causal interactions from proteomic profiles: molecular data meets pathway knowledge. bioRxiv, 258855. [DOI] [PMC free article] [PubMed] [Google Scholar]
- BANELLI B, CARRA E, BARBIERI F, WURTH R, PARODI F, PATTAROZZI A, CAROSIO R, FORLANI A, ALLEMANNI G, MARUBBI D, FLORIO T, DAGA A & ROMANI M 2015. The histone demethylase KDM5A is a key factor for the resistance to temozolomide in glioblastoma. Cell Cycle, 14, 3418–29. [DOI] [PMC free article] [PubMed] [Google Scholar]
- BATTULA VL, LE PM, SUN JC, NGUYEN K, YUAN B, ZHOU X, SONNYLAL S, MCQUEEN T, RUVOLO V, MICHEL KA, LING X, JACAMO R, SHPALL E, WANG Z, RAO A, AL-ATRASH G, KONOPLEVA M, DAVIS RE, HARRINGTON MA, CAHILL CW, BUESO-RAMOS C & ANDREEFF M 2017. AML-induced osteogenic differentiation in mesenchymal stromal cells supports leukemia growth. JCI Insight, 2. [DOI] [PMC free article] [PubMed] [Google Scholar]
- BEAUSOLEIL SA, VILLEN J, GERBER SA, RUSH J & GYGI SP 2006. A probability-based approach for high-throughput protein phosphorylation analysis and site localization. Nat Biotechnol, 24, 1285–92. [DOI] [PubMed] [Google Scholar]
- BERTRAN-ALAMILLO J, CATTAN V, SCHOUMACHER M, CODONY-SERVAT J, GIMENEZ-CAPITAN A, CANTERO F, BURBRIDGE M, RODRIGUEZ S, TEIXIDO C, ROMAN R, CASTELLVI J, GARCIA-ROMAN S, CODONY-SERVAT C, VITERI S, CARDONA AF, KARACHALIOU N, ROSELL R & MOLINA-VILA MA 2019. AURKB as a target in non-small cell lung cancer with acquired resistance to anti-EGFR therapy. Nat Commun, 10, 1812. [DOI] [PMC free article] [PubMed] [Google Scholar]
- BRADEEN HA, EIDE CA, O’HARE T, JOHNSON KJ, WILLIS SG, LEE FY, DRUKER BJ & DEININGER MW 2006. Comparison of imatinib mesylate, dasatinib (BMS-354825), and nilotinib (AMN107) in an N-ethyl-N-nitrosourea (ENU)-based mutagenesis screen: high efficacy of drug combinations. Blood, 108, 2332–8. [DOI] [PMC free article] [PubMed] [Google Scholar]
- CAREY A, EDWARDS DKT, EIDE CA, NEWELL L, TRAER E, MEDEIROS BC, POLLYEA DA, DEININGER MW, COLLINS RH, TYNER JW, DRUKER BJ, BAGBY GC, MCWEENEY SK & AGARWAL A 2017. Identification of Interleukin-1 by Functional Screening as a Key Mediator of Cellular Expansion and Disease Progression in Acute Myeloid Leukemia. Cell Rep, 18, 3204–3218. [DOI] [PMC free article] [PubMed] [Google Scholar]
- CASADO P, RODRIGUEZ-PRADOS JC, COSULICH SC, GUICHARD S, VANHAESEBROECK B, JOEL S & CUTILLAS PR 2013. Kinase-substrate enrichment analysis provides insights into the heterogeneity of signaling pathway activation in leukemia cells. Sci Signal, 6, rs6. [DOI] [PubMed] [Google Scholar]
- CHEN CC, LI B, MILLMAN SE, CHEN C, LI X, MORRIS JPT, MAYLE A, HO YJ, LOIZOU E, LIU H, QIN W, SHAH H, VIOLANTE S, CROSS JR, LOWE SW & ZHANG L 2020. Vitamin B6 Addiction in Acute Myeloid Leukemia. Cancer Cell, 37, 71–84 e7. [DOI] [PMC free article] [PubMed] [Google Scholar]
- DHILLON S 2019. Gilteritinib: First Global Approval. Drugs, 79, 331–339. [DOI] [PubMed] [Google Scholar]
- DOU Y, KAWALER EA, CUI ZHOU D, GRITSENKO MA, HUANG C, BLUMENBERG L, KARPOVA A, PETYUK VA, SAVAGE SR, SATPATHY S, LIU W, WU Y, TSAI CF, WEN B, LI Z, CAO S, MOON J, SHI Z, CORNWELL M, WYCZALKOWSKI MA, CHU RK, VASAIKAR S, ZHOU H, GAO Q, MOORE RJ, LI K, SETHURAMAN S, MONROE ME, ZHAO R, HEIMAN D, KRUG K, CLAUSER K, KOTHADIA R, MARUVKA Y, PICO AR, OLIPHANT AE, HOSKINS EL, PUGH SL, BEECROFT SJI, ADAMS DW, JARMAN JC, KONG A, CHANG HY, REVA B, LIAO Y, RYKUNOV D, COLAPRICO A, CHEN XS, CZEKANSKI A, JEDRYKA M, MATKOWSKI R, WIZNEROWICZ M, HILTKE T, BOJA E, KINSINGER CR, MESRI M, ROBLES AI, RODRIGUEZ H, MUTCH D, FUH K, ELLIS MJ, DELAIR D, THIAGARAJAN M, MANI DR, GETZ G, NOBLE M, NESVIZHSKII AI, WANG P, ANDERSON ML, LEVINE DA, SMITH RD, PAYNE SH, RUGGLES KV, RODLAND KD, DING L, ZHANG B, LIU T, FENYO D & CLINICAL PROTEOMIC TUMOR ANALYSIS, C. 2020. Proteogenomic Characterization of Endometrial Carcinoma. Cell, 180, 729–748 e26. [DOI] [PMC free article] [PubMed] [Google Scholar]
- FARGE T, SALAND E, DE TONI F, AROUA N, HOSSEINI M, PERRY R, BOSC C, SUGITA M, STUANI L, FRAISSE M, SCOTLAND S, LARRUE C, BOUTZEN H, FELIU V, NICOLAU-TRAVERS ML, CASSANT-SOURDY S, BROIN N, DAVID M, SERHAN N, SARRY A, TAVITIAN S, KAOMA T, VALLAR L, IACOVONI J, LINARES LK, MONTERSINO C, CASTELLANO R, GRIESSINGER E, COLLETTE Y, DUCHAMP O, BARREIRA Y, HIRSCH P, PALAMA T, GALES L, DELHOMMEAU F, GARMY-SUSINI BH, PORTAIS JC, VERGEZ F, SELAK M, DANET-DESNOYERS G, CARROLL M, RECHER C & SARRY JE 2017. Chemotherapy-Resistant Human Acute Myeloid Leukemia Cells Are Not Enriched for Leukemic Stem Cells but Require Oxidative Metabolism. Cancer Discov, 7, 716–735. [DOI] [PMC free article] [PubMed] [Google Scholar]
- FLETCHER L, JOSHI SK & TRAER E 2020. Profile of Quizartinib for the Treatment of Adult Patients with Relapsed/Refractory FLT3-ITD-Positive Acute Myeloid Leukemia: Evidence to Date. Cancer Manag Res, 12, 151–163. [DOI] [PMC free article] [PubMed] [Google Scholar]
- FORTE D, GARCIA-FERNANDEZ M, SANCHEZ-AGUILERA A, STAVROPOULOU V, FIELDING C, MARTIN-PEREZ D, LOPEZ JA, COSTA ASH, TRONCI L, NIKITOPOULOU E, BARBER M, GALLIPOLI P, MARANDO L, FERNANDEZ DE CASTILLEJO CL, TZANKOV A, DIETMANN S, CAVO M, CATANI L, CURTI A, VAZQUEZ J, FREZZA C, HUNTLY BJ, SCHWALLER J & MENDEZ-FERRER S 2020. Bone Marrow Mesenchymal Stem Cells Support Acute Myeloid Leukemia Bioenergetics and Enhance Antioxidant Defense and Escape from Chemotherapy. Cell Metab. [DOI] [PMC free article] [PubMed] [Google Scholar]
- GALLIPOLI P, GIOTOPOULOS G, TZELEPIS K, COSTA ASH, VOHRA S, MEDINA-PEREZ P, BASHEER F, MARANDO L, DI LISIO L, DIAS JML, YUN H, SASCA D, HORTON SJ, VASSILIOU G, FREZZA C & HUNTLY BJP 2018. Glutaminolysis is a metabolic dependency in FLT3(ITD) acute myeloid leukemia unmasked by FLT3 tyrosine kinase inhibition. Blood, 131, 1639–1653. [DOI] [PMC free article] [PubMed] [Google Scholar]
- GEHRKE S, RICE S, STEFANONI D, WILKERSON RB, NEMKOV T, REISZ JA, HANSEN KC, LUCAS A, CABRALES P, DREW K & D’ALESSANDRO A 2019. Red Blood Cell Metabolic Responses to Torpor and Arousal in the Hibernator Arctic Ground Squirrel. J Proteome Res, 18, 1827–1841. [DOI] [PMC free article] [PubMed] [Google Scholar]
- GENTLEMAN RC, CAREY VJ, BATES DM, BOLSTAD B, DETTLING M, DUDOIT S, ELLIS B, GAUTIER L, GE Y, GENTRY J, HORNIK K, HOTHORN T, HUBER W, IACUS S, IRIZARRY R, LEISCH F, LI C, MAECHLER M, ROSSINI AJ, SAWITZKI G, SMITH C, SMYTH G, TIERNEY L, YANG JY & ZHANG J 2004. Bioconductor: open software development for computational biology and bioinformatics. Genome Biol, 5, R80. [DOI] [PMC free article] [PubMed] [Google Scholar]
- GIBBONS BC, CHAMBERS MC, MONROE ME, TABB DL & PAYNE SH 2015. Correcting systematic bias and instrument measurement drift with mzRefinery. Bioinformatics, 31, 3838–40. [DOI] [PMC free article] [PubMed] [Google Scholar]
- GREGORY MA, D’ALESSANDRO A, ALVAREZ-CALDERON F, KIM J, NEMKOV T, ADANE B, ROZHOK AI, KUMAR A, KUMAR V, POLLYEA DA, WEMPE MF, JORDAN CT, SERKOVA NJ, TAN AC, HANSEN KC & DEGREGORI J 2016. ATM/G6PD-driven redox metabolism promotes FLT3 inhibitor resistance in acute myeloid leukemia. Proc Natl Acad Sci U S A, 113, E6669–E6678. [DOI] [PMC free article] [PubMed] [Google Scholar]
- GREGORY MA, NEMKOV T, REISZ JA, ZABEREZHNYY V, HANSEN KC, D’ALESSANDRO A & DEGREGORI J 2018. Glutaminase inhibition improves FLT3 inhibitor therapy for acute myeloid leukemia. Exp Hematol, 58, 52–58. [DOI] [PMC free article] [PubMed] [Google Scholar]
- GU Z, EILS R & SCHLESNER M 2016. Complex heatmaps reveal patterns and correlations in multidimensional genomic data. Bioinformatics, 32, 2847–2849. [DOI] [PubMed] [Google Scholar]
- HATA AN, NIEDERST MJ, ARCHIBALD HL, GOMEZ-CARABALLO M, SIDDIQUI FM, MULVEY HE, MARUVKA YE, JI F, BHANG HE, KRISHNAMURTHY RADHAKRISHNA V, SIRAVEGNA G, HU H, RAOOF S, LOCKERMAN E, KALSY A, LEE D, KEATING CL, RUDDY DA, DAMON LJ, CRYSTAL AS, COSTA C, PIOTROWSKA Z, BARDELLI A, IAFRATE AJ, SADREYEV RI, STEGMEIER F, GETZ G, SEQUIST LV, FABER AC & ENGELMAN JA 2016. Tumor cells can follow distinct evolutionary paths to become resistant to epidermal growth factor receptor inhibition. Nat Med, 22, 262–9. [DOI] [PMC free article] [PubMed] [Google Scholar]
- ITO S, GOTO H, KUNIYASU K, SHINDO M, YAMADA M, TANAKA K, TOH GT, SAWA M, INAGAKI M, BARTEK J & MASAI H 2019. Cdc7 kinase stimulates Aurora B kinase in M-phase. Sci Rep, 9, 18622. [DOI] [PMC free article] [PubMed] [Google Scholar]
- JASSAL B, MATTHEWS L, VITERI G, GONG C, LORENTE P, FABREGAT A, SIDIROPOULOS K, COOK J, GILLESPIE M, HAW R, LONEY F, MAY B, MILACIC M, ROTHFELS K, SEVILLA C, SHAMOVSKY V, SHORSER S, VARUSAI T, WEISER J, WU G, STEIN L, HERMJAKOB H & D’EUSTACHIO P 2020. The reactome pathway knowledgebase. Nucleic Acids Res, 48, D498–D503. [DOI] [PMC free article] [PubMed] [Google Scholar]
- JAVIDI-SHARIFI N, MARTINEZ J, ENGLISH I, JOSHI SK, SCOPIM-RIBEIRO R, VIOLA SK, EDWARDS DKT, AGARWAL A, LOPEZ C, JORGENS D, TYNER JW, DRUKER BJ & TRAER E 2019. FGF2-FGFR1 signaling regulates release of Leukemia-Protective exosomes from bone marrow stromal cells. Elife, 8. [DOI] [PMC free article] [PubMed] [Google Scholar]
- JONES CL, STEVENS BM, D’ALESSANDRO A, REISZ JA, CULP-HILL R, NEMKOV T, PEI S, KHAN N, ADANE B, YE H, KRUG A, REINHOLD D, SMITH C, DEGREGORI J, POLLYEA DA & JORDAN CT 2018. Inhibition of Amino Acid Metabolism Selectively Targets Human Leukemia Stem Cells. Cancer Cell, 34, 724–740 e4. [DOI] [PMC free article] [PubMed] [Google Scholar]
- JONES CL, STEVENS BM, POLLYEA DA, CULP-HILL R, REISZ JA, NEMKOV T, GEHRKE S, GAMBONI F, KRUG A, WINTERS A, PEI S, GUSTAFSON A, YE H, INGUVA A, AMAYA M, MINHAJUDDIN M, ABBOTT D, BECKER MW, DEGREGORI J, SMITH CA, D’ALESSANDRO A & JORDAN CT 2020. Nicotinamide Metabolism Mediates Resistance to Venetoclax in Relapsed Acute Myeloid Leukemia Stem Cells. Cell Stem Cell. [DOI] [PMC free article] [PubMed] [Google Scholar]
- JOSHI SK, SHARZEHI S, PITTSENBARGER J, BOTTOMLY D, TOGNON CE, MCWEENEY SK, DRUKER BJ & TRAER E 2021. A noncanonical FLT3 gatekeeper mutation disrupts gilteritinib binding and confers resistance. Am J Hematol. [DOI] [PMC free article] [PubMed] [Google Scholar]
- KARCZEWSKI KJ, FRANCIOLI LC, TIAO G, CUMMINGS BB, ALFÖLDI J, WANG Q, COLLINS RL, LARICCHIA KM, GANNA A, BIRNBAUM DP, GAUTHIER LD, BRAND H, SOLOMONSON M, WATTS NA, RHODES D, SINGER-BERK M, ENGLAND EM, SEABY EG, KOSMICKI JA, WALTERS RK, TASHMAN K, FARJOUN Y, BANKS E, POTERBA T, WANG A, SEED C, WHIFFIN N, CHONG JX, SAMOCHA KE, PIERCE-HOFFMAN E, ZAPPALA Z, O’DONNELL-LURIA AH, MINIKEL EV, WEISBURD B, LEK M, WARE JS, VITTAL C, ARMEAN IM, BERGELSON L, CIBULSKIS K, CONNOLLY KM, COVARRUBIAS M, DONNELLY S, FERRIERA S, GABRIEL S, GENTRY J, GUPTA N, JEANDET T, KAPLAN D, LLANWARNE C, MUNSHI R, NOVOD S, PETRILLO N, ROAZEN D, RUANO-RUBIO V, SALTZMAN A, SCHLEICHER M, SOTO J, TIBBETTS K, TOLONEN C, WADE G, TALKOWSKI ME, NEALE BM, DALY MJ & MACARTHUR DG 2020. The mutational constraint spectrum quantified from variation in 141,456 humans. bioRxiv, 531210. [DOI] [PMC free article] [PubMed] [Google Scholar]
- KIM S, GUPTA N & PEVZNER PA 2008. Spectral probabilities and generating functions of tandem mass spectra: a strike against decoy databases. J Proteome Res, 7, 3354–63. [DOI] [PMC free article] [PubMed] [Google Scholar]
- KIM S & PEVZNER PA 2014. MS-GF+ makes progress towards a universal database search tool for proteomics. Nat Commun, 5, 5277. [DOI] [PMC free article] [PubMed] [Google Scholar]
- KOLDE R, LAUR S, ADLER P & VILO J 2012. Robust rank aggregation for gene list integration and meta-analysis. Bioinformatics, 28, 573–80. [DOI] [PMC free article] [PubMed] [Google Scholar]
- KONOPLEVA M, KONOPLEV S, HU W, ZARITSKEY AY, AFANASIEV BV & ANDREEFF M 2002. Stromal cells prevent apoptosis of AML cells by up-regulation of anti-apoptotic proteins. Leukemia, 16, 1713–24. [DOI] [PubMed] [Google Scholar]
- KONOPLEVA M, TABE Y, ZENG Z & ANDREEFF M 2009. Therapeutic targeting of microenvironmental interactions in leukemia: mechanisms and approaches. Drug Resist Updat, 12, 103–13. [DOI] [PMC free article] [PubMed] [Google Scholar]
- KORNBLAU SM, RUVOLO PP, WANG RY, BATTULA VL, SHPALL EJ, RUVOLO VR, MCQUEEN T, QUI Y, ZENG Z, PIERCE S, JACAMO R, YOO SY, LE PM, SUN J, HAIL N JR., KONOPLEVA M & ANDREEFF M 2018. Distinct protein signatures of acute myeloid leukemia bone marrow-derived stromal cells are prognostic for patient survival. Haematologica. [DOI] [PMC free article] [PubMed] [Google Scholar]
- LAGADINOU ED, SACH A, CALLAHAN K, ROSSI RM, NEERING SJ, MINHAJUDDIN M, ASHTON JM, PEI S, GROSE V, O’DWYER KM, LIESVELD JL, BROOKES PS, BECKER MW & JORDAN CT 2013. BCL-2 inhibition targets oxidative phosphorylation and selectively eradicates quiescent human leukemia stem cells. Cell Stem Cell, 12, 329–41. [DOI] [PMC free article] [PubMed] [Google Scholar]
- LANGE V, PICOTTI P, DOMON B & AEBERSOLD R 2008. Selected reaction monitoring for quantitative proteomics: a tutorial. Mol Syst Biol, 4, 222. [DOI] [PMC free article] [PubMed] [Google Scholar]
- LANGMEAD B & SALZBERG SL 2012. Fast gapped-read alignment with Bowtie 2. Nat Methods, 9, 357–9. [DOI] [PMC free article] [PubMed] [Google Scholar]
- LANTERMANN AB, CHEN D, MCCUTCHEON K, HOFFMAN G, FRIAS E, RUDDY D, RAKIEC D, KORN J, MCALLISTER G, STEGMEIER F, MEYER MJ & SHARMA SV 2015. Inhibition of Casein Kinase 1 Alpha Prevents Acquired Drug Resistance to Erlotinib in EGFR-Mutant Non-Small Cell Lung Cancer. Cancer Res, 75, 4937–48. [DOI] [PubMed] [Google Scholar]
- LAW CW, CHEN Y, SHI W & SMYTH GK 2014. voom: Precision weights unlock linear model analysis tools for RNA-seq read counts. Genome Biol, 15, R29. [DOI] [PMC free article] [PubMed] [Google Scholar]
- LI H 2013. Aligning sequence reads, clone sequences and assembly contigs with BWA-MEM. [Google Scholar]
- LI W, XU H, XIAO T, CONG L, LOVE MI, ZHANG F, IRIZARRY RA, LIU JS, BROWN M & LIU XS 2014. MAGeCK enables robust identification of essential genes from genome-scale CRISPR/Cas9 knockout screens. Genome Biol, 15, 554. [DOI] [PMC free article] [PubMed] [Google Scholar]
- LIN KH, RUTTER JC, XIE A, PARDIEU B, WINN ET, BELLO RD, FORGET A, ITZYKSON R, AHN YR, DAI Z, SOBHAN RT, ANDERSON GR, SINGLETON KR, DECKER AE, WINTER PS, LOCASALE JW, CRAWFORD L, PUISSANT A & WOOD KC 2020. Using antagonistic pleiotropy to design a chemotherapy-induced evolutionary trap to target drug resistance in cancer. Nat Genet, 52, 408–417. [DOI] [PMC free article] [PubMed] [Google Scholar]
- MACLEAN B, TOMAZELA DM, SHULMAN N, CHAMBERS M, FINNEY GL, FREWEN B, KERN R, TABB DL, LIEBLER DC & MACCOSS MJ 2010. Skyline: an open source document editor for creating and analyzing targeted proteomics experiments. Bioinformatics, 26, 966–8. [DOI] [PMC free article] [PubMed] [Google Scholar]
- MARTIN M 2011. Cutadapt removes adapter sequences from high-throughput sequencing reads. 2011, 17, 3. [Google Scholar]
- MCKENNA A, HANNA M, BANKS E, SIVACHENKO A, CIBULSKIS K, KERNYTSKY A, GARIMELLA K, ALTSHULER D, GABRIEL S, DALY M & DEPRISTO MA 2010. The Genome Analysis Toolkit: a MapReduce framework for analyzing next-generation DNA sequencing data. Genome Res, 20, 1297–303. [DOI] [PMC free article] [PubMed] [Google Scholar]
- MCLAREN W, GIL L, HUNT SE, RIAT HS, RITCHIE GR, THORMANN A, FLICEK P & CUNNINGHAM F 2016. The Ensembl Variant Effect Predictor. Genome Biol, 17, 122. [DOI] [PMC free article] [PubMed] [Google Scholar]
- MCMAHON CM, FERNG T, CANAANI J, WANG ES, MORRISSETTE JJD, EASTBURN DJ, PELLEGRINO M, DURRUTHY-DURRUTHY R, WATT CD, ASTHANA S, LASATER EA, DEFILIPPIS R, PERETZ CAC, MCGARY LHF, DEIHIMI S, LOGAN AC, LUGER SM, SHAH NP, CARROLL M, SMITH CC & PERL AE 2019. Clonal Selection with RAS Pathway Activation Mediates Secondary Clinical Resistance to Selective FLT3 Inhibition in Acute Myeloid Leukemia. Cancer Discov, 9, 1050–1063. [DOI] [PMC free article] [PubMed] [Google Scholar]
- MELGAR K, WALKER MM, JONES LM, BOLANOS LC, HUENEMAN K, WUNDERLICH M, JIANG JK, WILSON KM, ZHANG X, SUTTER P, WANG A, XU X, CHOI K, TAWA G, LORIMER D, ABENDROTH J, O’BRIEN E, HOYT SB, BERMAN E, FAMULARE CA, MULLOY JC, LEVINE RL, PERENTESIS JP, THOMAS CJ & STARCZYNOWSKI DT 2019. Overcoming adaptive therapy resistance in AML by targeting immune response pathways. Sci Transl Med, 11. [DOI] [PMC free article] [PubMed] [Google Scholar]
- MERTINS P, TANG LC, KRUG K, CLARK DJ, GRITSENKO MA, CHEN L, CLAUSER KR, CLAUSS TR, SHAH P, GILLETTE MA, PETYUK VA, THOMAS SN, MANI DR, MUNDT F, MOORE RJ, HU Y, ZHAO R, SCHNAUBELT M, KESHISHIAN H, MONROE ME, ZHANG Z, UDESHI ND, MANI D, DAVIES SR, TOWNSEND RR, CHAN DW, SMITH RD, ZHANG H, LIU T & CARR SA 2018. Reproducible workflow for multiplexed deep-scale proteome and phosphoproteome analysis of tumor tissues by liquid chromatography-mass spectrometry. Nat Protoc, 13, 1632–1661. [DOI] [PMC free article] [PubMed] [Google Scholar]
- MONROE ME, SHAW JL, DALY DS, ADKINS JN & SMITH RD 2008. MASIC: a software program for fast quantitation and flexible visualization of chromatographic profiles from detected LC-MS(/MS) features. Comput Biol Chem, 32, 215–7. [DOI] [PMC free article] [PubMed] [Google Scholar]
- MORGILLO F, DELLA CORTE CM, DIANA A, MAURO CD, CIARAMELLA V, BARRA G, BELLI V, FRANZESE E, BIANCO R, MAIELLO E, DE VITA F, CIARDIELLO F & ORDITURA M 2017. Phosphatidylinositol 3-kinase (PI3Kalpha)/AKT axis blockade with taselisib or ipatasertib enhances the efficacy of anti-microtubule drugs in human breast cancer cells. Oncotarget, 8, 76479–76491. [DOI] [PMC free article] [PubMed] [Google Scholar]
- NECHIPORUK T, KURTZ SE, NIKOLOVA O, LIU T, JONES CL, D’ALESSANDRO A, CULP-HILL R, D’ALMEIDA A, JOSHI SK, ROSENBERG M, TOGNON CE, DANILOV AV, DRUKER BJ, CHANG BH, MCWEENEY SK & TYNER JW 2019. The TP53 Apoptotic Network is a Primary Mediator of Resistance to BCL2 inhibition in AML Cells. Cancer Discov. [DOI] [PMC free article] [PubMed] [Google Scholar]
- NEMKOV T, HANSEN KC & D’ALESSANDRO A 2017. A three-minute method for high-throughput quantitative metabolomics and quantitative tracing experiments of central carbon and nitrogen pathways. Rapid Commun Mass Spectrom, 31, 663–673. [DOI] [PMC free article] [PubMed] [Google Scholar]
- NEMKOV T, REISZ JA, GEHRKE S, HANSEN KC & D’ALESSANDRO A 2019. High-Throughput Metabolomics: Isocratic and Gradient Mass Spectrometry-Based Methods. Methods Mol Biol, 1978, 13–26. [DOI] [PubMed] [Google Scholar]
- PABST C, KROSL J, FARES I, BOUCHER G, RUEL R, MARINIER A, LEMIEUX S, HEBERT J & SAUVAGEAU G 2014. Identification of small molecules that support human leukemia stem cell activity ex vivo. Nat Methods, 11, 436–42. [DOI] [PubMed] [Google Scholar]
- PEI S, POLLYEA DA, GUSTAFSON A, STEVENS BM, MINHAJUDDIN M, FU R, RIEMONDY KA, GILLEN AE, SHERIDAN RM, KIM J, COSTELLO JC, AMAYA ML, INGUVA A, WINTERS A, YE H, KRUG A, JONES CL, ADANE B, KHAN N, PONDER J, SCHOWINSKY J, ABBOTT D, HAMMES A, MYERS JR, ASHTON JM, NEMKOV T, D’ALESSANDRO A, GUTMAN JA, RAMSEY HE, SAVONA MR, SMITH CA & JORDAN CT 2020. Monocytic Subclones Confer Resistance to Venetoclax-Based Therapy in Patients with Acute Myeloid Leukemia. Cancer Discov, 10, 536–551. [DOI] [PMC free article] [PubMed] [Google Scholar]
- PERL AE, MARTINELLI G, CORTES JE, NEUBAUER A, BERMAN E, PAOLINI S, MONTESINOS P, BAER MR, LARSON RA, USTUN C, FABBIANO F, ERBA HP, DI STASI A, STUART R, OLIN R, KASNER M, CICERI F, CHOU WC, PODOLTSEV N, RECHER C, YOKOYAMA H, HOSONO N, YOON SS, LEE JH, PARDEE T, FATHI AT, LIU C, HASABOU N, LIU X, BAHCECI E & LEVIS MJ 2019. Gilteritinib or Chemotherapy for Relapsed or Refractory FLT3-Mutated AML. N Engl J Med, 381, 1728–1740. [DOI] [PubMed] [Google Scholar]
- PIEHOWSKI PD, PETYUK VA, SONTAG RL, GRITSENKO MA, WEITZ KK, FILLMORE TL, MOON J, MAKHLOUF H, CHUAQUI RF, BOJA ES, RODRIGUEZ H, LEE JSH, SMITH RD, CARRICK DM, LIU T & RODLAND KD 2018. Residual tissue repositories as a resource for population-based cancer proteomic studies. Clin Proteomics, 15, 26. [DOI] [PMC free article] [PubMed] [Google Scholar]
- REISZ JA, ZHENG C, D’ALESSANDRO A & NEMKOV T 2019. Untargeted and Semi-targeted Lipid Analysis of Biological Samples Using Mass Spectrometry-Based Metabolomics. Methods Mol Biol, 1978, 121–135. [DOI] [PubMed] [Google Scholar]
- RUVOLO PP, RUVOLO VR, BURKS JK, QIU Y, WANG RY, SHPALL EJ, MIRANDOLA L, HAIL N JR., ZENG Z, MCQUEEN T, DAVER N, POST SM, CHIRIVA-INTERNATI M, KORNBLAU SM & ANDREEFF M 2018. Role of MSC-derived galectin 3 in the AML microenvironment. Biochim Biophys Acta, 1865, 959–969. [DOI] [PMC free article] [PubMed] [Google Scholar]
- SATO T, YANG X, KNAPPER S, WHITE P, SMITH BD, GALKIN S, SMALL D, BURNETT A & LEVIS M 2011. FLT3 ligand impedes the efficacy of FLT3 inhibitors in vitro and in vivo. Blood, 117, 3286–93. [DOI] [PMC free article] [PubMed] [Google Scholar]
- SAVINO AM, FERNANDES SI, OLIVARES O, ZEMLYANSKY A, COUSINS A, MARKERT EK, BAREL S, GERON I, FRISHMAN L, BIRGER Y, ECKERT C, TUMANOV S, MACKAY G, KAMPHORST JJ, HERZYK P, FERNÁNDEZ-GARCÍA J, ABRAMOVICH I, MOR I, BARDINI M, BARIN E, JANAKI-RAMAN S, CROSS JR, KHARAS MG, GOTTLIEB E, IZRAELI S & HALSEY C 2020. Metabolic adaptation of acute lymphoblastic leukemia to the central nervous system microenvironment depends on stearoyl-CoA desaturase. Nature Cancer, 1, 998–1009. [DOI] [PMC free article] [PubMed] [Google Scholar]
- SHAH KN, BHATT R, ROTOW J, ROHRBERG J, OLIVAS V, WANG VE, HEMMATI G, MARTINS MM, MAYNARD A, KUHN J, GALEAS J, DONNELLA HJ, KAUSHIK S, KU A, DUMONT S, KRINGS G, HARINGSMA HJ, ROBILLARD L, SIMMONS AD, HARDING TC, MCCORMICK F, GOGA A, BLAKELY CM, BIVONA TG & BANDYOPADHYAY S 2019. Aurora kinase A drives the evolution of resistance to third-generation EGFR inhibitors in lung cancer. Nat Med, 25, 111–118. [DOI] [PMC free article] [PubMed] [Google Scholar]
- SHANNON P, MARKIEL A, OZIER O, BALIGA NS, WANG JT, RAMAGE D, AMIN N, SCHWIKOWSKI B & IDEKER T 2003. Cytoscape: a software environment for integrated models of biomolecular interaction networks. Genome Res, 13, 2498–504. [DOI] [PMC free article] [PubMed] [Google Scholar]
- SHARMA SV, LEE DY, LI B, QUINLAN MP, TAKAHASHI F, MAHESWARAN S, MCDERMOTT U, AZIZIAN N, ZOU L, FISCHBACH MA, WONG KK, BRANDSTETTER K, WITTNER B, RAMASWAMY S, CLASSON M & SETTLEMAN J 2010. A chromatin-mediated reversible drug-tolerant state in cancer cell subpopulations. Cell, 141, 69–80. [DOI] [PMC free article] [PubMed] [Google Scholar]
- SHARMA SV & SETTLEMAN J 2007. Oncogene addiction: setting the stage for molecularly targeted cancer therapy. Genes Dev, 21, 3214–31. [DOI] [PubMed] [Google Scholar]
- SMIDA M, FECE DE LA CRUZ F, KERZENDORFER C, URAS IZ, MAIR B, MAZOUZI A, SUCHANKOVA T, KONOPKA T, KATZ AM, PAZ K, NAGY-BOJARSZKY K, MUELLNER MK, BAGO-HORVATH Z, HAURA EB, LOIZOU JI & NIJMAN SM 2016. MEK inhibitors block growth of lung tumours with mutations in ataxia-telangiectasia mutated. Nat Commun, 7, 13701. [DOI] [PMC free article] [PubMed] [Google Scholar]
- SMITH CC, LASATER EA, LIN KC, WANG Q, MCCREERY MQ, STEWART WK, DAMON LE, PERL AE, JESCHKE GR, SUGITA M, CARROLL M, KOGAN SC, KURIYAN J & SHAH NP 2014. Crenolanib is a selective type I pan-FLT3 inhibitor. Proc Natl Acad Sci U S A, 111, 5319–24. [DOI] [PMC free article] [PubMed] [Google Scholar]
- SMITH CC, LIN K, STECULA A, SALI A & SHAH NP 2015. FLT3 D835 mutations confer differential resistance to type II FLT3 inhibitors. Leukemia, 29, 2390–2. [DOI] [PMC free article] [PubMed] [Google Scholar]
- SMITH CC, PAGUIRIGAN A, JESCHKE GR, LIN KC, MASSI E, TARVER T, CHIN CS, ASTHANA S, OLSHEN A, TRAVERS KJ, WANG S, LEVIS MJ, PERL AE, RADICH JP & SHAH NP 2017. Heterogeneous resistance to quizartinib in acute myeloid leukemia revealed by single-cell analysis. Blood, 130, 48–58. [DOI] [PMC free article] [PubMed] [Google Scholar]
- SMITH CC, WANG Q, CHIN CS, SALERNO S, DAMON LE, LEVIS MJ, PERL AE, TRAVERS KJ, WANG S, HUNT JP, ZARRINKAR PP, SCHADT EE, KASARSKIS A, KURIYAN J & SHAH NP 2012. Validation of ITD mutations in FLT3 as a therapeutic target in human acute myeloid leukaemia. Nature, 485, 260–3. [DOI] [PMC free article] [PubMed] [Google Scholar]
- SONESON C, LOVE MI & ROBINSON MD 2015. Differential analyses for RNA-seq: transcript-level estimates improve gene-level inferences. F1000Res, 4, 1521. [DOI] [PMC free article] [PubMed] [Google Scholar]
- SOSA MS, BRAGADO P & AGUIRRE-GHISO JA 2014. Mechanisms of disseminated cancer cell dormancy: an awakening field. Nat Rev Cancer, 14, 611–22. [DOI] [PMC free article] [PubMed] [Google Scholar]
- STEVENS BM, JONES CL, POLLYEA DA, CULP-HILL R, D’ALESSANDRO A, WINTERS A, KRUG A, ABBOTT D, GOOSMAN M, PEI S, YE H, GILLEN AE, BECKER MW, SAVONA MR, SMITH C & JORDAN CT 2020. Fatty acid metabolism underlies venetoclax resistance in acute myeloid leukemia stem cells. Nature Cancer. [DOI] [PMC free article] [PubMed] [Google Scholar]
- STIREWALT DL & RADICH JP 2003. The role of FLT3 in haematopoietic malignancies. Nat Rev Cancer, 3, 650–65. [DOI] [PubMed] [Google Scholar]
- SU G, KUCHINSKY A, MORRIS JH, STATES DJ & MENG F 2010. GLay: community structure analysis of biological networks. Bioinformatics, 26, 3135–3137. [DOI] [PMC free article] [PubMed] [Google Scholar]
- SZKLARCZYK D, GABLE AL, LYON D, JUNGE A, WYDER S, HUERTA-CEPAS J, SIMONOVIC M, DONCHEVA NT, MORRIS JH, BORK P, JENSEN LJ & MERING CHRISTIAN V. 2018. STRING v11: protein–protein association networks with increased coverage, supporting functional discovery in genome-wide experimental datasets. Nucleic Acids Research, 47, D607–D613. [DOI] [PMC free article] [PubMed] [Google Scholar]
- TARVER TC, HILL JE, RAHMAT L, PERL AE, BAHCECI E, MORI K & SMITH CC 2020. Gilteritinib is a clinically active FLT3 inhibitor with broad activity against FLT3 kinase domain mutations. Blood Adv, 4, 514–524. [DOI] [PMC free article] [PubMed] [Google Scholar]
- TERAI H, SOEJIMA K, YASUDA H, NAKAYAMA S, HAMAMOTO J, ARAI D, ISHIOKA K, OHGINO K, IKEMURA S, SATO T, YODA S, SATOMI R, NAOKI K & BETSUYAKU T 2013. Activation of the FGF2-FGFR1 autocrine pathway: a novel mechanism of acquired resistance to gefitinib in NSCLC. Mol Cancer Res, 11, 759–67. [DOI] [PubMed] [Google Scholar]
- TRAER E, JAVIDI-SHARIFI N, AGARWAL A, DUNLAP J, ENGLISH I, MARTINEZ J, TYNER JW, WONG M & DRUKER BJ 2014. Ponatinib overcomes FGF2-mediated resistance in CML patients without kinase domain mutations. Blood, 123, 1516–24. [DOI] [PMC free article] [PubMed] [Google Scholar]
- TRAER E, MARTINEZ J, JAVIDI-SHARIFI N, AGARWAL A, DUNLAP J, ENGLISH I, KOVACSOVICS T, TYNER JW, WONG M & DRUKER BJ 2016. FGF2 from Marrow Microenvironment Promotes Resistance to FLT3 Inhibitors in Acute Myeloid Leukemia. Cancer Res, 76, 6471–6482. [DOI] [PMC free article] [PubMed] [Google Scholar]
- TRICKER EM, XU C, UDDIN S, CAPELLETTI M, ERCAN D, OGINO A, PRATILAS CA, ROSEN N, GRAY NS, WONG KK & JANNE PA 2015. Combined EGFR/MEK Inhibition Prevents the Emergence of Resistance in EGFR-Mutant Lung Cancer. Cancer Discov, 5, 960–971. [DOI] [PMC free article] [PubMed] [Google Scholar]
- TYANOVA S, TEMU T, SINITCYN P, CARLSON A, HEIN MY, GEIGER T, MANN M & COX J 2016. The Perseus computational platform for comprehensive analysis of (prote)omics data. Nat Methods, 13, 731–40. [DOI] [PubMed] [Google Scholar]
- TYNER JW, TOGNON CE, BOTTOMLY D, WILMOT B, KURTZ SE, SAVAGE SL, LONG N, SCHULTZ AR, TRAER E, ABEL M, AGARWAL A, BLUCHER A, BORATE U, BRYANT J, BURKE R, CARLOS A, CARPENTER R, CARROLL J, CHANG BH, COBLENTZ C, D’ALMEIDA A, COOK R, DANILOV A, DAO KT, DEGNIN M, DEVINE D, DIBB J, EDWARDS DKT, EIDE CA, ENGLISH I, GLOVER J, HENSON R, HO H, JEMAL A, JOHNSON K, JOHNSON R, JUNIO B, KAEMPF A, LEONARD J, LIN C, LIU SQ, LO P, LORIAUX MM, LUTY S, MACEY T, MACMANIMAN J, MARTINEZ J, MORI M, NELSON D, NICHOLS C, PETERS J, RAMSDILL J, ROFELTY A, SCHUFF R, SEARLES R, SEGERDELL E, SMITH RL, SPURGEON SE, SWEENEY T, THAPA A, VISSER C, WAGNER J, WATANABE-SMITH K, WERTH K, WOLF J, WHITE L, YATES A, ZHANG H, COGLE CR, COLLINS RH, CONNOLLY DC, DEININGER MW, DRUSBOSKY L, HOURIGAN CS, JORDAN CT, KROPF P, LIN TL, MARTINEZ ME, MEDEIROS BC, PALLAPATI RR, POLLYEA DA, SWORDS RT, WATTS JM, WEIR SJ, WIEST DL, WINTERS RM, MCWEENEY SK & DRUKER BJ 2018. Functional genomic landscape of acute myeloid leukaemia. Nature, 562, 526–531. [DOI] [PMC free article] [PubMed] [Google Scholar]
- TZELEPIS K, KOIKE-YUSA H, DE BRAEKELEER E, LI Y, METZAKOPIAN E, DOVEY OM, MUPO A, GRINKEVICH V, LI M, MAZAN M, GOZDECKA M, OHNISHI S, COOPER J, PATEL M, MCKERRELL T, CHEN B, DOMINGUES AF, GALLIPOLI P, TEICHMANN S, PONSTINGL H, MCDERMOTT U, SAEZ-RODRIGUEZ J, HUNTLY BJP, IORIO F, PINA C, VASSILIOU GS & YUSA K 2016. A CRISPR Dropout Screen Identifies Genetic Vulnerabilities and Therapeutic Targets in Acute Myeloid Leukemia. Cell Rep, 17, 1193–1205. [DOI] [PMC free article] [PubMed] [Google Scholar]
- VAN GASTEL N, SPINELLI JB, SHARDA A, SCHAJNOVITZ A, BARYAWNO N, RHEE C, OKI T, GRACE E, SOLED HJ, MILOSEVIC J, SYKES DB, HSU PP, VANDER HEIDEN MG, VIDOUDEZ C, TRAUGER SA, HAIGIS MC & SCADDEN DT 2020. Induction of a Timed Metabolic Collapse to Overcome Cancer Chemoresistance. Cell Metab, 32, 391–403 e6. [DOI] [PMC free article] [PubMed] [Google Scholar]
- WANG A & ZHONG H 2018. Roles of the bone marrow niche in hematopoiesis, leukemogenesis, and chemotherapy resistance in acute myeloid leukemia. Hematology, 23, 729–739. [DOI] [PubMed] [Google Scholar]
- WANG Y, YANG F, GRITSENKO MA, WANG Y, CLAUSS T, LIU T, SHEN Y, MONROE ME, LOPEZ-FERRER D, RENO T, MOORE RJ, KLEMKE RL, CAMP DG 2ND & SMITH RD 2011. Reversed-phase chromatography with multiple fraction concatenation strategy for proteome profiling of human MCF10A cells. Proteomics, 11, 2019–26. [DOI] [PMC free article] [PubMed] [Google Scholar]
- WARE KE, HINZ TK, KLECZKO E, SINGLETON KR, MAREK LA, HELFRICH BA, CUMMINGS CT, GRAHAM DK, ASTLING D, TAN AC & HEASLEY LE 2013. A mechanism of resistance to gefitinib mediated by cellular reprogramming and the acquisition of an FGF2-FGFR1 autocrine growth loop. Oncogenesis, 2, e39. [DOI] [PMC free article] [PubMed] [Google Scholar]
- WEINSTEIN IB 2002. Cancer. Addiction to oncogenes--the Achilles heal of cancer. Science, 297, 63–4. [DOI] [PubMed] [Google Scholar]
- WEISBERG E, LIU Q, NELSON E, KUNG AL, CHRISTIE AL, BRONSON R, SATTLER M, SANDA T, ZHAO Z, HUR W, MITSIADES C, SMITH R, DALEY JF, STONE R, GALINSKY I, GRIFFIN JD & GRAY N 2012. Using combination therapy to override stromal-mediated chemoresistance in mutant FLT3-positive AML: synergism between FLT3 inhibitors, dasatinib/multi-targeted inhibitors and JAK inhibitors. Leukemia, 26, 2233–44. [DOI] [PMC free article] [PubMed] [Google Scholar]
- WILSON TR, FRIDLYAND J, YAN Y, PENUEL E, BURTON L, CHAN E, PENG J, LIN E, WANG Y, SOSMAN J, RIBAS A, LI J, MOFFAT J, SUTHERLIN DP, KOEPPEN H, MERCHANT M, NEVE R & SETTLEMAN J 2012. Widespread potential for growth-factor-driven resistance to anticancer kinase inhibitors. Nature, 487, 505–9. [DOI] [PMC free article] [PubMed] [Google Scholar]
- WIREDJA DD, KOYUTURK M & CHANCE MR 2017. The KSEA App: a web-based tool for kinase activity inference from quantitative phosphoproteomics. Bioinformatics, 33, 3489–3491. [DOI] [PMC free article] [PubMed] [Google Scholar]
- YANG X, SEXAUER A & LEVIS M 2014. Bone marrow stroma-mediated resistance to FLT3 inhibitors in FLT3-ITD AML is mediated by persistent activation of extracellular regulated kinase. Br J Haematol, 164, 61–72. [DOI] [PMC free article] [PubMed] [Google Scholar]
- YE H, MINHAJUDDIN M, KRUG A, PEI S, CHOU CH, CULP-HILL R, PONDER J, DE BLOOIS E, SCHNIEDEWIND B, AMAYA ML, INGUVA A, STEVENS BM, POLLYEA DA, CHRISTIANS U, GRIMES HL, D’ALESSANDRO A & JORDAN CT 2020. The hepatic microenvironment uniquely protects leukemia cells through induction of growth and survival pathways mediated by LIPG. Cancer Discov. [DOI] [PMC free article] [PubMed] [Google Scholar]
- YE K, SCHULZ MH, LONG Q, APWEILER R & NING Z 2009. Pindel: a pattern growth approach to detect break points of large deletions and medium sized insertions from paired-end short reads. Bioinformatics, 25, 2865–71. [DOI] [PMC free article] [PubMed] [Google Scholar]
- ZENG Z, SHI YX, SAMUDIO IJ, WANG RY, LING X, FROLOVA O, LEVIS M, RUBIN JB, NEGRIN RR, ESTEY EH, KONOPLEV S, ANDREEFF M & KONOPLEVA M 2009. Targeting the leukemia microenvironment by CXCR4 inhibition overcomes resistance to kinase inhibitors and chemotherapy in AML. Blood, 113, 6215–24. [DOI] [PMC free article] [PubMed] [Google Scholar]
- ZHANG H, NAKAUCHI Y, KÖHNKE T, STAFFORD M, BOTTOMLY D, THOMAS R, WILMOT B, MCWEENEY SK, MAJETI R & TYNER JW 2020. Integrated analysis of patient samples identifies biomarkers for venetoclax efficacy and combination strategies in acute myeloid leukemia. Nature Cancer, 1, 826–839. [DOI] [PMC free article] [PubMed] [Google Scholar]
- ZHANG H, SAVAGE S, SCHULTZ AR, BOTTOMLY D, WHITE L, SEGERDELL E, WILMOT B, MCWEENEY SK, EIDE CA, NECHIPORUK T, CARLOS A, HENSON R, LIN C, SEARLES R, HO H, LAM YL, SWEAT R, FOLLIT C, JAIN V, LIND E, BORTHAKUR G, GARCIA-MANERO G, RAVANDI F, KANTARJIAN HM, CORTES J, COLLINS R, BUELOW DR, BAKER SD, DRUKER BJ & TYNER JW 2019. Clinical resistance to crenolanib in acute myeloid leukemia due to diverse molecular mechanisms. Nat Commun, 10, 244. [DOI] [PMC free article] [PubMed] [Google Scholar]
- ZHAO B, SEDLAK JC, SRINIVAS R, CREIXELL P, PRITCHARD JR, TIDOR B, LAUFFENBURGER DA & HEMANN MT 2016. Exploiting Temporal Collateral Sensitivity in Tumor Clonal Evolution. Cell, 165, 234–246. [DOI] [PMC free article] [PubMed] [Google Scholar]
Associated Data
This section collects any data citations, data availability statements, or supplementary materials included in this article.
Supplementary Materials
Data Availability Statement
All datasets generated from this study have been deposited in publicly available repositories. The whole exome sequencing (WES) datasets generated during this study are available at NCBI Sequence Read Archive (Accession Code - PRJNA666471). CRISPR-Cas datasets generated during this study are available at NCBI GEO (Accession Code - GSE158717). RNA-Sequencing data generated during this study is available at NCBI GEO (Accession Code - GSE168583). Proteomics and phosphoproteomics on cell lines generated during this study are available via https://cptac-data-portal.georgetown.edu/cptacPublic/. Targeted proteomics data from clinical samples is available at https://panoramaweb.org/PNNL-PTRC.url (Email: panorama+ptrc@proteinms.net; Password: fWiTRFmK).
Information on accessing data is also provided in the Key Resources Table.
KEY RESOURCES TABLE
| REAGENT or RESOURCE | SOURCE | IDENTIFIER |
|---|---|---|
| Antibodies | ||
| Phospho-Akt (Ser473) | Cell Signaling Technology | Cat#9271S; RRID:AB_329825 |
| Akt | Cell Signaling Technology | Cat#9272S; RRID:AB_329827 |
| Phospho-p44/42 MAPK (Erk1/2) (Thr202/Tyr204) | Cell Signaling Technology | Cat#9101S; RRID:AB_331646 |
| p44/42 MAPK (Erk1/2) | Cell Signaling Technology | Cat#9102S; RRID:AB_330744 |
| Phospho-Stat5 (Tyr694) | Cell Signaling Technology | Cat#9351S; RRID:AB_2315225 |
| Total Stat5 | Cell Signaling Technology | Cat#25656S; RRID:AB_2798908 |
| Phospho-FLT3 (Tyr589/591) | Cell Signaling Technology | Cat#3464S; AB_2107051 |
| Phospho-FLT3 (Tyr842) | Cell Signaling Technology | Cat#4577S; RRID:AB_916078 |
| Phospho-FLT3 (Tyr969) | Cell Signaling Technology | Cat#3463S; RRID:AB_823453 |
| Total FLT3 | Cell Signaling Technology | Cat#3462S; RRID:AB_2107052 |
| FGFR1 | Cell Signaling Technology | Cat#9740S; RRID:AB_11178519 |
| FGF2 | Santa Cruz Technologies | Cat#SC-79; RRID:AB_631497 |
| FL | ABCAM | Cat#AB52648; RRID:AB_2104974 |
| GAPDH | Thermo Fisher | Cat#AM4300; RRID:AB_437392 |
| IRDye 800CW Goat anti-Rabbit IgG | LICOR | Cat#926–32211; RRID:AB_621843 |
| IRDye 680RD Goat anti-Mouse IgG | LICOR | Cat#926–68070; RRID:AB_10956588 |
| anti-Ki67-Alexa647 | Biolegend | Cat#350510; RRID:AB_10900821 |
| Biological Samples | ||
| Patient AML cells | LLS Beat AML gilteritinib trial (NCT03013998, S8 sub-study) | |
| Patient stromal cells | LLS Beat AML gilteritinib trial (NCT03013998, S8 sub-study) | |
| Chemicals, Peptides, and Recombinant Proteins | ||
| Human FLT3 | PeproTech | Cat#300–19 |
| Human FGF2 | PeproTech | Cat# 100–18B |
| Gilteritinib | Selleck Chemicals | Cat#S7754 |
| AZD2811 | AztraZeneca | N/A |
| Critical Commercial Assays | ||
| DNeasy Blood & Tissue Kit | Qiagen | Cat#69506 |
| ddPCR NRASG12D assay | BioRad | Cat# dHsaMDV2010095 |
| ddPCR NRASG12S assay | BioRad | Cat# dHsaMDV2010093 |
| QuikChange II XL kit | Agilent Technologies Inc. | Cat#200522 |
| Seahorse XF Long Chain Fatty Acid Oxidation Stress Test Kit | Agilent Technologies Inc. | Cat#103672–100 |
| miRNeasy Mini Kit | Qiagen | Cat#217004 |
| EasySep™ Human CD33 Positive Selection Kit II | StemCell Technologies | Cat#17876 |
| EasySep™ Human CD34 Positive Selection Kit II | StemCell Technologies | Cat#17856 |
| Deposited Data | ||
| Whole exome sequencing of MOLM14 & MV4;11 late gilteritinib resistant cultures | This paper | NCBI Sequence Read Archive: PRJNA666471 |
| CRISPR/Cas9 screening of early and late gilteritinib resistant MOLM14 cells | This paper | NCBI GEO: GSE158717 |
| Proteomics & Phosphoproteomics on parental, acute treatment, and early & late gilteritinib resistant MOLM14 & MV4;11 cultures | This paper | https://cptac-data-portal.georgetown.edu/cptacPublic/ |
| Targeted proteomics on AML patient samples | This paper | https://panoramaweb.org/PNNL-PTRC.url |
| Early gilteritinib resistant RNA-SEQ vs. acute gilteritinib treatment (48 hour) | This paper | NCBI GEO: GSE168583 |
| Experimental Models: Cell Lines | ||
| MOLM-14 | Yoshinobu Matsuo Lab | |
| MV4;11 | ATCC | Cat#CRL-9591 |
| HEK 293T/17 | Brian Druker Lab | |
| Early and late gilteritinib resistant MOLM14 and MV4;11 cell lines | This paper | |
| Oligonucleotides | ||
| Single CRISPR guides listed in Supplemental Table 5 | ||
| Recombinant DNA | ||
| pLenti CMV GFP DEST 736–1 | Addgene | Cat#19732 |
| pLentiCRISPRv2 | Addgene | Cat#52961 |
| psPAX2 | Addgene | Cat#12260 |
| lentiCas9-Blast | Addgene | Cat#52962 |
| Yusa CRISPR library | Addgene | Cat#67989 |
| Software and Algorithms | ||
| Flowjo v10 | Flowjo | |
| Metaboanalyst | https://www.metaboanalyst.ca | |
| Cytoscape | https://cytoscape.org | |
| WebGestalt | http://www.webgestalt.org | |
| PRISM v8 | Prism | |
| Reactome | https://reactome.org | |
| Other | ||