

Abstract
It has been proved and widely acknowledged that messenger RNAs can talk to each other by competing for a limited pool of miRNAs. The competing endogenous RNAs are called as ceRNAs. Although some researchers have recently used ceRNAs to do biological function annotations, few of them have investigated the ceRNA network on specific disease systematically. In this work, using both miRNA expression data and mRNA expression data of breast cancer patient as well as the miRNA target relations, the authors proposed a computational method to construct a breast‐cancer‐specific ceRNA network by checking whether the shared miRNA sponges between the gene pairs are significant. The ceRNA network is shown to be scale‐free, thus the topological characters such as hub nodes and communities may provide important clues for the biological mechanism. Through investigation on the communities (the dense clusters) in the network, it was found that they are related to cancer hallmarks. In addition, through function annotation of the hub genes in the network, it was found that they are related to breast cancer. Moreover, classifiers based on the discriminative hubs can significantly distinguish breast cancer patients’ risks of distant metastasis in all the three independent data sets.
Inspec keywords: cancer, genetics, medical computing, molecular biophysics, RNA
Other keywords: breast‐cancer specific ceRNA network construction, miRNA expression data, mRNA expression data, gene pairs, computational method, dense clusters, cancer hallmarks, biological mechanism, discriminative hub genes
1 Introduction
miRNAs are small non‐coding RNA molecules that are involved in various biological processes via regulating a large amount of target mRNAs [1–3]. These days, the hypothesis of ceRNA (competing endogenous RNA) has been proposed [4]. In the ceRNA hypothesis, as the number of miRNAs is limited, the RNAs that share the similar miRNA binding sites can influence each other by competing for the same miRNAs. For example, when RNA X and RNA Y share the similar miRNA binding sites (i.e. RNA X and RNA Y can be regulated by the same miRNAs), up‐regulation of RNA Y would decrease cellular concentrations of the miRNAs, resulting in the derepression of RNA X, and vice versa. Ala et al. [5] reported that the ceRNA interactions play an important role in gene regulation. In addition, it has been illustrated that the ceRNA activity plays an important role in cancer and other pathological conditions [4, 6]. Therefore, it would be helpful if we try to understand the biological mechanism of diseases from the overall view of ceRNA network. Knowing the RNA pairs may have the similar biological functions with the other RNA pairs which compete for the miRNA sponges with them [6, 7], some researchers have recently used the ceRNA pairs to identify the functions of new RNAs. However, as far as we know, there have been no methods to identify the ceRNA network and reveal its roles in the process of the disease. To simplify the process, we only concentrate on the competing gene pairs. Based on the miRNA and mRNA expression data of specific disease as well as the regulating relations between miRNAs and the targets, we propose a computational method to construct the ceRNA network, which involves checking whether the shared miRNA sponges between the gene pairs are significant. It is noteworthy that our disease‐specific ceRNA network is different from previous works, which analyse the roles of the miRNA gene interactions in the disease or biological processes by a combination of the miRNA expression data and mRNA expression data or protein expression data [8, 9], because our work pay attention to the roles of the ceRNA interactions (gene–gene interactions) in the disease roles. In addition, our ceRNA network is not the same as the gene–gene interactions such as the co‐expression network [10]. In our network, only the competing gene pairs, whose shared miRNA sponges are significant, would be obtained.
For breast cancer, it is essential to identify prognostic gene markers if we want to study the metastasis mechanism in breast cancer and find out the candidate targets for therapy. Up to now, many methods have been proposed to identify gene signatures that have discriminative capability in their original data sets [11–13]. However, these gene markers are not stable across different data sets [14]. Besides, their discriminative capabilities are not even significantly better than the random signatures with the same size [15]. Therefore, it is critical to detect gene signatures that have robust discriminating abilities across different data sets. As the ceRNA network may provide us with a new perspective on studying the biological mechanism, we try to construct the ceRNA network based on breast cancer data sets. In the constructed network, the communities (dense clusters) are shown to be functionally meaningful. Moreover, hub genes in the network are found to be significantly related to breast cancer. Based on the network, we can identify the prognostic genes by selecting the discriminative hub genes whose discriminative abilities are very stable across different data sets. At last, in order to evaluate the stability of our method, we also investigate the overlap of both the hubs and the discriminative hubs in different ceRNA networks which are constructed on different data sets or parameters.
2 Methods
2.1 Data sets and preprocessing
The miRNA and mRNA expression data of 101 breast cancer patients were downloaded from NCBI (National Center for Biotechnology Information Gene Expression Omnibus) with accession number of GSE19783 [16]. The former was performed with the platform of Agilent Human miRNA Microarray 2.0, and the latter was performed with Agilent‐014850 Whole Human Genome Microarray 4 × 44 K G4112F. We also downloaded the mRNA expression data and the corresponding clinic information (time to distant metastasis and status of distant metastasis) of four breast cancer data sets with accession numbers of GSE2034 [11], GSE1456 [17], GSE4922 [18] and GSE7390 [19]. All these data sets were performed using Affymetrix HG‐U133A gene‐chips, and normalised with the algorithm MAS5. All the probes in the mRNA expression data were mapped to Entrez Gene ID and the values of these probes to each gene were averaged. The details of all these expression data are shown in Table 1. We downloaded the miRNA‐target relations from the targetScan version 6.0 [20].
Table 1.
Data sets used in this work
In order to evaluate the stability of our method, we also used different miRNA target relations and breast cancer data sets to construct the ceRNA network. In this situation, we not only used the miRNA target relations predicted by miRanda [21] but also used 284 matched miRNA expression profiles and mRNA expression profiles of breast cancer patients from TCGA (The Cancer Genome Atlas).
2.2 Main framework to construct ceRNA network
According to the ceRNA hypothesis, RNAs sharing the same miRNA regulators can influence each other by competing for the limited number of miRNA sponges. These RNAs competing with each other consist of the ceRNA pairs. In terms of genes, we can find out whether two genes interact with each other through checking the same miRNA sponges competed by these genes. All such significant gene pairs constitute the ceRNA network. The main frame of the method is shown as Fig. 1.
(1) First, for each gene, all its miRNAs regulators were collected as miRNA‐gene pairs from the database targetScan.
(2) Secondly, a Pearson correlation coefficient was calculated for each miRNA‐gene pair by using the miRNA and gene expression data of 101 patients in GSE19783, and all negatively correlated pairs with p ‐values less than 0.05 were retained.
(3) Thirdly, based on the filtered miRNA‐target pairs, we put all the miRNAs targeting to each gene into a miRNA set.
-
(4) Fourth, given each gene pair (A,B), we denoted all their regulator miRNAs as miRNA set C (regulating gene A) and D (regulating gene B), respectively, and then used hypergeometric cumulative distribution function test to test whether the common miRNA sponges between the two genes were significant.
Fig. 1.
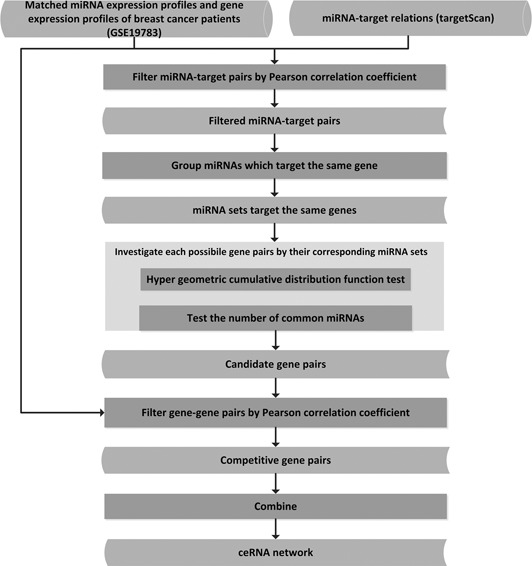 Main framework of constructing the ceRNA network
where x stands for the number of common miRNAs that regulate both of the two genes, U is the number of all the miRNAs in this work, M is the size of miRNA set C and N is the size of miRNA set D. As a result, only the gene pairs with a p ‐value less than 0.05 and number of common miRNAs of no less than a threshold (set as 3 by experience in this work) were kept as the candidate ceRNA pairs.
(5) It has been reported that if two genes compete with each other, their expression levels would show the similar tendency [4]. Thus, for each candidate ceRNA pair, we calculated their Pearson correlation coefficient based on gene expression data in GSE19783, and only positively correlated pairs with a p ‐value less than 0.05 would be set as the final ceRNA pairs.
(6) Finally, we combined all the ceRNA pairs together to construct the ceRNA network.
2.3 Network visualisation and communities detection
The ceRNA network was visualised by Cytoscape 3.0.2 and topology analysis was performed by the network analyser plugin for Cytoscape [22]. In addition, we used the MCODE plugin [23] (with its default parameters) for Cytoscape to find the communities (dense clusters) in the network.
2.4 Selection of hub genes
On the one hand, it is reported that the hub genes with higher degrees in biological networks are more likely to be essential [24–27]. On the other hand, experimental studies have demonstrated that nearly 20% of the nodes in a network are essential [25, 26]. Thus in this work, we select the top 20% of genes with the highest degrees in the ceRNA network as the hub genes.
2.5 Functional analysis
In this work, we used DAVID [28] to find out the functional gene sets (KEGG pathways and Go Term biological processes) which were enriched by the hub genes or the communities in the ceRNA network. The ones with p ‐values of less than 0.05 were set as enriched gene sets.
2.6 Evaluation of the gene's distinguishing ability
We used resampling method to evaluate the distinguishing abilities of the candidate (hub) genes. First, we selected 75% of all 286 samples in GSE2034 randomly, and then we estimated the coefficient between each gene's expression levels and the distant metastasis risks across the chosen patients by Cox proportional hazards regression. We repeated the resample procedures for 400 times. Only the genes with Cox p ‐value < = 0.05 in more than 90% of 400 runs were regarded as the discriminative genes. The parameters (Cox coefficient, Cox p ‐value) of each gene in the 400 repeats were averaged as the final parameters.
2.7 Distinguishing metastasis risks of breast cancer patients
We applied similar strategy as the gene expression grade index [29] to calculate the risk scores of the patients based on the discriminative hub genes, which is shown as the following formula
xi (xj ) represents the expression levels of the gene i (gene j) which is with positive (negative) Cox coefficient. All the patients were divided into the high risk group and the low group equally according to their risk scores. The log rank test as well as the Kaplan Meier curves was performed using a MATLAB tool [30].
3 Results
3.1 Breast‐cancer‐specific ceRNA network
Based on the matched gene expression and miRNA expression data of breast cancer patients, we got a total number of 43232 significant ceRNA pairs, all of which made up the breast‐cancer‐specific ceRNA network that contains 1751 nodes (Fig. 2). The average degree of the nodes in the network is 49.38, which indicates that our ceRNA network is very dense and such competitions among RNAs are common in biological processes. By investigating the network, we found that the degrees of the nodes fit power law distribution very well, with the correlation of 0.98 and the R ‐square of 0.80 (data not shown). This result indicates that our ceRNA network is scale‐free and the topological components such as the hub nodes and communities may be biologically significant.
Fig. 2.
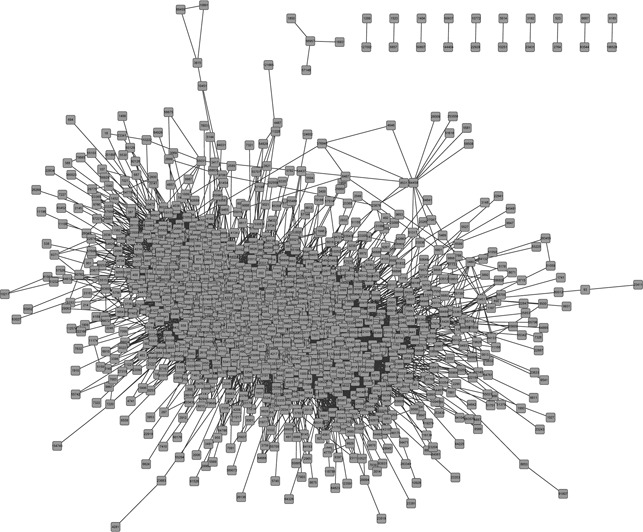
Breast‐cancer‐specific ceRNA network
3.2 Top communities in the network are related to cancer hallmarks
Communities in biological networks may work as a functional unit, for example, the community in protein–protein interaction network may be a protein complex. Thus we checked whether the genes in a community of the ceRNA network could play an important role in cancer by competing with each other. For each of the detected 32 communities, we annotated its function as the most significant functional gene set of it (Method). The function annotations of the top five communities are shown in Table 2, from which we can see that most of the communities are actually cancer‐related, such as vasculature development (cluster 1), enzyme linked receptor protein signalling pathway (cluster 2) and negative regulation of macromolecule metabolic process (cluster 5). Since vasculature is the target for cancer therapy [31], vasculature development may be associated with cancer. As to enzyme linked receptor protein signalling pathway, enzymes are common therapy for cancer [32, 33]. Moreover, metabolic reprogramming is reported to be a cancer hallmark [34]. As to cluster 4 (Fig. 3), three out of 12 genes in the cluster are involved in the Go Term ‘cell division’ (with a p ‐value of 0.002). It indicates that the genes in cluster 4 may compete with each other to regulate cell division, while the increase of cell division is a cause of human cancer [35].
Table 2.
Function annotation of the top five clusters
| Cluster | Number of genes | Annotation | p ‐value |
|---|---|---|---|
| cluster 1 | 192 | Go Term: vasculature development | 9.82 × 10⁻⁵ |
| cluster 2 | 228 | Go Term: enzyme linked receptor protein signalling pathway | 3.64 × 10⁻⁴ |
| cluster 3 | 143 | Go Term: skin development | 7.54 × 10⁻⁵ |
| cluster 4 | 12 | Go Term: cell division | 0.019 |
| cluster 5 | 72 | Go Term: negative regulation of macromolecule metabolic process | 8.82 × 10⁻⁴ |
Fig. 3.
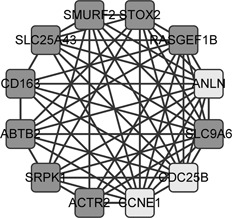
Cluster ‘cell division’
The light grey nodes are the genes involved in the Go Term
3.3 Hub genes in the network are biologically meaningful
In our ceRNA network, with the hypothesis that the genes competing with more genes may be more essential, we selected 20% of all the genes in the ceRNA network (350 genes) as hubs and used it to do functional analysis to check whether it can uncover some biological mechanism in breast cancer. The enriched functional gene sets of the top five are shown in Table 3.
Table 3.
Top five enriched gene sets
| Gene set | The number of overlap | p ‐value |
|---|---|---|
| Go Term: vasculature development | 20 | 7.22 × 10⁻⁷ |
| Go Term: blood vessel development | 19 | 2.18 × 10⁻⁶ |
| Go Term: positive regulation of cell motion | 11 | 2.62 × 10⁻⁵ |
| pathway: Glioma | 9 | 3.10 × 10⁻⁵ |
| GO: regulation of cell motion | 15 | 3.45 × 10⁻⁵ |
From this table, it is clear that most of these enriched gene sets are cancer related. The pathway ‘Glioma’ is enriched with a p ‐value of 3.10 × 10⁻⁵, while brain is reported to be a common metastasis organ of breast cancer [36]. In addition, lymphatic vasculature development is associated with the metastasis of cancer patients [37], and the Go Term ‘vasculature development’ is also on the top. Moreover, blood vessel development is enriched with a very small p ‐value, and tumour blood vessels are reported to have many abnormalities [38]. The other two significant Go Term biological processes are about cell motion, while the cell motion of tumour are related to cancer metastasis [39]. In a word, hub genes in the ceRNA network are biologically meaningful, which may indicate that our ceRNA network based on data sets of specific disease can indeed uncover the biological mechanism in the disease.
3.4 Discriminative hub genes can distinguish metastasis risks of breast cancer patients
As described above, the hub genes in our ceRNA network are breast cancer related; thus the discriminative genes among the hubs may be good biomarkers. We used resampling method to select the prognostic genes that may be related to cancer prognosis on GSE2034 and found 12 hubs are discriminative (Table 4). In addition, five out of the 12 are reported to be breast cancer related [40].
Table 4.
Twelve‐gene signature
| Gene ID | Gene symbol | Cox coefficient | Cox p ‐value | Stability |
|---|---|---|---|---|
| 2146 | EZH2 | 0.33 | 0.011 | 0.9675 |
| 2152 | F3 | −0.18 | 0.017 | 0.925 |
| 3572 | IL6ST | −0.46 | 0.0069 | 0.975 |
| 6241 | RRM2 | 0.37 | 0.0038 | 0.9975 |
| 7041 | TGFB1I1 | 0.53 | 0.0051 | 0.99 |
| 7133 | TNFRSF1B | −0.41 | 0.014 | 0.9525 |
| 8445 | DYRK2 | 0.75 | 0.0021 | 0.9975 |
| 9891 | NUAK1 | 0.33 | 0.012 | 0.97 |
| 10628 | TXNIP | −0.50 | 0.0011 | 1 |
| 23213 | SULF1 | 0.33 | 0.017 | 0.9075 |
| 26959 | HBP1 | −0.40 | 0.011 | 0.9625 |
| 51339 | DACT1 | 0.52 | 0.0064 | 0.99 |
The stability of a gene is the ratio of the gene which is significant in the 400 resampling runs. And the five genes (Gene ID: 2146, 2152, 10628, 23213, 26959) are the reported breast cancer genes
Then we used the 12 prognostic genes to predict the metastasis risk for breast cancer patients in GSE2034 as well as three independent data sets. In GSE2034, the hazard ratio between the two groups divided by the risk scores based on the 12 genes is 4.80 (95% CI 3.04–7.57), and the log rank p ‐value is 8.66 × 10⁻¹⁴ (Fig. 4 a), which shows our signature can discriminate the metastasis risks of breast cancer patients in the train data set significantly. In addition, the performances of the 12 genes are also good in the other three independent data sets. The hazard ratio is 3.43 (95% CI 1.68–7.02) and the p ‐value is 0.00015 in GSE1456 (Fig. 4 b). As to GSE4922, the hazard ratio is 1.69 (95% CI 1.09–2.62) and the p ‐value is 0.012 (Fig. 4 c). In GSE7390, the hazard ratio is 2.02 (95% CI 1.20–3.38) and the p ‐value is 0.0037 (Fig. 4 d). For the purposes of comparing, we also used the 12 genes (Supplementary table 1), which are the most significantly correlative with the metastasis risks of breast cancer by resampling method, to predict the prognosis of breast cancer patients with the same strategy. The p ‐values of its partitions on the four data sets are 1.31 × 10⁻¹², 0.336, 0.150 and 0.0005 separately (Supplementary table 2), which show that the discriminative genes without being filtered by the degree perform badly. In addition, it is reported that the most published gene signature are not discriminative across different data sets, and even not better than the random gene signatures with the same size [15]; the good and stable discriminative capability of our gene signature shows that these genes are good biomarker candidates. As we know, the main difference between our signature and the published signatures is that our signatures are the hubs in the ceRNA network, which may indicate our ceRNA network can reveal the biological mechanism in breast cancer.
Fig. 4.
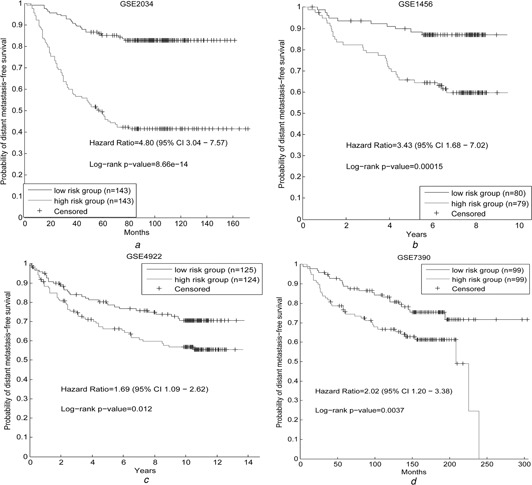
Survival analysis
GSE2034 is the train data set and the other three are independent data sets
3.5 Discriminative hub genes are stable in ceRNA networks constructed using different data sets or parameters
As described above, our discriminative hubs can distinguish the metastasis risks of cancer patients across different data sets, which may indicate that the discriminative hubs in our ceRNA network are good biomarker candidates. In order to validate our method, we test whether both the discriminative hubs and the hubs are stable when the ceRNA networks are constructed in different situations.
In this work, we used the miRNA targets predicted by targetScan to construct the original ceRNA network. For the purpose of comparison, we also used the mRNA‐target relations predicted by miRanda [21], another famous miRNA target prediction tool, to construct a new ceRNA network by the same strategy. As a result, the new ceRNA network contains 6800 genes and 458873 edges. As known, the targets of a miRNA predicted by different tools vary greatly, thus it may be not odd that the scales of the ceRNA networks constructed using different miRNA target relations vary too. However, most of the hubs are overlapped. Among the 350 hubs in the ceRNA network constructed using data of targetScan, 286 genes are also the hubs of the ceRNA network constructed using the miRNA‐target relations predicted by miRanda (Fig. 5 a). We also investigated whether the discriminative hubs are stable across the two ceRNA networks and then found that 9 out of 12 discriminative hubs of our original ceRNA network are also the discriminative hubs in the ceRNA network constructed using the miRNA‐target relations predicted by miRanda (Fig. 5 b). The high degree of overlap between the two ceRNA networks’ hubs (discriminative hubs) shows that the hubs (discriminative hubs) are stable across different miRNA‐target prediction tools.
Fig. 5.
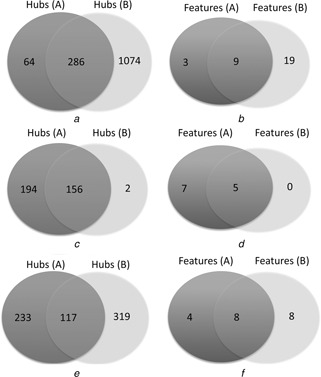
Intersections of the hubs (discriminative hubs) from the ceRNA networks constructed using different data sets or parameters
Fig. 5 a (Fig. 5 b) are the intersections of the hubs (discriminative hubs) from the ceRNA networks constructed using different miRNA‐target prediction tools; Fig. 5 c (Fig. 5 d) are the intersections of the hubs (discriminative hubs) from the ceRNA networks constructed using different thresholds of p ‐values; Fig. 5 e (Fig. 5 f) are the intersections of the hubs (discriminative hubs) from the ceRNA networks constructed using different breast cancer data sets
We used a threshold of p ‐value as 0.05 to construct the ceRNA network in this work. To check whether the hubs (discriminative hubs) will vary sharply when the networks were constructed with different thresholds of the p ‐values, we used the threshold of false discovery rate for multiple hypothesis testing [41] as 0.05 to construct the ceRNA network. As a result, the new ceRNA network contains 771 nodes and 11902 edges. Then 158 genes were selected as hubs, compared with the 350 hubs in the ceRNA network constructed with the threshold of p ‐value as 0.05, we found that 156 genes are overlapped between the two hub sets (Fig. 5 c). As to the discriminative hubs, five are overlapped between the two discriminative hub sets (Fig. 5 d). From this result, it is clear that the multiple hypothesis testing can reduce the scale of the ceRNA network. However, most of the linked genes are still retained. Furthermore, we took the same number of genes with the hubs of original ceRNA network as the hub sets, and found that 272 genes are common (Fig. S1.a). As to the discriminative hubs, nine genes are the same in the two discriminative hub sets (Fig. S1.b). In a word, the hubs as well as the discriminative hubs are stable with different thresholds of p ‐values.
In this work, we constructed the ceRNA network by using GSE19783, which contains mRNA expression profiles and corresponding expression profiles of 101 breast cancer patients. In order to test whether the hubs as well as discriminative hubs of the ceRNA network are stable across the ceRNA networks constructed using different data sets, we also used 284 matched miRNA expression profiles and mRNA expression profiles of breast cancer patients from TCGA (The Cancer Genome Atlas) to construct a new ceRNA network, which contains 2177 nodes and 102754 edges. As a result, 436 genes were selected as hubs, in which 16 genes are discriminative. In the original ceRNA network, 350 are hubs and 12 of the hubs are discriminative. Of the two hub sets, 117 genes are the same. As to the discriminative hub sets (Fig. 5 e), 8 genes are overlapped (Fig. 5 f). From this result, it is clear that the hub genes as well as discriminative hubs between the two ceRNA networks are highly overlapped, especially the discriminative hubs, most of which are the same. Thus, a conclusion can be drawn that the hubs and discriminative hubs are stable across the ceRNA network constructed using different breast cancer data sets.
As described above, the hub genes and discriminative hubs are stable when the ceRNA network is constructed with different miRNA‐target prediction tools, thresholds of p ‐values and breast cancer data sets. The stability of the discriminative hubs may explain the stable distinguishing capability of the discriminative hubs across all the independent data sets. All this results validate the stability of our method and prove it can be used to understand the biological mechanism of disease.
4 Discussion and conclusion
In this work, based on the ceRNA hypothesis, we proposed a computational method to construct the ceRNA network according to breast cancer data. In the network, the connective nodes are the gene pairs that are competing with each other for the limited pool of miRNAs. The breast‐cancer‐specific ceRNA network is shown to be scale‐free, and communities (dense clusters) in the network are related to cancer hallmarks. In addition, the hub genes in the network are annotated with functional gene sets related to breast cancer. Moreover, 12 discriminative genes among the hubs have been shown to be able to distinguish the metastasis risks of patients not only in the train data set, but also in other three independent data sets. The hubs and discriminative hubs are also stable in the ceRNA networks constructed on different data sets or parameters. The promising results suggest that the constructed ceRNA network can indeed reveal the biological mechanism in the disease.
Our work provides a simple frame to construct the ceRNA network that can be applied in various biological areas, such as the study of disease and the study of biological processes. Of course, there are also some limits in our work. First, because of inadequate knowledge about ceRNA pairs, the ceRNA pairs inferred by our method have not been validated directly. Secondly, in this work, we only consider the competing mRNA pairs. In fact, transcribed pseudo genes and long coding RNAs can also get involved in the process of competing for the miRNA sponges.
5 Acknowledgments
The paper is financially aided by the National Science Foundation of China (61272274, 60970063), the program for New Century Excellent Talents in Universities (NCET‐10‐0644), the PhD Programs Foundation of Ministry of Education of China (20090141110026), as well as the Fundamental Research Funds for the Central Universities (2012211020208, 2012211020204).
6 References
- 1. Baek D. Villen J. Shin C. Camargo F.D. Gygi S.P., and Bartel D.P.: ‘The impact of microRNAs on protein output’, Nature, 2008, 455, pp. 64–71 (doi: 10.1038/nature07242) [DOI] [PMC free article] [PubMed] [Google Scholar]
- 2. Chen C.Z. Li L. Lodish H.F., and Bartel D.P.: ‘MicroRNAs modulate hematopoietic lineage differentiation’, Science, 2004, 303, pp. 83–86 (doi: 10.1126/science.1091903) [DOI] [PubMed] [Google Scholar]
- 3. Schmittgen T.D.: ‘Regulation of microRNA processing in development, differentiation and cancer’, J. Cell. Mol. Med., 2008, 12, pp. 1811–1819 (doi: 10.1111/j.1582-4934.2008.00483.x) [DOI] [PMC free article] [PubMed] [Google Scholar]
- 4. Salmena L. Poliseno L. Tay Y. Kats L., and Pandolfi P.P.: ‘A ceRNA hypothesis: the Rosetta Stone of a hidden RNA language?’, Cell, 2011, 146, pp. 353–358 (doi: 10.1016/j.cell.2011.07.014) [DOI] [PMC free article] [PubMed] [Google Scholar]
- 5. Ala U. Karreth F.A., and Bosia C. et al.: ‘Integrated transcriptional and competitive endogenous RNA networks are cross‐regulated in permissive molecular environments’, Proc. Natl. Acad. Sci. USA, 2013, 110, pp. 7154–7159 (doi: 10.1073/pnas.1222509110) [DOI] [PMC free article] [PubMed] [Google Scholar]
- 6. Tay Y. Kats L., and Salmena L. et al.: ‘Coding‐independent regulation of the tumor suppressor PTEN by competing endogenous mRNAs’, Cell, 2011, 147, pp. 344–357 (doi: 10.1016/j.cell.2011.09.029) [DOI] [PMC free article] [PubMed] [Google Scholar]
- 7. Liu K. Yan Z. Li Y., and Sun Z.: ‘Linc2GO: a human LincRNA function annotation resource based on ceRNA hypothesis’, Bioinformatics, 2013, 29, pp. 2221–2222 (doi: 10.1093/bioinformatics/btt361) [DOI] [PubMed] [Google Scholar]
- 8. Muniategui A. Pey J. Planes F.J., and Rubio A.: ‘Joint analysis of miRNA and mRNA expression data’, Brief. Bioinf., 2013, 14, pp. 263–278 (doi: 10.1093/bib/bbs028) [DOI] [PubMed] [Google Scholar]
- 9. Clarke C. Henry M., and Doolan P. et al.: ‘Integrated miRNA, mRNA and protein expression analysis reveals the role of post‐transcriptional regulation in controlling CHO cell growth rate’, BMC Genomics, 2012, 13, p. 656 (doi: 10.1186/1471-2164-13-656) [DOI] [PMC free article] [PubMed] [Google Scholar]
- 10. Stuart J.M. Segal E. Koller D., and Kim S.K.: ‘A gene‐coexpression network for global discovery of conserved genetic modules’, Science, 2003, 302, pp. 249–255 (doi: 10.1126/science.1087447) [DOI] [PubMed] [Google Scholar]
- 11. Wang Y.X. Klijn J.G.M., and Zhang Y. et al.: ‘Gene‐expression profiles to predict distant metastasis of lymph‐node‐negative primary breast cancer’, Lancet, 2005, 365, pp. 671–679 (doi: 10.1016/S0140-6736(05)17947-1) [DOI] [PubMed] [Google Scholar]
- 12. van de Vijver M.J. He Y.D., and van't Veer L.J. et al.: ‘A gene‐expression signature as a predictor of survival in breast cancer’, N. Engl. J. Med., 2002, 347, pp. 1999–2009 (doi: 10.1056/NEJMoa021967) [DOI] [PubMed] [Google Scholar]
- 13. Miller L.D. Smeds J., and George J. et al.: ‘An expression signature for p53 status in human breast cancer predicts mutation status, transcriptional effects, and patient survival’, Proc. Natl. Acad. Sci. USA, 2005, 102, pp. 13550–13555 (doi: 10.1073/pnas.0506230102) [DOI] [PMC free article] [PubMed] [Google Scholar]
- 14. Chuang H.Y. Lee E. Liu Y.T. Lee D., and Ideker T.: ‘Network‐based classification of breast cancer metastasis’, Mol. Syst. Biol., 2007, 3, p. 140 (doi: 10.1038/msb4100180) [DOI] [PMC free article] [PubMed] [Google Scholar]
- 15. Venet D. Dumont J.E., and Detours V.: ‘Most random gene expression signatures are significantly associated with breast cancer outcome’, PLoS Comput. Biol., 2011, 7, p. e1002240 (doi: 10.1371/journal.pcbi.1002240) [DOI] [PMC free article] [PubMed] [Google Scholar]
- 16. Enerly E. Steinfeld I., and Kleivi K. et al.: ‘miRNA–mRNA integrated analysis reveals roles for miRNAs in primary breast tumors’, PLoS One, 2011, 6, p. e16915 (doi: 10.1371/journal.pone.0016915) [DOI] [PMC free article] [PubMed] [Google Scholar]
- 17. Pawitan Y. Bjohle J., and Amler L. et al.: ‘Gene expression profiling spares early breast cancer patients from adjuvant therapy: derived and validated in two population‐based cohorts’, Breast Cancer Res., 2005, 7, pp. R953–R964 (doi: 10.1186/bcr1325) [DOI] [PMC free article] [PubMed] [Google Scholar]
- 18. Ivshina A.V. George J., and Senko O. et al.: ‘Genetic reclassification of histologic grade delineates new clinical subtypes of breast cancer’, Cancer Res., 2006, 66, pp. 10292–10301 (doi: 10.1158/0008-5472.CAN-05-4414) [DOI] [PubMed] [Google Scholar]
- 19. Desmedt C. Piette F., and Loi S. et al.: ‘Strong time dependence of the 76‐gene prognostic signature for node‐negative breast cancer patients in the TRANSBIG multicenter independent validation series’, Clin. Cancer Res., 2007, 13, pp. 3207–3214 (doi: 10.1158/1078-0432.CCR-06-2765) [DOI] [PubMed] [Google Scholar]
- 20. Garcia D.M. Baek D. Shin C. Bell G.W. Grimson A., and Bartel D.P.: ‘Weak seed‐pairing stability and high target‐site abundance decrease the proficiency of Lsy‐6 and other microRNAs’, Nat. Struct. Mol. Biol., 2011, 18, pp. 1139–1146 (doi: 10.1038/nsmb.2115) [DOI] [PMC free article] [PubMed] [Google Scholar]
- 21. Betel D. Koppal A. Agius P. Sander C., and Leslie C.: ‘Comprehensive modeling of microRNA targets predicts functional non‐conserved and non‐canonical sites’, Genome Biol., 2010, 11, p. R90 (doi: 10.1186/gb-2010-11-8-r90) [DOI] [PMC free article] [PubMed] [Google Scholar]
- 22. Assenov Y. Ramirez F. Schelhorn S.E. Lengauer T., and Albrecht M.: ‘Computing topological parameters of biological networks’, Bioinformatics, 2008, 24, pp. 282–284 (doi: 10.1093/bioinformatics/btm554) [DOI] [PubMed] [Google Scholar]
- 23. Bader G.D., and Hogue C.W.: ‘An automated method for finding molecular complexes in large protein interaction networks’, BMC Bioinf., 2003, 4, p. 2 (doi: 10.1186/1471-2105-4-2) [DOI] [PMC free article] [PubMed] [Google Scholar]
- 24. Hase T. Tanaka H. Suzuki Y. Nakagawa S., and Kitano H.: ‘Structure of protein interaction networks and their implications on drug design’, PLoS Comput. Biol., 2009, 5, p. e1000550 (doi: 10.1371/journal.pcbi.1000550) [DOI] [PMC free article] [PubMed] [Google Scholar]
- 25. Giaever G. Chu A.M., and Ni L. et al.: ‘Functional profiling of the Saccharomyces cerevisiae genome’, Nature, 2002, 418, pp. 387–391 (doi: 10.1038/nature00935) [DOI] [PubMed] [Google Scholar]
- 26. Song J.M., and Singh M.: ‘From hub proteins to hub modules: the relationship between essentiality and centrality in the yeast interactome at different scales of organization’, PLoS Comput. Biol., 2013, 9, p. e1002910 (doi: 10.1371/journal.pcbi.1002910) [DOI] [PMC free article] [PubMed] [Google Scholar]
- 27. Hahn M.W., and Kern A.D.: ‘Comparative genomics of centrality and essentiality in three eukaryotic protein‐interaction networks’, Mol. Biol. Evol., 2005, 22, pp. 803–806 (doi: 10.1093/molbev/msi072) [DOI] [PubMed] [Google Scholar]
- 28. Huang D.W. Sherman B.T., and Lempicki R.A.: ‘Systematic and integrative analysis of large gene lists using DAVID bioinformatics resources’, Nat. Protocols, 2009, 4, pp. 44–57 (doi: 10.1038/nprot.2008.211) [DOI] [PubMed] [Google Scholar]
- 29. Sotiriou C. Wirapati P., and Loi S. et al.: ‘Gene expression profiling in breast cancer: understanding the molecular basis of histologic grade to improve prognosis’, J. Natl. Cancer Inst., 2006, 98, pp. 262–272 (doi: 10.1093/jnci/djj052) [DOI] [PubMed] [Google Scholar]
- 30. Cardillo G.: ‘LogRank: Comparing survival curves of two groups using the log rank test’, 2008.
- 31. Jain R.K.: ‘Normalization of tumor vasculature: an emerging concept in antiangiogenic therapy’, Science, 2005, 307, pp. 58–62 (doi: 10.1126/science.1104819) [DOI] [PubMed] [Google Scholar]
- 32. Hlavaty J. Petznek H., and Holzmuller H. et al.: ‘Evaluation of a gene‐directed enzyme‐product therapy (GDEPT) in human pancreatic tumor cells and their use as in vivo models for pancreatic cancer’, PLoS One, 2012, 7, p. e40611 (doi: 10.1371/journal.pone.0040611) [DOI] [PMC free article] [PubMed] [Google Scholar]
- 33. Dachs G.U. Tupper J., and Tozer G.M.: ‘From bench to bedside for gene‐directed enzyme prodrug therapy of cancer’, Anti‐Cancer Drugs, 2005, 16, pp. 349–359 (doi: 10.1097/00001813-200504000-00001) [DOI] [PubMed] [Google Scholar]
- 34. Ward P.S., and Thompson C.B.: ‘Metabolic reprogramming: a cancer hallmark even Warburg did not anticipate’, Cancer Cell, 2012, 21, pp. 297–308 (doi: 10.1016/j.ccr.2012.02.014) [DOI] [PMC free article] [PubMed] [Google Scholar]
- 35. Preston‐Martin S. Pike M.C. Ross R.K. Jones P.A., and Henderson B.E.: ‘Increased cell division as a cause of human cancer’, Cancer Research, 1990, 50, pp. 7415–7421 [PubMed] [Google Scholar]
- 36. Bos P.D. Zhang X.H.F., and Nadal C. et al.: ‘Genes that mediate breast cancer metastasis to the brain’, Nature, 2009, 459, pp. 1005–1009 (doi: 10.1038/nature08021) [DOI] [PMC free article] [PubMed] [Google Scholar]
- 37. Saharinen P. Tammela T. Karkkainen M.J., and Alitalo K.: ‘Lymphatic vasculature: development, molecular regulation and role in tumor metastasis and inflammation’, Trends Immunol., 2004, 25, pp. 387–395 (doi: 10.1016/j.it.2004.05.003) [DOI] [PubMed] [Google Scholar]
- 38. Baluk P. Hashizume H., and McDonald D.M.: ‘Cellular abnormalities of blood vessels as targets in cancer’, Curr. Opin. Genet. Dev., 2005, 15, pp. 102–111 (doi: 10.1016/j.gde.2004.12.005) [DOI] [PubMed] [Google Scholar]
- 39. Parri M., and Chiarugi P.: ‘Rac and Rho GTPases in cancer cell motility control’, Cell Commun. Signal., 2010, 8, p. 23 (doi: 10.1186/1478-811X-8-23) [DOI] [PMC free article] [PubMed] [Google Scholar]
- 40. Peng K. Xu W., and Zheng J. et al.: ‘The disease and gene annotations (DGA): an annotation resource for human disease’, Nucl. Acids Res., 2013, 41, pp. D553–60 (doi: 10.1093/nar/gks1244) [DOI] [PMC free article] [PubMed] [Google Scholar]
- 41. Storey J.D.: ‘A direct approach to false discovery rates’, J. R. Stat. Soc. Ser. B‐Stat. Methodol., 2002, 64, pp. 479–498 (doi: 10.1111/1467-9868.00346) [DOI] [Google Scholar]