

Abstract
Alzheimer's disease (AD) is a severe neurodegenerative disorder without curative treatment. Extensive data on pathological molecular processes have been accumulated over the last years. These data combined allows a systems biology approach to identify key regulatory elements of AD and to establish a model descriptive of the disease process which can be used for the development of therapeutic agents. In this study, the authors propose a closed network that uses a set of nodes (amyloid beta, tau, beta‐secretase, glutamate, cyclin‐dependent kinase 5, phosphoinositide 3‐kinase and hypoxia‐induced factor 1 alpha) as key elements of importance to the pathogenesis of AD. The proposed network, in total 39 nodes, is able to become a novel tool capable of providing new insights into AD, such as feedback loops. Further, it highlights interconnections between pathways and identifies their combination for therapy of AD.
Inspec keywords: diseases, medical disorders, neurophysiology, enzymes, molecular biophysics, biochemistry, patient treatment, bioinformatics, medical computing
Other keywords: Alzheimer’s disease, neurodegenerative disorder, amyloid beta, TAU, beta‐secretase, glutamate, cyclin‐dependent kinase 5, phosphoinositide 3‐kinase, hypoxia‐induced factor 1 alpha, pathogenesis, feedback loops, pathway interconnections, closed network, pathological molecular processes, systems biology approach
1 Introduction
Alzheimer's disease (AD) is a complex neurodegenerative disorder [1, 2]. Even though it is subject to extensive research, early diagnostics and curative treatments are not available to date [3]. Symptoms of AD overlap and may be confused with other forms of geriatric dementia. They include impairment of memory, confusion, mood swings and aggression as well as language problems [4]. The scientific data accumulated about AD is resourceful, ranging from experiments conducted in various cell lines over transgenic animal models to clinical trials [5, 6].
There are several theories on the pathogenesis of AD, the two most accepted in the scientific community involve misregulation of two genes [amyloid‐beta A4 precursor (APP) and tau] as well as their transcribed products. This misregulation can cause immense damage to both the exterior and interior of a nerve cell.
AD is a complex disease involving many genetic and environmental risk factors influencing certain subcellular processes. These molecules, such as APP, tau and glutamate, are not isolated in one cell but interact through signal transduction and transcriptional regulation.
Based on the basic properties of the regulatory network in biological systems, we have proposed an endogenous molecular–cellular network hypothesis [7, 8]. This hypothesis suggests that a minimal set of core molecular–cellular nodes interact with each other through signal transduction and gene regulation to form an endogenous molecular–cellular network. A quantitative description of the endogenous network consists of a set of non‐linear and coupled differential equations. The non‐linear dynamical interactions among the endogenous nodes can generate many local attractors with obvious or non‐obvious biological functions. We assume normal physiological and morbid homeostasis are endogenous attractors underlying the endogenous molecular–cellular network. The hypothesis has been applied to phage lambda and cancers [8, 9].
Networks in AD are often created to visualise and thereby comprehend combinations of sub‐cellular processes. We also show a method of defining stable states in networks.
Here, we use the endogenous network hypothesis to address the issues in AD. First, according to the accumulated molecular biology knowledge of AD, a minimal set of molecular–cellular agents are assumed as risk factors and molecular signatures of AD. Second, the interactions, activation/up‐regulation or inhibition/down‐regulation, among the agents were summarised from well‐documented gene regulatory network and signal transduction pathway which suggest that the interactions have solid biochemical basis. Third, the narrative and graphical form of endogenous network of AD in Fig. 1 was formalised by a set of differential equations, which provides unparalleled precision to test assumptions and define concepts and mechanisms under consideration [8, 10].
Fig. 1.
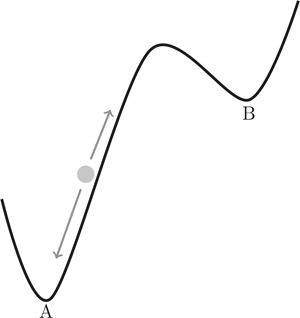
Illustration of the concept of an endogenous network that can show one to several distinct stable states, labelled A and B
The circle (status of a node) is being pulled by attractors into stable states A and B by directed forces (arrows)
As soon as it reaches a stable states, it will not leave the state without a strong force directed on it
2 Methods and results
2.1 Network design
2.1.1 Minimal set of molecular–cellular nodes for AD
According to the current understanding of AD at a molecular level, a minimal set of nodes has been selected to specify risk factors and molecular signatures of AD. There are several theories on cause and progression of AD. The APP and tau theories are the ones receiving broadest support in the scientific community. tau‐proteins stabilise the cellular cytoskeleton by binding microtubuli. Hyperphosphoryliation of tau to ptau leads to creation and accumulation of neurofibrillary tangles, resulting into Tauopathies such as AD. For these reasons, we chose amyloid beta (Aβ) and tau as nodes, since their aberrant regulation is highly involved in the pathogenesis of AD [11].
A main cause of AD are the APP aa 35–45 peptide segments. They are deposited in extracellular, dense, star‐like structures, accumulating either by increased production or by decreased clearance, by for example, microglia. In this network, we focus on increased production by a positive feedback loop. Other genes chosen as essential nodes are as follows.
The role of APP in healthy individuals is of regulatory nature, it only exist in primates and is highly homologous between humans and non‐human primates. The latter, however, seem to be mostly resistant to its adverse effects such as AD [12]. Murine models for research are transgenic models, what poses limitations to the research [13]. BACE is a β ‐secretase involved in cleaving the pathogenic segment off APP. Glutamate, the most abundant activating neurotransmitter in the brain, has a widespread function in healthy individuals. It is involved with memory and learning, two functions that get impaired by AD.
It was shown that Aβ induces glutamate secretion [14]. Glutamate has, besides its function in the healthy brain, an excitotoxic effect by overstimulating adjacent cells and was connected to AD [15]. It is assumed that a rise in extracellular glutamate levels caused by Aβ will increase the intracellular levels of Ca2+ in surrounding glutaminergic cells. Several neurological diseases are associated with excessive stimulation by activatory neurotransmitters (excitotoxicity). Studies showed that glutamate levels are increased in brains of AD patients [15].
One of the receptors of glutamate is NMDAR (N‐methyl‐D‐aspartate receptor); it allows for Ca2+ influx. Ca2+ has many different functions in nerve cells, the most common one is the depolarisation of the postsynaptic cell in a chemical synapse. Transmitters are stored in vesicles in the presynaptic nerve cell and fuse with the cell wall because of an ionic change caused by an action potential. They diffuse through the synaptic cleft and cause a change in the electrical membrane potential of the postsynaptic cell by ionic influx into the cell by transmitter‐regulated transporter proteins. Ca2+ is required by the calcium‐modulated protein (CaM). It is an intermediate messenger that, among others, activates the rat sarcoma (protooncogene) (RAS)/rat fibrosarcoma (RAF)‐pathway [16]. Ca2+ ions are as well of necessity for the function of the cleaving enzyme calpain, responsible for cleaving the CDK5 activator p35, creating its inhibitor p25. p25 and CDK5 form a complex that is over‐expressed in AD patients [17]. CDK5 was chosen for the network since it has been connected to AD [18] and hyperphosphorylates tau in a way similar to AD; its expression is increased in the brains of AD patients [19]. The healthy function of CDK5 lies in neuronal maturation and migration [20]. The p25–CDK5 complex inhibits tau by hyperphosphorylation; this inhibition can constitute incorrect tau function, contributing to AD. The CaM‐mediated effect on RAS activates RAF, but also activates PI3 K (phosphoinositide 3‐kinase), a family of enzymes involved in developmental cell functions. It is also part of the PI3 K/AKT/mTOR‐pathway which results in formation of the AKT/PKB‐complex. This complex initiates expression of HIF1α, hypoxia‐induced factor 1 alpha, increased in brains of AD patients. NF‐κ ‐B is a regulatory composite protein central to many healthy cellular processes (such as development and cellular homeostasis); misregulation of a regulatory gene can have many effects, among them, apparently, AD [21]. The PI3 K pathway has an activating effect on NF‐κ ‐B via its role in the PIP2/PIP3 transduction [22], via GEF and RAC1. Also affected is the AKT/PKB complex [23]. MAPK10 is a neuronal version of cJUN and a member of the MAPK family. It is associated with different kinds of cancer. It was shown, however, that this pathway is of importance to AD as well [24, 25]. HIF1α, hypoxia inducible transcription factor 1 alpha and its connection to oxygen deprivation, appears as essential to the pathogenesis of the disease [26]. In this family, transactivation is the result of phosphorylation. In our network, MAPK10 is inhibited by CDK5 [27] and tau [28, 29] and then has increasing interconnections to TGFβ [30] and a negative connection to NF‐κ ‐B [31], two other important regulatory groups. NF‐κ ‐B is of central importance for almost any regulatory network. In ours, it receives negative input from MAPK10 and PPARgamma [32] and positive input from carbon monoxide (CO) [33] and RAC1 [34]. It shows increasing effect on AKT [35]. HIF1α is a key node for its respective part of the network. It is of importance to AD, as was shown repeatedly [26] and has proven to be central in this network as well. It activates both BACH1 and NRF2 [36], two inhibitors of HO‐1, an enzyme creating CO, feeding back positively on NF‐κ ‐B. For our network, we assumed that a negative effect outweighs the direct positive effect by interconnection. tau protein is noted in Table 3 as being decreased, although it accumulates. This is because of its phosphorylation, which leads to loss of function and accumulation [37]. HIF1α is a protein that usually is expressed under an hypoxic environment. Several publications [26, 38, 39] showed its importance in AD.
Table 3.
Predicted expression levels from the network analysis ranging from 0 to 1 for the two stable states calculated from the network
| Node ID | Predicted AD | Literature AD | Reference |
|---|---|---|---|
| glutamate | ↑ | ⇑ | [43, 44] |
| NMDAR | ↑ | ⇑ | [45] |
| Ca2+ | ↑ | – | – |
| CaM | ↑ | – | – |
| RAS | ↑ | ⇑ | [46] |
| Shc1 | ↑ | – | – |
| RAF | ↑ | ⇑ | [47] |
| MEK1/2 | ↑ | ⇑ | [48] |
| ERK1/2 | ↑ | ⇑ | [48] |
| p35 | ↑ | – | – |
| Calpain | ↑ | ⇑ | [49] |
| CDK5 | – | – | [19, 50] |
| p25 | ↑ | ⇑ | [50] |
| CDK5/p25 | ↑ | ⇑ | [50] |
| tau | ↓ | ⇓ | [37] |
| RSH | ↑ | – | – |
| CREB | ↑ | ⇑ | [51] |
| PPARγ | ↓ | ⇓ | [52] |
| CEBPb | ↓ | – | – |
| NF‐κ ‐B | ↑ | ⇑ | [53] |
| CO | ↓ | ⇓ | [54] |
| RAC1 | ↑ | – | [55] |
| AKT | ↑ | ⇑ | [56] |
| PI3 K | ↑ | – | – |
| PIP3 | ↑ | – | [57] |
| GEF | ↑ | – | – |
| PDK1 | ↑ | – | – |
| AKT/PKB | ↑ | ⇑ | [56] |
| PRAS40 | ↓ | ⇓ | [58] |
| mTOR | ↑ | ⇑ | [59] |
| HIF1α | ↑ | ⇑ | [26] |
| BACE | ↑ | ⇑ | [60] |
| Aβ | ↑ | ⇑ | [61] |
| TGFβ | ↑ | – | – |
| MAPK10 | ↑ | ⇑ | [62] |
| TGFβ R1 | ↑ | – | – |
| BACH1 | ↑ | ⇑ | [63] |
| NRF2 | ↑ | ⇑ | [64] |
| HO1 | ↓ | ⇓ | [54] |
The arrows describe the relative expression of the nodes in the network
In the column ‘Predicted AD’ the gene expression of the healthy against diseased state was displayed as increased or decreased
Under the column ‘Literature AD’ they refer to increased/decreased availability in reference to their respective control groups
The minus sign refers to not yet available biochemical data
2.1.2 Interaction of the agents forms an endogenous AD network
After identifying key molecular factors, the activation/up‐regulation or inhibition/down‐regulation among these agents was summarised from well‐documented gene regulatory networks and signalling transduction pathways which suggest that the interactions have a solid biochemical basis. The hypothesis suggests that the agents and interactions between them form an autonomous and decision‐making network, which suggest that the transmission of information is not one way and there is no privileged causality in the network.
2.2 Calculations
Attractors, or specific node interconnections, are putting a directed force on a network's state, directing it to a stable state – in case of a medical network either a healthy or a diseased state. Once a network reaches one of them, it is unlikely that the state will change on its own without a very strong exogenous attractor affecting it. Equation (1) describes the irritation rule that is the basis for the calculations, a more detailed description is available [40]. The bioinformatic analysis of the network was based on the change of each node (protein, gene, molecule or ion). The rate of change is determined by ‘increasing effects’ (production, activation and intake) and ‘decreasing effects’ (degradation, inhibition and excretion). Increasing effects are determined by interactions (e.g. node interconnection) in the endogenous network and modelled by a sigmoid curve.
A network can have several steady states, formed by increasing and decreasing effects as shown in Fig. 1.
2.2.1 Quantification of the endogenous network
A quantitative description of the key endogenous network is possible by coupled differential equations [10, 41, 42].
We use PPARγ as example to show how to obtain the differentiation equations (Fig. 2). PPARγ is up‐regulated by CREB, while down‐regulated by Akt. The concentration or activity of PPARγ under the influence of the protein CREB and Akt takes the form in (1), where [PPARγ], [CREB], [Akt] refers to the protein concentration. f ([CREB], [Akt]) is the integrated production rate of PPARγ. (PPARγ /τ PPARγ ) is the degradation rate, it depends on the degradation constant τ PPARγ
| (1) |
When we further assume that the activation of PPARγ requires activated CREB, and at the same time is inactivated and Akt, the integrated production rate f ([CREB], [Akt]) is quantified by the Hill function, as displayed in the following equation
| (2) |
where V PPARγ is the maximal production rate of the protein PPARγ. n 11 is the Hill coefficient, K 11 is the dissociation constant, biochemical parameters describing the kinetic properties of each protein in regulating the production of PPARγ.
Fig. 2.
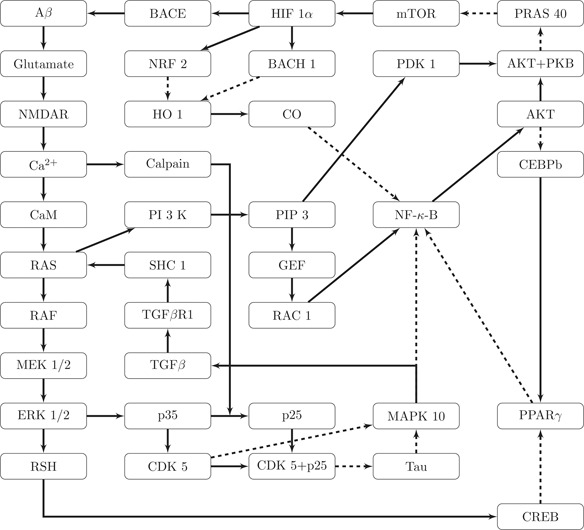
Closed AD network build around the key nodes APP, tau, BACE, Glutamate, CDK5, PI3 K and HIF1α
Solid lines indicate activating, dashed lines inhibitory effects
The number and complexity of yet unknown factors influencing cellular and sub‐cellular behaviour make it impossible to obtain all parameters needed for a complete bioinformatic model. We focused on the interaction properties that will not be influenced by the pitfalls of unavailable biochemical factors, but rather depend on logical interactions and their topological structure [42]. For our calculations, we considered a relative concentration or activity of the nodes by normalising them on a range from 0 (minimal content/activity) to 1 (maximal content/activity), following the concept of relative gene expression (known from e.g. microarrays). We also want to point out that it is impossible to enumerate all the possible attractors of this high‐dimensional non‐linear dynamic system. The attractors in this study were obtained by sampling. By sampling enough times, we can confirm that there are at least five attractors (see supplemental material). The dynamical system may include limit cycles and chaos; however, at the present stage we found neither.
The maximal production rate V PPARγ and the degradation rate τ PPARγ are normalised as 1. The values for n 1i and K 1i are selected within a reasonable range to grasp the key feature of activation or inhibition, for example, n 1i = 3 and K 1i = (1/8). The exact process of scanning for parameters is described in the supplemental materials. The quantitative assumptions provide a general framework to quantify the endogenous network. Other proteins, like from the working endogenous network of liver, are quantified in a similar way (see supplemental materials).
The working endogenous network is described by a non‐linear dynamical system which implies some attractors are underlying the endogenous network [7, 8, 10]. We show that attractors are robust against reasonable parameters by scanning n and K in the Hill function (supplementary tables 2, 3, 4). The results suggest that attractors are determined by emerging properties of network topology structure and dynamic logic relationship rather than by selective parameters. Each attractor is specified by relative content/activity of the molecular–cellular agents. In order to identify the biological function of attractors, we first summarise the relative change of each agent, obtained from computing in Table 1.
Table 2.
Predicted expression levels from the network analysis ranging from 0 to 1 for the two stable states calculated from the network
| Node ID | Healthy value | Disease value |
|---|---|---|
| glutamate | 0 | 0.8692 |
| NMDAR | 0 | 0.8678 |
| Ca2+ | 0 | 0.8673 |
| CaM | 0 | 0.8671 |
| RAS | 0 | 0.9286 |
| Shc1 | 0 | 0.8655 |
| RAF | 0 | 0.889 |
| MEK1/2 | 0 | 0.8754 |
| ERK1/2 | 0 | 0.8703 |
| p35 | 0 | 0.1155 |
| Calpain | 0 | 0.8671 |
| CDK5 | 0 | 0.002 |
| p25 | 0 | 0.867 |
| CDK5/p25 | 0 | 0.867 |
| tau | 1 | 0.133 |
| RSH | 0 | 0.8683 |
| CREB | 0 | 0.8675 |
| PPARγ | 0.9091 | 0.0032 |
| CEBPb | 1 | 0.1352 |
| NF‐κ ‐B | 0 | 0.8537 |
| CO | 0.9091 | 0.0031 |
| RAC1 | 0 | 0.8683 |
| AKT | 0 | 0.8615 |
| PI3 K | 0 | 0.889 |
| PIP3 | 0 | 0.8754 |
| GEF | 0 | 0.8703 |
| PDK1 | 0 | 0.8754 |
| AKT/PKB | 0 | 0.9291 |
| PRAS40 | 1 | 0.1109 |
| mTOR | 0.0909 | 0.9866 |
| HIF1α | 0.0075 | 0.9057 |
| BACE | 0 | 0.8814 |
| Aβ | 0 | 0.8726 |
| TGFβ | 0 | 0.8578 |
| MAPK10 | 0 | 0.8449 |
| TGF β R1 | 0 | 0.8632 |
| BACH1 | 0 | 0.8814 |
| NRF2 | 0 | 0.8814 |
| HO1 | 1 | 0.0681 |
Table 4.
Abbreviations
| Symbol | Name |
|---|---|
| Aβ | amyloid beta |
| AD | Alzheimer's disease |
| AKT | protein kinase B (PKB) |
| APP | amyloid‐beta precursor protein |
| BACE | beta‐secretase |
| BACH1 | BTB and CNC homology 1, Basic Leucine Zipper Transcription Factor 1 |
| Ca2+ | calcium ion |
| CaM | calcium‐modulated protein |
| CDK5 | cyclin‐dependent kinase 5 |
| CEBPβ | CCAAT/enhancer‐binding protein beta |
| CO | carbon monoxide |
| CREB | cAMP response element‐binding protein |
| ERK1 | mitogen‐activated protein kinase 3 |
| HIF1α | hypoxia‐induced factor 1 alpha |
| HO1 | heme oxygenase 1 |
| MAPK10 | myogen‐activated protein kinase 10 |
| mTOR | mechanistic target of rapamycin |
| NF‐κ ‐B | nuclear factor kappa B |
| NMDAR | N‐methyl‐D‐aspartate receptor |
| NRF2 | nuclear factor (erythroid‐derived 2)‐like 2 |
| p35 | cyclin‐dependent kinase 5, regulatory subunit 1 |
| PDK1 | pyruvate dehydrogenase lipoamide kinase isozyme |
| PI3 K | phosphoinositide 3‐kinase |
| PIP3 | phosphatidylinositol (3,4,5)‐trisphosphate |
| PPARγ | peroxisome proliferator‐activated receptor gamma |
| RAC1 | Ras‐related C3 Botulinum toxin substrate 1 |
| RAF | rat fibro sarcoma |
| RAS | rat sarcoma (protooncogene) |
| Shc1 | SHC‐transforming protein 1 |
| TGFβ | transforming growth factor beta |
Table 1.
Relating the gene symbol or molecule name with the index number used for the calculations
| Index number | Node ID |
|---|---|
| 1 | glutamate |
| 2 | NMDAR |
| 3 | Ca2+ |
| 4 | CaM |
| 5 | RAS |
| 6 | Shc1 |
| 7 | RAF |
| 8 | MEK1/2 |
| 9 | ERK1/2 |
| 10 | p35 |
| 11 | Calpain |
| 12 | CDK5 |
| 13 | p25 |
| 14 | CDK5/p25 |
| 15 | tau |
| 16 | RSH |
| 17 | CREB |
| 18 | PPARγ |
| 19 | CEBPβ |
| 20 | NF‐κ ‐B |
| 21 | CO |
| 22 | RAC1 |
| 23 | AKT |
| 24 | PI3 K |
| 25 | PIP3 |
| 26 | GEF |
| 27 | PDK1 |
| 28 | AKT/PKB |
| 29 | PRAS40 |
| 30 | mTOR |
| 31 | HIF1α |
| 32 | BACE |
| 33 | Aβ |
| 34 | TGFβ |
| 35 | MAPK10 |
| 36 | TGFβ R1 |
| 37 | BACH1 |
| 38 | NRF2 |
| 39 | HO1 |
After computing the states, we compared the relative change of each agent from a healthy to AD state, according to the experimental data in Table 2. It compares already published experimental results to the current network study.
2.3 Key network
The key network proposed in this paper is made of 39 nodes. The number of each node and its associated gene is displayed in Table 1. The network itself is displayed in Fig. 2.
2.4 Calculation results
The value assigned by calculation can be taken as an indicator of gene expression, reaching from 0 to 1.0. If ‘Node 1’ in ‘Stable State A’ has a value closer to 1 than in ‘Stable State B’, the expression of ‘Gene 1’ is predicted as higher, and vice versa. The relative value was assigned to each node by normalising them (see Sections 1–3.2). The results of the calculation are shown in Table 2, showing the relative value of each node.
The results show two stable states. To test the correctness of our prediction, we compared the calculated gene expression level to the literature. The first stable state relates to gene expression known from healthy individuals. We found the change of gene expression between first and second stable state (increased/decreased) documented in various publications, see Table 3. Some of the nodes have not yet been tested in lab experiments, so no biomedical data is available yet to confirm the rest of our predictions.
3 Discussion
The published data from many different research sources were not created with the sole intention of being used in a network, but rather aimed to show individual effects. This poses the challenge to evaluate the overall effect created by many such interconnecting individual effectors. Computer modelling is a convenient platform to combine separated knowledge into a large network to evaluate collective behaviour. The results obtained with our AD network affirms the single pieces of information were mapped and that it contains key nodes of importance to AD pathogenesis, so that global behaviour emerges. The calculations revealed two stable states, one relating to healthy gene expression levels, and one to AD pathogenesis. Further, this network shows the ‘calcium‐mediated’ step as an important way for feedback loops.
A sound network is the basis of a reasonable approach. This requires an extensive review of available data and literature. This enabled us to construct a novel network from scratch, incorporating data from several sources (reviews, primary research articles and pathway databases). A network needs to be big enough to consist of all necessary elements, making it a reasonable biomedical approach, yet small enough that problems from over‐inflated bits of information can be avoided. Using these ideas, it is possible to create a key network, consisting only of the most important nodes.
After designing the endogenous molecular network describing key nodes of AD, it is possible to compute all possible stable states of the network in this environment. The calculations showed two stable states, one that predicts a regulatory state similar to healthy individuals, as well as another one corresponding to expected AD expression levels. The actual and expected expression levels were displayed with upward pointing arrows (increased in regard to the respective control group/stable state) or downward pointing arrows (decreased in regard the respective control group/stable state) which show the value of this node, if biochemical data was available. The data is shown in Table 3.
The network forms a platform for further analysis of pathological regulation of the AD state. It can be easily expanded to include more genes and new interconnections. Such networks can be used for advanced analysis, like revealing treatment options or developing diagnostic tools. When investigating a medical compound and its way of action (e.g. activating a signal cascade feeding into the network) a change in the stable states caused by it can be investigated. The described method can be used to simulate changes in gene expression in silico without the need for elaborate laboratory techniques for early stages. Synergistic effects of drugs could be simulated by this method quite easily.
Several other frameworks have also been proposed from the point of view of systems biology, such as the ENCODE project [40]. Theoretically, the regulatory mechanism can be deduced from high throughput data, given enough quality data input. Nevertheless, in reality the present genome wide gene expression and protein interactions information are far from achieving this goal [65]. In the endogenous network construction, we solve this issue by making full use of the well‐documented gene regulatory network and signalling transduction pathway which reflect our accumulated knowledge.
In this paper, a hypothesis focusing on AD has been proposed, from the viewpoint of systems biology. The working network was quantified by a set of differential equations, giving us two robust attractors. By comparing the modelling results and experimental data, we conclude that these two attractors reproduce the molecular signature of normal brain tissue and AD. In the light of the hypothesis, the genesis and progression of AD can be regarded as switching from one attractor over to the other one, thus opening up possibilities for future development of strategies for prevention or therapy of AD.
4 Acknowledgments
This work has been supported by the DAAD, BMBF and in part by the National 973 Project (2010CB529200 (PA)) and by the Natural Science Foundation of China (NFSC91029738).
5 References
- 1. Perry R.J., and Hodges J.R.: ‘Attention and executive deficits in Alzheimer's disease: a critical review’, Brain, 1999, 122, (3), pp. 383–404 (doi: 10.1093/brain/122.3.383) [DOI] [PubMed] [Google Scholar]
- 2. Weiner M.W. Veitch D.P., and Aisen P.S. et al.: ‘The Alzheimer's disease neuroimaging initiative: a review of papers published since its inception’, Alzheimer's Dement., 2013, 9, (5), pp. e111–e194 (doi: 10.1016/j.jalz.2013.05.1769) [DOI] [PMC free article] [PubMed] [Google Scholar]
- 3. Association A.s.: ‘Alzheimer's disease facts and figures’, Alzheimer's Dement., J. Alzheimer's Association, 2012, 8, (2), p. 131 (doi: 10.1016/j.jalz.2012.02.001) [DOI] [PubMed] [Google Scholar]
- 4. Bateman R.J. Xiong C., and Benzinger T.L.S. et al.: ‘Clinical and biomarker changes in dominantly inherited Alzheimer's disease’, N. Engl. J. Med., 2012, 367, (9), pp. 795–804 (doi: 10.1056/NEJMoa1202753) [DOI] [PMC free article] [PubMed] [Google Scholar]
- 5. Loring J. Wen X. Lee J.M. Seilhamer J., and Somogyi R.: ‘A gene expression profile of Alzheimer's disease’, DNA Cell Biol., 2001, 20, (11), pp. 683–695 (doi: 10.1089/10445490152717541) [DOI] [PubMed] [Google Scholar]
- 6. Selkoe D.J.: ‘Alzheimer's disease: genes, proteins, and therapy’, Physiol. Rev., 2001, 81, (2), pp. 741–766 [DOI] [PubMed] [Google Scholar]
- 7. Ao P. Galas D. Hood L., and Zhu X.: ‘Cancer as robust intrinsic state of endogenous molecular‐cellular network shaped by evolution’, Med. Hypotheses, 2008, 70, (3), pp. 678–684 (doi: 10.1016/j.mehy.2007.03.043) [DOI] [PMC free article] [PubMed] [Google Scholar]
- 8. Wang G. et al.: ‘From Phage lambda to human cancer: endogenous molecular‐cellular network hypothesis’, Quant. Biol., 2013, 1, (1), pp. 32–49 (doi: 10.1007/s40484-013-0007-1) [DOI] [Google Scholar]
- 9. Zhu X. et al.: ‘Efficiency, robustness, and stochasticity of gene regulatory networks in systems biology: λ switch as a working example’, in Choi S. (Ed.): ‘Introduction to systems biology’ (Humana Press, 2007), pp. 336–371 [Google Scholar]
- 10. Ao P. Galas D., and Hood L. et al.: ‘Towards predictive stochastic dynamical modeling of cancer genesis and progression’, Interdiscip. Sci., Comput. Life Sci., 2010, 2, (2), pp. 140–144 (doi: 10.1007/s12539-010-0072-3) [DOI] [PMC free article] [PubMed] [Google Scholar]
- 11. Tiraboschi P. Hansen L.A. Thal L.J., and Corey‐Bloom J.: ‘The importance of neuritic plaques and tangles to the development and evolution of AD’, Neurology, 2004, 62, (11), pp. 1984–1989 (doi: 10.1212/01.WNL.0000129697.01779.0A) [DOI] [PubMed] [Google Scholar]
- 12. Heuer E. Rosen R.F. Cintron A., and Walker L.C.: ‘Nonhuman primate models of Alzheimer‐like cerebral proteopathy’, Curr. Pharm. Des., 2012, 18, (8), pp. 1159–1169 (doi: 10.2174/138161212799315885) [DOI] [PMC free article] [PubMed] [Google Scholar]
- 13. Balducci C., and Forloni G.: ‘APP transgenic mice: their use and limitations’, Neuromolecular Med., 2011, 13, (2), pp. 117–137 (doi: 10.1007/s12017-010-8141-7) [DOI] [PubMed] [Google Scholar]
- 14. Brito‐Moreira J. Paula‐Lima A.C., and Bomfim T.R. et al.: ‘Abeta oligomers induce glutamate release from hippocampal neurons’, Curr. Alzheimer Res., 2011, 8, (5), pp. 552–562 (doi: 10.2174/156720511796391917) [DOI] [PubMed] [Google Scholar]
- 15. Masliah E. Alford M. DeTeresa R. Mallory M., and Hansen L.: ‘Deficient glutamate transport is associated with neurodegeneration in Alzheimer's disease’, Ann. Neurol., 1996, 40, (5), pp. 759–766 (doi: 10.1002/ana.410400512) [DOI] [PubMed] [Google Scholar]
- 16. Agell N. Bachs O. Rocamora N., and Villalonga P.: ‘Modulation of the Ras/Raf/MEK/ERK pathway by Ca 2+, and calmodulin’, Cellular Signal., 2002, 14, (8), pp. 649–654 (doi: 10.1016/S0898-6568(02)00007-4) [DOI] [PubMed] [Google Scholar]
- 17. Tsai L.‐H. Patrick G.N. Zukerberg L. Nikolic M. de la Monte S., and Dikkes P.: ‘Conversion of p35 to p25 deregulates Cdk5 activity and promotes neurodegeneration’, Nature, 1999, 402, (6762), pp. 615–622 (doi: 10.1038/45159) [DOI] [PubMed] [Google Scholar]
- 18. Lau L.‐F., and Ahlijanian M.K.: ‘Role of cdk5 in the pathogenesis of Alzheimer's disease’, Neurosignals, 2003, 12, (4), pp. 209–214 (doi: 10.1159/000074622) [DOI] [PubMed] [Google Scholar]
- 19. Miller J.A. Oldham M.C., and Geschwind D.H.: ‘A systems level analysis of transcriptional changes in Alzheimer's disease and normal aging’, J. Neurosci., 2008, 28, (6), pp. 1410–1420 (doi: 10.1523/JNEUROSCI.4098-07.2008) [DOI] [PMC free article] [PubMed] [Google Scholar]
- 20. Jessberger S. Aigner S., and Clemenson G.D. Jr. et al.: ‘Cdk5 regulates accurate maturation of newborn granule cells in the adult hippocampus’, PLoS Biol., 2008, 6, (11), p. e272 (doi: 10.1371/journal.pbio.0060272) [DOI] [PMC free article] [PubMed] [Google Scholar]
- 21. Barger S.W. Hörster D. Furukawa K. Goodman Y. Krieglstein J., and Mattson M.P.: ‘Tumor necrosis factors alpha and beta protect neurons against amyloid beta‐peptide toxicity: evidence for involvement of a kappa B‐binding factor and attenuation of peroxide and Ca2+ accumulation’, Proc. Natl. Acad. Sci. USA, 1995, 92, (20), pp. 9328–9332 (doi: 10.1073/pnas.92.20.9328) [DOI] [PMC free article] [PubMed] [Google Scholar]
- 22. Cuni S. Perez‐Aciego P., and Perez‐Chacon G. et al.: ‘A sustained activation of PI3 K/NF‐κ‐B pathway is critical for the survival of chronic lymphocytic leukemia B cells’, Leukemia, 2004, 18, (8), pp. 1391–1400 (doi: 10.1038/sj.leu.2403398) [DOI] [PubMed] [Google Scholar]
- 23. Osaki M. Oshimura M., and Ito H.: ‘PI3 K‐Akt pathway: its functions and alterations in human cancer’, Apoptosis, 2004, 9, (6), pp. 667–676 (doi: 10.1023/B:APPT.0000045801.15585.dd) [DOI] [PubMed] [Google Scholar]
- 24. Jimenez S. Torres M., and Vizuete M. et al.: ‘Age‐dependent accumulation of soluble amyloid β (Aβ) oligomers reverses the neuroprotective effect of soluble amyloid precursor protein‐β (sAPPβ) by modulating phosphatidylinositol 3‐kinase (PI3 K)/Akt‐GSK‐3β pathway in Alzheimer mouse model’, J. Biol. Chem., 2011, 286, (21), pp. 18414–18425 (doi: 10.1074/jbc.M110.209718) [DOI] [PMC free article] [PubMed] [Google Scholar]
- 25. Bhaskar K. Miller M. Chludzinski A. Herrup K. Zagorski M., and Lamb B.T.: ‘The PI3 K‐Akt‐mTOR pathway regulates Abeta oligomer induced neuronal cell cycle events’, Mol. Neurodegeneration, 2009, 4, p. 14 (doi: 10.1186/1750-1326-4-14) [DOI] [PMC free article] [PubMed] [Google Scholar]
- 26. Ogunshola O.O., and Antoniou X.: ‘Contribution of hypoxia to Alzheimer's disease: Is HIF‐1α a mediator of neurodegeneration?’, Cell. Mol. Life Sci., 2009, 66, (22), pp. 3555–3563 (doi: 10.1007/s00018-009-0141-0) [DOI] [PMC free article] [PubMed] [Google Scholar]
- 27. Li B.‐S. Zhang L., and Takahashi S. et al.: ‘Cyclin‐dependent kinase 5 prevents neuronal apoptosis by negative regulation of c‐Jun N‐terminal kinase 3’, EMBO J., 2002, 21, (3), pp. 324–333 (doi: 10.1093/emboj/21.3.324) [DOI] [PMC free article] [PubMed] [Google Scholar]
- 28. Ma Q.‐L. Yang F., and Rosario E.R. et al.: ‘Beta‐amyloid oligomers induce phosphorylation of tau and inactivation of insulin receptor substrate via c‐Jun N‐terminal kinase signaling: suppression by omega‐3 fatty acids and curcumin’, J. Neurosci., 2009, 29, (28), pp. 9078–9089 (doi: 10.1523/JNEUROSCI.1071-09.2009) [DOI] [PMC free article] [PubMed] [Google Scholar]
- 29. Ittner L.M. Ke Y.D., and Götz J.: ‘Phosphorylated Tau interacts with c‐Jun N‐terminal kinase‐interacting protein 1 (JIP1) in Alzheimer disease’, J. Biol. Chem., 2009, 284, (31), pp. 20909–20916 (doi: 10.1074/jbc.M109.014472) [DOI] [PMC free article] [PubMed] [Google Scholar]
- 30. Derynck R. Zhang Y., and Feng X.‐H.: ‘Smad3 and Smad4 cooperate with c‐Jun/c‐Fos to mediate TGF‐[beta]‐induced transcription’, Nature, 1998, 394, (6696), pp. 909–913 (doi: 10.1038/29814) [DOI] [PubMed] [Google Scholar]
- 31. Wolter S. Doerrie A., and Weber A. et al.: ‘c‐Jun controls histone modifications, NF‐κ‐B recruitment, and RNA polymerase II function to activate the ccl2 gene’, Mol. Cell. Biol., 2008, 28, (13), pp. 4407–4423 (doi: 10.1128/MCB.00535-07) [DOI] [PMC free article] [PubMed] [Google Scholar]
- 32. Remels A.H.V. Langen R.C.J., and Gosker H.R. et al.: ‘PPARgamma inhibits NF‐kappaB‐dependent transcriptional activation in skeletal muscle’, Am. J. Physiol. Endocrinol. Metab., 2009, 297, (1), pp. E174–E183 (doi: 10.1152/ajpendo.90632.2008) [DOI] [PubMed] [Google Scholar]
- 33. Kim H.S. Loughran P.A. Rao J. Billiar T.R., and Zuckerbraun B.S.: ‘Carbon monoxide activates NF‐kappaB via ROS generation and Akt pathways to protect against cell death of hepatocytes’, Am. J. Physiol. Gastrointest. Liver Physiol., 2008, 295, (1), pp. G146–G152 (doi: 10.1152/ajpgi.00105.2007) [DOI] [PubMed] [Google Scholar]
- 34. Boyer L. Travaglione S., and Falzano L. et al.: ‘Rac GTPase instructs nuclear factor‐kappaB activation by conveying the SCF complex and IkBalpha to the ruffling membranes’, Mol. Biol. Cell, 2004, 15, (3), pp. 1124–1133. (doi: 10.1091/mbc.E03-05-0301) [DOI] [PMC free article] [PubMed] [Google Scholar]
- 35. Meng F.: ‘Akt is a downstream target of NF‐kappa B’, J. Biol. Chem., 2002, 277, (33), pp. 29674–29680 (doi: 10.1074/jbc.M112464200) [DOI] [PubMed] [Google Scholar]
- 36. Loboda A. Stachurska A., and Florczyk U. et al.: ‘HIF‐1 induction attenuates Nrf2‐dependent IL‐8 expression in human endothelial cells’, Antioxid. Redox Signal., 2009, 11, (7), pp. 1501–1517 (doi: 10.1089/ars.2008.2211) [DOI] [PubMed] [Google Scholar]
- 37. Mandelkow E.‐M., and Mandelkow E.: ‘Tau in Alzheimer's disease’, Trends Cell Biol., 1998, 8, (11), pp. 425–427 (doi: 10.1016/S0962-8924(98)01368-3) [DOI] [PubMed] [Google Scholar]
- 38. Paula Grammas D.T.A.S.X.Y.J.L.: ‘Brain microvasculature and hypoxia‐related proteins in Alzheimer's disease’, Int. J. Clin. Exp. Pathol., 2011, 4, (6), pp. 616 [PMC free article] [PubMed] [Google Scholar]
- 39. Grammas P. Samany P.G., and Thirumamgalakudi L.: ‘Thrombin and inflammatory proteins are elevated in Alzheimer's disease microvessels: implications for disease pathogenesis’, J. Alzheimers Dis., 2006, 9, (1), pp. 51–58 [DOI] [PubMed] [Google Scholar]
- 40. Ao P. Galas D. Hood L. Yin L., and Zhu X.M.: ‘Towards predictive stochastic dynamical modeling of cancer genesis and progression’, Interdiscip. Sci., 2010, 2, (2), pp. 140–144 (doi: 10.1007/s12539-010-0072-3) [DOI] [PMC free article] [PubMed] [Google Scholar]
- 41. Tyson J.J. Chen K.C., and Novak B.: ‘Sniffers, buzzers, toggles and blinkers: dynamics of regulatory and signaling pathways in the cell’, Curr. Opin. Cell Biol., 2003, 15, (2), pp. 221–231 (doi: 10.1016/S0955-0674(03)00017-6) [DOI] [PubMed] [Google Scholar]
- 42. Glass L., and Kauffman S.A.: ‘The logical analysis of continuous, non‐linear biochemical control networks’, J. Theor. Biol., 1973, 39, (1), pp. 103–129 (doi: 10.1016/0022-5193(73)90208-7) [DOI] [PubMed] [Google Scholar]
- 43. Butterfield D.A., and Pocernich C.B.: ‘The glutamatergic system and Alzheimer's disease’, CNS Drugs, 2003, 17, (9), pp. 641–652 (doi: 10.2165/00023210-200317090-00004) [DOI] [PubMed] [Google Scholar]
- 44. Hertz L. Drejer J.R., and Schousboe A.: ‘Energy metabolism in glutamatergic neurons, GABAergic neurons and astrocytes in primary cultures’, Neurochem. Res., 1988, 13, (7), pp. 605–610 (doi: 10.1007/BF00973275) [DOI] [PubMed] [Google Scholar]
- 45. Ulas J. Weihmuller F.B. Brunner L.C. Joyce J.N. Marshall J.F., and Cotman C.W.: ‘Selective increase of NMDA‐sensitive glutamate binding in the striatum of Parkinson's disease, Alzheimer's disease, and mixed Parkinson's disease/Alzheimer's disease patients: an autoradiographic study’, J. Neurosci., 1994, 14, (11), pp. 6317–6324 [DOI] [PMC free article] [PubMed] [Google Scholar]
- 46. Gärtner U. Holzer M., and Arendt T.: ‘Elevated expression of p21ras is an early event in Alzheimer's disease and precedes neurofibrillary degeneration’, Neuroscience, 1999, 91, (1), pp. 1–5 (doi: 10.1016/S0306-4522(99)00059-7) [DOI] [PubMed] [Google Scholar]
- 47. Mei M. Su B., and Harrison K. et al.: ‘Distribution, levels and phosphorylation of Raf‐1 in Alzheimer's disease’, J. Neurochem., 2006, 99, (5), pp. 1377–1388 (doi: 10.1111/j.1471-4159.2006.04174.x) [DOI] [PubMed] [Google Scholar]
- 48. Pei J.‐J. Braak H., and An W.‐L. et al.: ‘Up‐regulation of mitogen‐activated protein kinases ERK1/2 and MEK1/2 is associated with the progression of neurofibrillary degeneration in Alzheimer's disease’, Mol. Brain Res., 2002, 109, (1), pp. 45–55 (doi: 10.1016/S0169-328X(02)00488-6) [DOI] [PubMed] [Google Scholar]
- 49. Saito K. Elce J.S. Hamos J.E., and Nixon R.A.: ‘Widespread activation of calcium activated neutral proteinase (calpain) in the brain in Alzheimer disease: a potential molecular basis for neuronal degeneration’, Proc. Natl. Acad. Sci. USA, 1993, 90, (7), pp. 2628–2632 (doi: 10.1073/pnas.90.7.2628) [DOI] [PMC free article] [PubMed] [Google Scholar]
- 50. Cruz J.C., and Tsai L.‐H.: ‘Cdk5 deregulation in the pathogenesis of Alzheimer's disease’, Trends Mol. Med., 2004, 10, (9), pp. 452–458 (doi: 10.1016/j.molmed.2004.07.001) [DOI] [PubMed] [Google Scholar]
- 51. Lonze B.E., and Ginty D.D.: ‘Function and regulation of CREB family transcription factors in the nervous system’, Neuron, 2002, 35, (4), pp. 605–623 (doi: 10.1016/S0896-6273(02)00828-0) [DOI] [PubMed] [Google Scholar]
- 52. Sodhi R.K. Singh N., and Jaggi A.S.: ‘Neuroprotective mechanisms of peroxisome proliferator‐activated receptor agonists in Alzheimer's disease’, Naunyn Schmiedebergs Arch. Pharmacol., 2011, 384, (2), pp. 115–124 (doi: 10.1007/s00210-011-0654-6) [DOI] [PubMed] [Google Scholar]
- 53. Mattson M.P., and Camandola S.: ‘NF‐κ‐B in neuronal plasticity and neurodegenerative disorders’, J. Clin. Invest., 2001, 107, (3), pp. 247–254 (doi: 10.1172/JCI11916) [DOI] [PMC free article] [PubMed] [Google Scholar]
- 54. Gozzelino R. Jeney V., and Soares M.P.: ‘Mechanisms of cell protection by heme oxygenase‐1’, Annu. Rev. Pharmacol. Toxicol., 2010, 50, (1), pp. 323–354 (doi: 10.1146/annurev.pharmtox.010909.105600) [DOI] [PubMed] [Google Scholar]
- 55. Wang P.‐L. Niidome T. Akaike A. Kihara T., and Sugimoto H.: ‘Rac1 inhibition negatively regulates transcriptional activity of the amyloid precursor protein gene’, J. Neurosci. Res., 2009, 87, (9), pp. 2105–2114 (doi: 10.1002/jnr.22039) [DOI] [PubMed] [Google Scholar]
- 56. Martin D. Salinas M. Lopez‐Valdaliso R. Serrano E. Recuero M., and Cuadrado A.: ‘Effect of the Alzheimer amyloid fragment Aβ (25–35) on Akt/PKB kinase and survival of PC12 cells’, J. Neurochem., 2001, 78, (5), pp. 1000–1008 (doi: 10.1046/j.1471-4159.2001.00472.x) [DOI] [PubMed] [Google Scholar]
- 57. Puglielli L.: ‘Aging of the brain, neurotrophin signaling, and Alzheimer's disease: is IGF1‐R the common culprit?’, Neurobiol. Aging, 2008, 29, (6), pp. 795–811 (doi: 10.1016/j.neurobiolaging.2007.01.010) [DOI] [PMC free article] [PubMed] [Google Scholar]
- 58. Shang Y.C. Chong Z.Z. Wang S., and Maiese K.: ‘Wnt1 inducible signaling pathway protein 1 (WISP1) targets PRAS40 to govern β ‐amyloid apoptotic injury of microglia’, Curr. Neurovasc. Res., 2012, 9, (4), p. 239 (doi: 10.2174/156720212803530618) [DOI] [PMC free article] [PubMed] [Google Scholar]
- 59. Spilman P. Podlutskaya N., and Hart M.J. et al.: ‘Inhibition of mTOR by Rapamycin abolishes cognitive deficits and reduces amyloid‐β levels in a mouse model of Alzheimer's disease’, PLoS ONE, 2010, 5, (4), p. e9979 (doi: 10.1371/journal.pone.0009979) [DOI] [PMC free article] [PubMed] [Google Scholar]
- 60. Vassar R.: ‘Beta‐secretase cleavage of Alzheimer's amyloid precursor protein by the transmembrane aspartic protease BACE’, Science, 1999, 286, (5440), pp. 735–741 (doi: 10.1126/science.286.5440.735) [DOI] [PubMed] [Google Scholar]
- 61. Tickler A. Wade J., and Separovic F.: ‘The role of abeta peptides in Alzheimers disease’, PPL, 2005, 12, (6), pp. 513–519 (doi: 10.2174/0929866054395905) [DOI] [PubMed] [Google Scholar]
- 62. Zhu X. Raina A.K., and Rottkamp C.A. et al.: ‘Activation and redistribution of c‐Jun N‐terminal kinase/stress activated protein kinase in degenerating neurons in Alzheimer's disease’, J. Neurochem., 2001, 76, (2), pp. 435–441 (doi: 10.1046/j.1471-4159.2001.00046.x) [DOI] [PubMed] [Google Scholar]
- 63. Shim K.S. Ferrando‐Miguel R., and Lubec P.D.G.: ‘Aberrant protein expression of transcription factors BACH1 and ERG, both encoded on chromosome 21, in brains of patients with Down syndrome and Alzheimer's disease’ (Springer Vienna, 2003) pp. 39–49 [DOI] [PubMed] [Google Scholar]
- 64. Ramsey C.P. Glass C.A., and Montgomery M.B. et al.: ‘Expression of Nrf2 in neurodegenerative diseases’, J. Neuropathol. Exp. Neurol., 2007, 66, (1), pp. 75–85 (doi: 10.1097/nen.0b013e31802d6da9) [DOI] [PMC free article] [PubMed] [Google Scholar]
- 65. Hartwell L.H. et al.: ‘From molecular to modular cell biology’, Nature, 1999, 402, (6761 Suppl), pp. C47–C52 (doi: 10.1038/35011540) [DOI] [PubMed] [Google Scholar]