

Abstract
ANGPTL8 is a recently identified novel hormone which regulates both glucose and lipid metabolism. The increase in ANGPTL8 during compensatory insulin resistance has been recently reported to improve glucose tolerance and a part of cytoprotective metabolic circuit. However, the exact signalling entities and dynamics involved in this process have remained elusive. Therefore, the current study was conducted with a specific aim to model the regulation of ANGPTL8 with emphasis on its role in improving glucose tolerance during insulin resistance. The main contribution of this study is the construction of a discrete model (based on kinetic logic of René Thomas) and its equivalent Stochastic Petri Net model of ANGPTL8 associated Biological Regulatory Network (BRN) which can predict its dynamic behaviours. The predicted results of these models are in‐line with the previous experimental observations and provide comprehensive insights into the signalling dynamics of ANGPTL8 associated BRN. The authors’ results support the hypothesis that ANGPTL8 plays an important role in supplementing the insulin signalling pathway during insulin resistance and its loss can aggravate the pathogenic process by quickly leading towards Diabetes Mellitus. The results of this study have potential therapeutic implications for treatment of Diabetes Mellitus and are suggestive of its potential as a glucose‐lowering agent.
Inspec keywords: molecular biophysics, biomembranes, diseases, stochastic processes, biochemistry, patient treatment, Petri nets, genetics, sugar, cellular biophysics, biology computing
Other keywords: ANGPTL8 associated regulatory network, formal modelling approaches, lipid metabolism, compensatory insulin resistance, glucose tolerance, equivalent Stochastic Petri Net model, ANGPTL8 associated BRN
1 Introduction
ANGPTL8 is a recently identified novel hormone and an atypical member of Angiopoietin‐Like Protein (ANGPTL) family [1]. Initial studies regarding the functional characterisation of ANGPTL8 demonstrated its role as insulin and glucose stimulated hormone with a physiological role in fasting to re‐feeding metabolic transition [1, 2, 3]. Its expression levels are reduced upon fasting whereas nutritional stimulus elevates it through insulin signalling (IS) pathway. Several independent efforts led to identifying its unique functional roles including the regulation of both lipid and glucose metabolic pathways which are comprehensively reviewed in our previous work [4].
Its elevated expression levels have also been observed during the compensatory (initial) insulin resistance phase [5]. Insulin resistance is a pathological condition which is characterised by impaired IS pathway and altered insulin sensitivity of the cells [6]. This could lead to elevated levels of blood glucose often coupled with elevated lipids and insulin levels as well. Since IS pathway regulates the systemic levels of different energy substrates including glucose and lipids therefore upon perturbations it leads to the gradual induction of their pathological levels. This information has been used to characterise the stages of pathogenesis caused by insulin resistance which is graphically illustrated in Fig. 1 [7, 8, 9, 10, 11]. Each stage is characterised with characteristic phenotypic traits based upon the plasma levels of energy substrates and their regulators (hormones/genes).
Fig. 1.
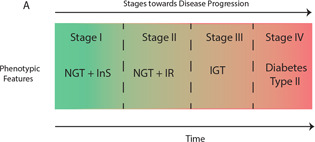
Stages of progression of Diabetes Mellitus from homeostasis: Different pathogenic stages are characterised based on different phenotypic features. These stages were hard bounded by [7]
(Abbreviations: NGT: Normal Glucose Tolerance; InS; Insulin Sensitivity; IR: Insulin Resistance; IGT; Impaired Glucose Tolerance)
The initial phase of insulin resistance, in which there is a compensatory increase of insulin (hyperinsulenemia) maintains the homeostatic levels of glucose and is termed as stage II according to [7]. This compensatory response has been observed and studied in many physiological (gestation, obesity) and pathological (diabetes, drugs induced) models of insulin resistance to increase our knowledge regarding the adapted molecular circuits [5, 12, 13, 14]. Understanding the underlying mechanism regulating this compensatory response (in maintaining normoglycemia) is essentially a prerequisite for identification of the precise metabolic circuits which have potential implications for the treatment of Diabetes Mellitus and range of associated metabolic disorders.
Recently, ANGPTL8 has been demonstrated to play a role in the compensatory phase of insulin resistance and associated improved glucose tolerance in [5]. In this study, increased expression of ANGPTL8 was observed in different mice models of insulin resistance (such as obese, gestational, diabetic and S961 (insulin receptor inhibitor) treated) exhibiting the compensatory response. They conducted a series of in‐vivo and in‐vitro experiments which provided clues regarding the function of ANGPTL8 during insulin resistance. In their study, over‐expression of ANGPTL8 in mice liver (its normal site of expression) exhibited two responses, i.e. increased pancreatic beta cell proliferation and improved glucose tolerance. The association of ANGPTL8 with pancreatic beta cell proliferation was negated in the upcoming several studies [15, 16]. However, the investigations related to improvement of glucose tolerance by ANGPTL8 during compensatory phase of insulin resistance were further pursued in [12]. Their data demonstrated that ANGPTL8 is an important player of glucose metabolism and plays crucial role in the gene circuit which is involved in maintaining glucose levels under IS pathway. They demonstrated through their experiments that ANGPTL8 phosphorylates AKT at serine 473 which subsequently inhibits FOXO and GSK3‐ (Fig. 2A ). FOXO is a transcription factor which activates the gluconeogeneic (glucose formation) program of the metabolism whereas GSK3‐ inhibits the process of glycogenesis (glycogen formation). Thus, their data support a model of ANGPTL8 regulation in which the elevated expression levels of ANGPTL8 during insulin resistance is a part of cytoprotective adapted metabolic circuit which improves glucose tolerance through AKT to FOXO and AKT to GSK3 signalling. Moreover, they demonstrated through the experiments using ANGPTL8 knock‐out HepG2 cell lines that inhibition of ANGPTL8 could accelerate the process of pathogenesis. These observations opened up the new avenues for further investigations regarding the therapeutic potential of ANGPTL8 in Diabetes Mellitus and associated disorders. However, the exact signalling entities and dynamics involved in this process have remained elusive. Therefore as a first step, the molecular signalling pathway of ANGPTL8 was designed in our previous work [4]. Moreover, this study is a follow‐up work conducted with a specific aim to model the regulation of ANGPTL8 with emphasis on its role in improving glucose tolerance during insulin resistance.
Fig. 2.
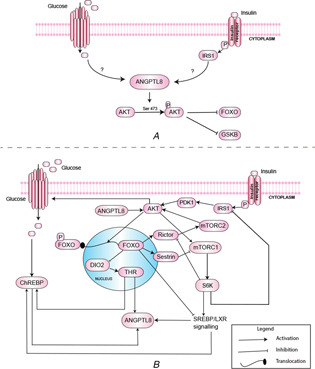
Models of ANGPTL8 Regulation
(A) Model of ANGPTL8 regulation described by [12], (B) Regulation of ANGPTL8 in IS pathway adopted from [4]
1.1 ANGPTL8 signalling pathway
The complete ANGPTL8 pathway which was constructed using systematic literature and pathways database searches in our previous work [4] is available at WikiPathways (ID = WP3915). We extracted the feedback circuits involved in the transcriptional regulation of ANGPTL8 from this pathway which are graphically illustrated in Fig. 2 as discussed below. Feeding stimulates the secretion of insulin from pancreatic beta cells which then initiates the IS pathway in peripheral organs in an endocrine manner. The IS pathway is initiated on binding of insulin with its receptor [17]. The phosphorylated receptor subsequently phosphorylates other effector proteins including IRS1 (Insulin Receptor Substrate 1) through its tyrosine kinase domain. The IRS then activates phosphoinositide‐dependent kinase‐1 (PDK1) which phosphorylates AKT at threonine 308 (T308) within the T loop of its catalytic domain [18, 19]. The second phosphorylation of AKT is performed by mTORC2 at serine 473 (S473) within the hydrophobic motif located in a C‐terminal [20, 21]. The full activation of AKT requires both of these phosphorylatory events and their complete mechanism is reviewed in another study [22]. Each phosphorylation confers AKT the ability to regulate different set of effectors without requiring the other one [23, 24]. The effector proteins of AKT include mTORC1 and FOXO transcription factors. mTORC1 is involved in protein synthesis and regulation of autophagy. It also activates S6K which regulates IS through inhibition of IRS. S6K also activates the liver X receptors (LXR)/SREBP‐1 signalling (which is described in detail in [25, 26, 27, 28]). Additionally, mTORC1 reduces the activity of mTORC2 through inhibition of rictor [29]. SREBP has been demonstrated to elevate the expression levels of ANGPTL8 through LXR dependent mechanism [30]. Their data demonstrated the elevated expression of ANGPTL8 in the presence of LXR agonists whereas SREBP inhibition reduced its LXR dependent gene expression. The LXR is a transcription factor which belongs to the nuclear hormone receptor super family. It regulates cholesterol homeostasis and bile acid metabolism [31].
FOXO transcription factors are important regulators of adaptation to fasting and metabolic homeostasis [32]. It inhibits the mTORC1 through transcription of sestrin3 and elevates the activity of mTORC2 by transcription of rictor [33]. AKT expression is stabilised through a feedback control between mTORC1 and FOXO [24].
AKT activation regulates the glucose uptake and its metabolism through a signalling cascade involving CBL signalling arm of the pathway [34]. The X‐5‐p (xylulose 5‐phosphate) and G‐6‐p (glucose‐6‐phosphate) are phosphometabolites of the glycolysis pathway which increases the translocation of the ChREBP in nucleus by post translational modifications. However, the transcription of ChREBP is regulated by LXR and THR transcription factors [35]. ChREBP is a glucose responsive transcription factor and is an important regulator of hepatic lipogenesis. It has been demonstrated to increase the gene expression of ANGPTL8 [36, 37]. The data of Fu et al. (2014) reported the presence of a ChREBP binding site (−398 to −382) in the promoter region of ANGPTL8 gene [36]. ANGPTL8 has been demonstrated to be transactivated by thyroid hormone receptor alpha and beta through T3 stimulation in human liver cell lines (HepG2 and Huh7) [38]. Thyroid hormone receptors alpha and beta belong to a class of steroid/nuclear hormone receptors super family of ligand‐dependent transcription factors. Tseng et al. [38] demonstrated the THR and regulated transcription of ANGPTL8 through the extensive in vivo and in vitro experiments. T3 is an important regulator of energy expenditure and affects several genes involved in cholesterol and carbohydrate metabolism [39]. The expression of serum and intracellular T3 is itself under nutritional regulation through IS pathway which allows induction of DIO2 enzyme [40]. The study by Lartey et al. [40] revealed insulin mediated activation of thyroid hormone activation by relieving the FOXO mediated repression of DIO2 in MSTO‐211H cells and in the livers of LIRKO (Liver specific Insulin Receptor Knockout) and LIRFKO (Liver specific Insulin Receptor and FOXO1 Knockout) mice. DIO2‐mediated T3 conversion is a major pathway in the regulation of TH metabolism [39, 40].
1.2 Contribution
The study was conducted to provide a clear understanding of the role of ANGPTL8 in glucose metabolism especially during insulin resistance as observed in the experiments of [5, 12]. The main contribution of this study is the construction of a discrete model (based on kinetic logic of René Thomas) and its equivalent Stochastic Petri Net model of ANGPTL8 associated Biological regulatory Network (BRN) which can predict its dynamic behaviours. The predicted results of these models are in‐line with the previous experimental observations [12, 41]. Moreover, additional novel signalling events are predicted with regards to the role of ANGPTL8 in glucose metabolism. These results are in line with previously reported role of ANGPTL8 as a glucose‐lowering agent for treatment of Diabetes Mellitus Type 2 and may additionally provide comprehensive insights into the possible signalling dynamics of ANGPTL8 associated BRN [12]. The significance of this work lies in the fact that the regulatory interactions of ANGPTL8 have been recently identified. Thus, to the best of our knowledge this study would be the first step towards providing any clue of the dynamics of the associated regulatory machinery.
2 Materials and methods
The discrete (qualitative) modelling formalism based on the well‐known kinetic logic of René Thomas was used for analysing the dynamics of ANGPTL8 associated BRN. For this purpose, the parameterisation of the BRN was performed using SMBioNet [42]. Given the biological observations and interaction graph, SMBioNet provides with the possible set of parameters which satisfy the desired biological properties. The discrete modelling framework illustrates the discrete dynamics of the system under study. To gain mechanistic insights into its time‐dependent dynamics, the discrete model was converted into an equivalent Stochastic Petri Net using the re‐writing rules described in [43] and implemented in GinSim tool [http://ginsim.org/.]. The formal definitions and application of respective formalisms in sequence are discussed below. The complete workflow of the study is provided in Fig. 3.
Fig. 3.
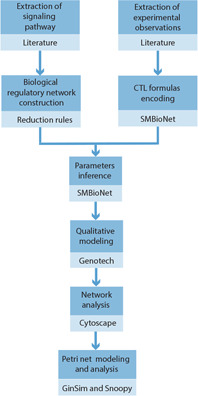
Steps and software tools used for the modelling and analysis of ANGPTL8 associated BRN
2.1 Semantics of kinetic logic
Kinetic logic is a qualitative modelling approach based on logical formalism which was introduced by René Thomas for the analysis of BRNs [44]. It approximates the behaviour of linear differential equations using asynchronous discrete dynamics based on threshold levels. The BRN consists of known interactions among the entities. Their regulations depend on the multi‐valued discrete threshold levels which are associated with each interaction. In terms of biological entities like genes, proteins, and mRNA, the activation and inhibition refer to the rate of increase or decrease in their expression levels, respectively. The semantics of the kinetic logic formalism adapted from [45, 46, 47, 48] are provided in Supplementary File 1.
2.2 Construction of BRN
Kinetic logic is a modelling approach suitable for the analysis of relatively small BRNs [44]. It is because the increase in number of the entities and interactions in the BRN exponentially increases state space of the resultant discrete model which becomes difficult to analyse. Therefore, the reduction of the large signalling pathways is a prerequisite to make the analysis of discrete model convenient. For example the ANGPTL8 signalling pathway is composed of 17 entities (Fig. 2) which will result in the state graph of 131,072 states upon simulation by considering the Boolean expression levels for each entity. On the other hand, the reduced BRN of ANGPTL8 ((See Section 3.1 below) is composed of 8 entities and would result in the state graph of 256 states .
To cater this limitation of the kinetic logic, established approaches of BRN reduction (as described by [49, 50]) have been employed in the current work flow. These approaches, utilise rules for iterative reduction of a BRN which implicitly preserves its dynamical properties. Fig. 4 provides graphical illustration of two examples for pathway reduction adapted from [50]. In Fig. 4A , an entity a activates another entity b, which in turn activates the entity c. The entity c forms a negative feedback loop by inhibiting the entity a, in this example. This feedback loop can be reduced by removing the entity b in the feedback loop which results in a simpler relation between entities a and c as represented in Fig. 4B . In the process of reduction, the behaviour of the removed entity b was preserved implicitly through the activation of entity c by entity a. Another example is illustrated through Fig. 4C in which an entity x is inhibiting another entity y, where y is in turn inhibiting the entity z. The net effect of activation of entity x on entity z is its activation. The reduced relation between entity x and entity z is provided in Fig. 4D by removing the entity y which is implicitly taken into account through positive interaction between them.
Fig. 4.
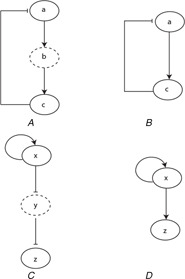
Examples of reduction of BRNs adapted from [50]
(A) , (B) Show the negative feedback loop between the entities a, b, and c and its reduced version, respectively. Entity a activates entity b, entity b activates entity c, and entity c inhibits entity a forming a negative feedback. Entity b is shown with the dashed oval in order to represent its removal in the reduced pathway. Similarly, (C), (D) show the relationship between the entities x, y and z and their reduced relation, respectively. The net effect of entity x on entity y is preserved implicitly in its reduced BRN as shown in (D)
These approaches have also been previously used in the logical modelling and analysis of mTOR associated BRN [51], hexosamine biosynthetic pathway [52], regulatory network of dengue virus pathogenesis and clearance [45], toll‐like Receptor 4 and JAK/STAT signalling pathways [53], and feeding regimen induced entrainment of hepatocyte circadian oscillators [47].
2.3 Logical parameters estimation using SMBioNet
The k parameters in kinetic logic are unknown apriori. Hence, the next legitimate step is the inference of the correct logical parameters of the reduced BRN. Usually, these logical parameters are based on the experimental data and/or observations which are acquired from literature. However, these parameters are not necessarily always available for all the entities such as, in the cases of larger signalling pathways and the newly identified entities (genes, proteins, metabolites). For such cases, Bernot et al. [54] introduced formal methods‐based model checking approach for correct estimation of logical parameters of BRNs. It is a model verification method for finite‐state systems which is implemented using SMBioNet (Selection of Models of Biological Networks) tool [42]. It performs exhaustive state space search of finite state systems based on the temporal logic formulas which are deduced from experimental observations. This allows verifying the existence of these properties in the entire set of states. The temporal logical formalism used by SMBionet is computation tree logic (CTL) which is able to cater the branching state space. The CTL formulas use state and path quantifiers to describe the desired biological properties and are discussed below:
The first path quantifier ‘A’ corresponds to ‘for all paths’ and specifies all trajectories originating from the current state holding a given property.
The second path quantifier ‘E’ corresponds to ‘there exists a path’ and specifies at least one trajectory originating from the current state holding a given property.
The first state quantifier ‘G’ (globally) corresponds to ‘all states’ which specifies that a given property holds in all states including the current state.
The second state quantifier ‘F’ (future) corresponds to ‘future state’ which specifies that a given property may hold in one of the future states.
The last state quantifier ‘X’ (next) corresponds to ‘next state’ which specifies that a given property hold in the immediate successor state.
The symbol corresponds to the logical implication.
The interaction graph (BRN) and the CTL formulas are provided as input to the SMBioNet which then generates all the possible parameters sets. These parameter sets are then verified and selected for further analysis on the basis of the provided CTL formulas by a model checker NuSMV [42, 55]. This method for estimation of logical parameters of different BRNs has been used previously in [45, 46, 51, 52, 53]. Moreover, we refer our readers to [42, 56, 57, 58] for a comprehensive literature review of the methodology used for logical parameters estimation.
2.4 Analysis of discrete model (state graph)
Graph theory is a mathematical formalism used for studying the graph‐based structures [59]. It allows the analysis of the large graphs based on their topological (structural) properties. It has been widely used to analyse different types of biological networks [60, 61, 62, 63, 64, 65]. It is also helpful for the analysis of large discrete models of associated BRNs to identify the key properties such as cycles and stable states (SS). Betweenness centrality is one of the graph‐theoretic measures which computes the tendency of a node to occur in all of the shortest paths in a network [66, 67]. It is often used to rank the nodes to assess their topological significance. The nodes with larger betweenness centrality indicate the larger tendency of the node for its occurrence in all of the shortest paths of a network. It is thus a ranking measure for assessment of their viability and frequency of expression [68, 69, 70]. This approach has been previously used to analyse the discrete models of mTOR associated BRN [51], hexosamine biosynthetic pathway [52] and hepatic circadian system [47]. It was similarly deployed to analyse the discrete model of ANGPTL8 associated BRN.
2.5 Petri net modelling and analysis
Petri net is a very powerful and intuitive mathematical formalism for the modelling of real systems. It was developed by Carl Adam Petri in 1939 to model biochemical systems [71]. Since then, it has been used to model a range of biological systems based on its tendency to model both the discrete and continuous systems with flexibility and simplicity of representation [72, 73, 74, 75, 76, 77, 78, 79]. Moreover, the simulations of these models allow us to view the time‐dependent dynamic behaviours of the systems under study. The Petri net models provide the biologists with sound experimenting platform to test and analyse their hypotheses. We direct our readers to [80, 81, 82] for a comprehensive explanation of Petri net methodology and its applications.
2.5.1 Semantics of Petri net
A Petri net is a bipartite graph comprising of two types of nodes, i.e. places and transitions. Places are represented by circles and transitions are represented by bars or squares (Fig. 5). As per rule, a directed arc connects a place with a transition and vice versa. In a biological system, a place represents the entities such as, chemical compound, protein, gene, mRNA, metabolites etc. while a transition represents a chemical reaction or biological process. Different types of biological processes such as, association, dissociation, transcription, translation and cellular translocation are graphically illustrated with Petri net formalism in Fig. 6 (adopted from [83]). The tokens (black dots) or real numbers in the places are used to model the quantities of the entities (Fig. 5). The transitions in a Petri net models the flow of these tokens from pre‐places to post‐places. The transition is said to be enabled if the marking of its pre‐places is equivalent to the multiplicity of the arcs connecting them. An enabled transition may fire which means tokens move from pre‐places to post‐places according to the multiplicity of respective arcs. At a time instant t, the markings of all places of a Petri net specifies its state. The formal semantics of Petri nets adapted from [80, 83] are provided in Supplementary File 1. Readers are directed to several recent studies for more insights into the application and usage of Petri nets in modelling biological systems [84, 85, 86].
Fig. 5.
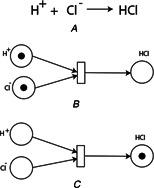
Example of Petri nets representation of a chemical reaction
(A) Chemical reaction describes formation of hydrochloric acid (HCl), (B) Petri net representation of the chemical reaction before formation of HCl. The tokens in the pre‐places corresponds to the concentrations of the ions and ions indicating that the reaction has not occurred yet, (C) Petri net representation of the chemical reaction after firing of the transition indicating the formation of HCl. The token in the post‐place corresponds to the concentrations of the HCl
Fig. 6.
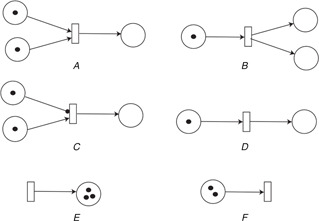
Examples of Petri nets representation in biological processes adapted from [83]
(A) Complexation or association process is represented with Petri nets. Two pre‐places represent the substrates or protein that can form a complex represented by a single post‐place, (B) De‐complexation or disassociation process is represented with Petri nets. A single pre‐place represents a complexed protein or entity which can be broken down into two different proteins or entities represented with post‐places, (C) Enzymatic reaction is described with Petri net representation. The pre‐place which connects with the transition with a rounded arrow depicts the enzyme which is used as a catalyst without consumption. This type of arc is called a read arc. The second pre‐place depicts the substrate protein and the transition corresponds to the enzymatic reaction, (D) Cellular translocation process is represented, (E) , (F) Protein synthesis and degradation processes are described using petri nets
3 Results and discussion
3.1 Construction of BRN of ANGPTL8
The signalling pathway constructed from the existing literature on the interactions of ANGPTL8 (Fig. 2) was reduced to a BRN consisting of 8 genes (AKT, FOXO, mTORC1, mTORC2, SREBP, ChREBP, ANGPTL8, and THR) and 15 interactions (Fig. 7). The reduction of the signalling pathway is based on the approach described by [49, 50] and explained in Section 2.
Fig. 7.
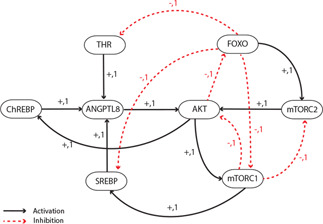
BRN of ANGPTL8: The abstraction of ANGPTL8 signalling was performed using the reduction rules of logical modelling. The resultant BRN consists of 8 genes and 15 interactions. The ‘+’ and ‘−’ signs correspond to the positive and negative regulations, respectively
The BRN is composed of well‐known regulatory circuits involved in maintaining the homeostasis of glucose and lipid metabolism through the IS pathway (discussed in Section 1). Moreover, it has been enriched with the new regulatory information with respect to ANGPTL8. Thus, the BRN captures all the important feedback motifs involved in its regulation with special emphasis on its transcriptional activation. The BRN is composed of several positive and negative feedback circuits. A positive feedback circuit is composed of even number of inhibitor arcs and is a necessary condition for bistability (two stable steady states). A negative feedback loop, on the other hand is comprised of odd number of negative elements and results in sustained oscillations. It can be observed in the ANGPTL8 associated BRN that two transcription factors (SREBP and THR) of ANGPTL8 are the part of positive feedbacks (Fig. 7).
3.2 Logical parameters estimation using SMBioNet
The correct logical parameters estimation is required for the construction of a discrete model. The logical parameters of the ANGPTL8 associated BRN were estimated using the model checking tool SMBioNet [42]. The complete source code for the computation of parameters values using SMBioNet is provided in Supplementary File 2. The first section entitled ‘VAR’ enlists the allowed discrete values for all the eight entities of the BRN of ANGPTL8 (AKT, FOXO, mTORC1, mTORC2, SREBP, ChREBP, ANGPTL8, THR). The allowed minimum and maximum levels were selected 0 and 1, respectively. Each interaction of the BRN was defined in the second section entitled ‘REG’. Each interaction is defined by listing its source entity followed by its threshold level required to induce the activity of the target entity. It is followed by listing the name of the target entity. For example, the interaction of the BRN in which SREBP is activating ANGPTL8 with a threshold level 1 is defined as SREBP [(SREBP ≥ 1)] ≥ ANGPTL8. Similarly, all the interactions of ANGPTL8 associated BRN were provided in the SMBioNet input file (Supplementary File 2). The next section entitled ‘PARA’ defines the logical parameters based on resources of each entity present in the ANGPTL8 associated BRN. The values of these parameters can be fixed based on the known biological relationship between entities acquired from literature. However, the values for the unknown parameters are left unrestricted which are selected after simulation based on the CTL formulas provided in the fourth section entitled ‘CTL’. The CTL formulas are derived from the qualitative expression levels of the entities as observed during homeostasis or pathogenic conditions of the system under study. They imitate the biological behaviours of the system in the form of paths, cycles and the SS. The CTL formulas used for the inference of the logical parameters of ANGPTL8 associated BRN are listed in Table 1. They are based on the qualitative biological observations obtained from the literature [12, 24, 41, 87].
Table 1.
CTL formulas used to derive the kinetic parameters of ANGPTL8 associated BRN
The CTL formula 1 specifies the existence of homeostatic behaviour of the entities present in the BRN. It postulates that the system is cyclic and starting from an initial configuration (AKT = 0 … FOXO = 1 … mTORC1 = 0 … … … … ) representing the metabolic state in the absence of a nutritional stimulus, it can reach back to this state from its successor states. CTL Formula 2 enforces the condition of insulin resistance as described in [12, 41]. It states that the system starting from an initial configuration ( … … … … … … ) (representing the normal metabolic state in the absence of feeding signal) may lead towards a pathogenic state with the configuration ( … … … … … … ).
The BRN (Fig. 7) and CTL formulas (Table 1) were provided as input to the SMBioNet which then returned four different set of parameters satisfying these formulas (Supplementary File 2). The values of two parameters ( and ) were different in the generated sets which were screened manually and selected as follows:
The parameter depicts the level of AKT in the presence of its inhibitor mTORC1 and its activator mTORC2. mTORC1 is the inhibitor of not only AKT but also mTORC2, in the ANGPTL8 associated BRN. Therefore, we selected the value 0 for this parameter. This left in the selection of single model whose parameters are listed in Table 2.
The value of the parameter depicts the level of SREBP in the presence of its inhibitor FOXO and its activator mTORC1. Its value was 0 in the model based on the previous selection. This selection is also supported by the inhibitory influence of FOXO on SREBP and mTORC1 in the ANGPTL8 associated BRN.
Table 2 shows the complete list of parameters of ANGPTL8 associated BRN, along with their resources, allowed range of values and the selected values of the model for subsequent analysis.
Table 2.
Logical parameters are estimated by using SMBioNet. The third column indicates the resources. Thefourth indicates the permissible expression levels. The fifth column (selected values) shows finalvalues of logical parameters, computed by using SMBioNet
| No | Parameter | Resource | Allowed range of values | Selected values | ||
|---|---|---|---|---|---|---|
| 1 |
|
|
0 | 0 | ||
| 2 |
|
{ANGPTL8} | 0,1 | 1 | ||
| 3 |
|
{mTORC1} | 0 | 0 | ||
| 4 |
|
{mTORC2} | 0,1 | 0 | ||
| 5 |
|
{ANGPTL8,mTORC1} | 1 | 1 | ||
| 6 |
|
{mTORC1,mTORC2} | 1 | 1 | ||
| 7 |
|
{ANGPTL8,mTORC2} | 0,1 | 1 | ||
| 8 |
|
{ANGPTL8, mTORC1, mTORC2} | 1 | 1 | ||
| 9 |
|
|
0 | 0 | ||
| 10 |
|
{AKT} | 1 | 1 | ||
| 11 |
|
|
0 | 0 | ||
| 12 |
|
{AKT} | 0 | 0 | ||
| 13 |
|
{FOXO} | 1 | 1 | ||
| 14 |
|
{AKT,FOXO} | 1 | 1 | ||
| 15 |
|
|
0 | 0 | ||
| 16 |
|
{FOXO} | 1 | 1 | ||
| 17 |
|
{mTORC1} | 0 | 0 | ||
| 18 |
|
{FOXO,mTORC1} | 1 | 1 | ||
| 19 |
|
|
0 | 0 | ||
| 20 |
|
{FOXO} | 1 | 1 | ||
| 21 |
|
|
0 | 0 | ||
| 22 |
|
{FOXO} | 0 | 0 | ||
| 23 |
|
{mTORC1} | 0,1 | 0 | ||
| 24 |
|
{FOXO,mTORC1} | 1 | 1 | ||
| 25 |
|
|
0 | 0 | ||
| 26 |
|
{ChREBP} | 1 | 1 | ||
| 27 |
|
{THR} | 1 | 1 | ||
| 28 |
|
{SREBP} | 1 | 1 | ||
| 29 |
|
{ChREBP,SREBP} | 1 | 1 | ||
| 30 |
|
{ChREBP,THR} | 1 | 1 | ||
| 31 |
|
{SREBP,THR} | 1 | 1 | ||
| 32 |
|
{ChREBP,SREBP,THR} | 1 | 1 | ||
| 33 |
|
|
0 | 0 | ||
| 34 |
|
{AKT} | 1 | 1 |
3.3 Analysis of discrete model
The discrete model of the ANGPTL8 associated BRN was constructed using GENOTECH [https://github.com/DrJamilAhmad/GENOTECH/blob/master/GenoTechE.jar] software [88]. It requires the BRN and appropriate set of parameters to generate the discrete model (state graph). The BRN file constructed in GENOTECH is attached as Supplementary File 3. The discrete model was further analysed using the Cytoscape which is a network visualisation and analysis software [89].
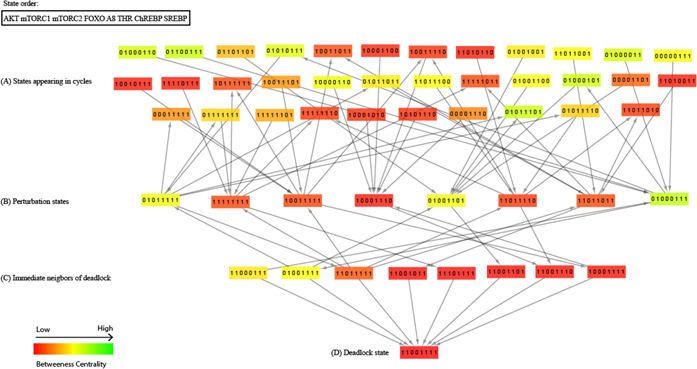
The discrete model of ANGPTL8 associated BRN consists of 256 states 1024 edges which is graphically illustrated in (Fig. 8) and rendered using Cytoscape (provided as Supplementary File 4). The states have been analysed using betweenness centrality which is used to classify them in different sizes and colours. The darker colours and smaller sizes correspond to low betweenness centrality of the states and brighter colours and large sizes correspond to the high betweenness centrality of the states. The model reveals several interesting behaviours including the trajectories among homeostatic states and stable state (also called deadlock or sink state). A stable state (11001111) which corresponds to insulin resistance is observed in this model. The entities follow the order in all qualitative states. The stable state shows the high expression levels of ANGPTL8 along with AKT, mTORC1, THR, ChREBP and SREBP demonstrating the activation of lipogenic processes. Moreover, the expression of gluconeogeneic genes which is mainly regulated by FOXO transcription factors is downregulated in this state. These results are in agreement with the widely accepted model of insulin resistance [41]. This model suggests that insulin resistance is a multiple‐hits‐based pathogenic process. It progressively leads to Diabetes Mellitus and other metabolic disorders through successive accumulation of disordered regulation of genes and metabolites. When the energy intake (through increased food) is increased, our body starts producing more insulin which is the first step of the insulin resistance [5, 7, 12, 13]. It enhances the lipogeneic (lipid forming) metabolic circuit through sustained activation of SREBP1c, ChREBP and LXR transcription factors whereas it strongly represses the gluconeogenic processes through inhibition of FOXO. The continuous lipogenesis can produce harmful metabolites as by‐products such as, Diacylglycerols (DAGs), ceramides and reactive oxygen species which may later lead to the activation of FOXOs and initiate the inflammation processes as well [41, 90, 91]. Thus, the twin abnormalities, i.e. gluconeogenesis and lipogenesis are exhibited at the same time which is a characteristic feature of Diabates Mellitus type 2 (Fig. 1).
Fig. 8.
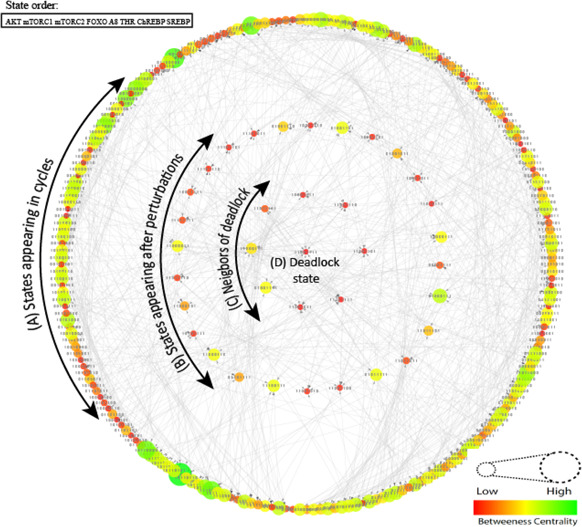
Discrete model (state graph) of BRN of ANGPTL8
(A) Deadlock state (1,1,0,0,1,1,1,1) corresponding to insulin resistance is observed. It is shown with the smallest circle of red colour in the middle of the state graph. The states in the circles, (B) , (C) Correspond to the perturbation and immediate neighbouring states of deadlock, respectively. The states in outer most circle (A) corresponds to the homeostatic states. The entities in all qualitative states follow the order
Moreover, the model reveals the trajectories between homeostatic states corresponding to the behaviour of these entities under normal cellular conditions. The outermost cycle of the discrete model (Fig. 8) corresponds to the homeostatic states. The states in the second and third circles correspond to the states which occur when the system is perturbed and immediately leads to the deadlock state, respectively. Among these, several bifurcation states can occur which can diverge the system towards the deadlock or back to the homeostatic states depending on the regulatory events. These bifurcation states are important determinants to understand the regulatory events important for maintaining homeostasis and pathogenesis induction. Since the model is too large for analysis we isolated a subgraph which shows step‐by‐step transitions of different bifurcation states leading towards and from the deadlock state (Fig. 9). The bifurcation states (11000111), (11011111), (01001111) and (10001111) leads the system back to homeostasis through following successor states (11111111), (11011110), (11011011), (01011111), (10011111), (10001110), (01001101), (01000111) (Fig. 9). Analysis of these successor states revealed decrease in the expression of genes AKT, ChREBP, SREBP, ANGPTL8, mTORC1 and THR along with an increase in the expression of genes FOXO and mTORC2. Similarly the transitions leading the bifurcation states towards the pathogenic state (11001111) exhibited an increase in expression of genes AKT, ChREBP, SREBP, ANGPTL8, mTORC1 and THR along with a decrease in the FOXO and mTORC2 expression. These observations were utilised to estimate the parameters of Petri net model to exhibit the homeostatic and insulin resistance behaviour in simulation graphs by trial and error.
Fig. 9.
Subgraph of discrete model illustrating transitions of bifurcation states towards deadlock and homeostatic states
(A) Homeostatic states which are either leading to or are reached back from the bifurcation states are shown, (B) Perturbation states involved in the trajectories which are either leading towards homeostasis or pathogenesis states are shown, (C) Immediate neighbours of deadlock are shown, (D) Deadlock state (1,1,0,0,1,1,1,1) corresponding to insulin resistance is shown. The entities follow the order in all qualitative states
3.4 Validation of qualitative model with ASP
We have tested the BRN for the static analysis using the Pint tool which is a static analyser for automata networks and can be accessed at [https://loicpauleve.name/pint/.]. It is based on the Answer set programming (ASP) language which can compute all of the fixed points (SS) of the discrete model [51, 92, 93]. The static analysis of SS of our discrete model by Pint tool also includes the deadlock state identified in our discrete model, i.e. (1,1,0,0,1,1,1,1) following the order of entities as (AKT, mTORC1, mTORC2, FOXO, ANGPTL8, THR, ChREBP, SREBP).
3.5 Petri net modelling and analysis
The BRN of ANGPTL8 was converted into an equivalent stochastic Petri net according to the methods described above. The complete Petri net of ANGPTL8 associated BRN is provided in the Supplementary File 5. It consists of 16 places, 22 transitions and 116 arcs. Two parameter sets were generated to visualise the homeostatic and stable state behaviours as observed in the discrete model by trial and error and described below (Table 3). These parameters calculate the random time delay variables for the time of activation, i.e. reaching from lower level to higher level and the time of inhibition that is reaching from high level to low level based on the expression of states already present in the discrete model. Moreover, an additional scenario was modelled comparable with the experiments of [12] to scrutinise the role of ANGPTL8 during insulin resistance. Every simulation was performed 1000 times to compute the average time course. The Petri net model exported in SBML format using Snoopy tool is provided as Supplementary File 6.
Table 3.
Kinetic parameters of Petri Net of ANGPTL8 associated BRN. Two set of parameters are estimatedcorresponding to the homeostasis and insulin resistance behaviours of entities as identified in thediscrete model based on the observations from reported literature [12, 24, 41,87]
| S.no | Transition name | Parameter values for homeostasis | Parameter values for stable state |
|---|---|---|---|
| 1 | t_AKT_0n | 2 | 1 |
| 2 | t_AKT_1p | 0.02 | 1 |
| 3 | t_AKT_2p | 0.2 | 1 |
| 4 | t_AKT_3n | 2 | 1 |
| 5 | t_AKT_4p | 3 | 1 |
| 6 | t_ANGPTL8_0n | 12 | 1 |
| 7 | t_ANGPTL8_1p | 3 | 1 |
| 8 | t_ANGPTL8_2p | 0.02 | 1 |
| 9 | t_ANGPTL8_3p | 0.2 | 1 |
| 10 | t_CHREBP_0n | 2.2 | 1 |
| 11 | t_CHREBP_1p | 0.02 | 1 |
| 12 | t_FOXO_0p | 2 | 0.8 |
| 13 | t_FOXO_1n | 0.3 | 2 |
| 14 | t_MTORC1_1p | 0.2 | 3 |
| 15 | t_MTORC1_1n | 1 | 0.02 |
| 16 | t_MTORC2_1n | 0.3 | 0.8 |
| 17 | t_MTORC2_1p | 7 | 5 |
| 18 | t_SREBP_0n | 7 | 0.05 |
| 19 | t_SREBP_1p | 0.2 | 1.5 |
| 20 | t_SREBP_2n | 2.5 | 0.05 |
| 21 | t_TR_0n | 0.1 | 3 |
| 22 | t_TR_1n | 0.2 | 0.02 |
We also conducted the structural analysis of the Petri net by using Charlie Petri net analyser [94] which is provided as Supplementary Files 7–9. Several structural properties including connectedness and invariants were analysed and identified which are described in detail in [95, 96, 97]. The Petri net was found to be connected which biologically means that all of the components in a system are directly or indirectly connected with each other and thus contributes in the system stability. The P‐invariant analyses identified a total of 8 p invariants corresponding to the pairs of each entity displaying their presence and absence (Supplementary File 8). The p invariants demonstrate the preservation of the token (expression level) capacities of the entities. The T‐invariant analyses identified 16 t invariants corresponding to the firing sequences which can reproduce the homeostatic marking (Supplementary File 9). All of these properties are in line with the minimal rules that a Petri net should satisfy to be considered biologically reliable [96, 97].
3.5.1 Homeostasis
The IS pathway is initiated upon insulin binding to its receptor. The signalling cascade activates the energy storage and utilisation gene circuits by activation of mTORC1, SREBP1C, and ChREBP which bifurcates downstream of kinase protein AKT [24, 98, 99]. ANGPTL8 is also induced upon feeding through IS pathway and is regulated by three transcription factors which include THR, ChREBP and SREBP [2, 36, 37, 38]. All of these proteins, mTORC1, SREBP1C, ChREBP, THR and ANGPTL8 have been shown to be involved in lipid and glucose metabolism by activating lipogeneic program and cellular glucose transport and its utilisation. On the other hand, AKT also inhibits the gluconeogenesis through inhibition of FOXO proteins. The AKT signalling is inhibited through the signalling events downstream of mTORC1 (Fig. 7). Thus, the entities of ANGPTL8 associated BRN oscillates during the homeostasis where FOXO shows a decrease when AKT increases (upon fed signal) and it subsequently increases when the fed signal diminishes (Fig. 10). The simulation graphs of each entity are shown in Fig. 10 which are coherent with the biological behaviours of these entities as observed in experimental studies [24, 41, 98, 99, 100]. These graphs depict the timed dynamics of the discrete transitions as observed and verified in the discrete model of ANGPTL8 (Fig. 8).
Fig. 10.
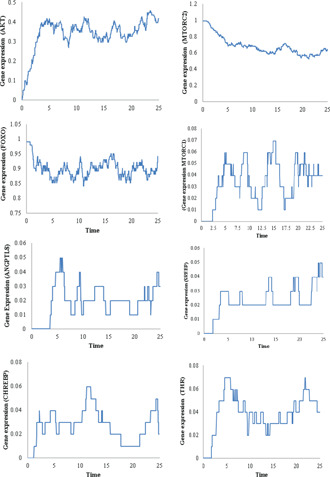
Gene expressions of all entities of the Petri net model of ANGPTL8 associated BRN during homeostasis. Every simulation was performed 1000 times
3.5.2 Insulin resistance
Insulin resistance is a heterogeneous pathogenic process and it starts with elevated systemic insulin due to increasing requirements of the body (such as, in obesity, over‐nutrition) for energy storage [6, 41, 99, 101, 102]. This causes the sustained activation of AKT, ChREBP, LXR and SREBP1C along with inactivation of FOXO proteins [41]. Previous studies have demonstrated that ANGPTL8 is also increased during insulin resistance [5, 12]. We also verified the over‐expression of ANGPTL8 in different models of insulin resistance in our previous study [103]. The kinetic parameters of the Petri net of ANGPTL8 associated BRN which diverges the system towards insulin resistance are provided in Table 3. The simulation graphs of each entity corresponding to the insulin resistance state are illustrated in Fig. 11. The graph shows the sustained activation of AKT, ANGPTL8, SREBP1C, mTORC1, ChREBP, and THR along with the sustained inactivation of mTORC2 and FOXO. These results are in agreement with the previous experimental studies [5, 12, 41]. In the previous model of ANGPTL8 regulation, authors explained through the series of their in‐vitro experiments that ANGPTL8 is involved in phosphorylation of AKT at serine 473 which is sufficient to inhibit FOXO and GSK3‐ during homeostasis and insulin resistance [12, 24]. Their data indicates an increase in ANGPTL8 and AKT concentration during insulin resistance along with a decrease in FOXO and GSK3 . This trend is clearly visible in the simulation graphs (Fig. 11) of the Petri net model of ANGPTL8 associated BRN.
Fig. 11.
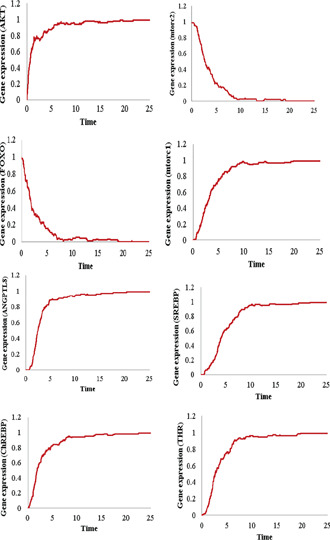
Gene expressions of all entities of the Petri net of ANGPTL8 associated BRN during insulin resistance. The expression of AKT, mTORC1, THR, ChREBP, SREBP and ANGPTL8 are elevated. The expressions of FOXO and mTORC2 exhibit sustained repression. The results are in‐line with the experimental observations of [5 , 12 , 41]. Every simulation was performed 1000 times
3.5.3 ANGPTL8 knockout in insulin resistance
A gene knockout (KO) is a genetic technique which makes a gene inoperable [104]. This means that a knocked out gene cannot be synthesised to its functional form. Such studies are conducted to assess the functional roles of the genes upon their loss on the regulation of the system under study. The Petri nets‐based KO analysis and methodologies have been described previously in [105, 106]. We modelled a gene KO scenario of ANGPTL8 similar to the in‐vivo experiments of [12] to scrutinise the role of ANGPTL8 in insulin resistance. In the experiments of [12], an ANGPTL8 KO HepG2 cell line was used to assess its functional importance during insulin resistance. We imitated this scenario by setting the rates of formation and degradation of ANGTPTL8 equal to 0 in the Petri net model. For the rest of the transitions, the same rates were used which were generated to model insulin resistance state as mentioned in Table 3. The simulation graphs of each entity according to this scenario revealed comparable results with the observations of [12] (Fig. 11). The levels of AKT, ChREBP and FOXO were significantly altered in the ANGPTL8 KO experiment. AKT was not phosphorylated and its expression was reduced due to KO of ANGPTL8. On the other hand, the expressions of FOXO were elevated due to the absence of AKT. Both of these results are in‐line with the experimental observations of [12] and support their hypothesis that ANGPTL8 is involved in improving glucose tolerance through AKT phosphorylation (serine 473) during insulin resistance. Their model suggested that the increased ANGPTL8 during insulin resistance is a part of an adapted cyto‐protective metabolic circuit. Thus, it improves glucose tolerance by the substrates of AKT (including FOXO and GSK3‐ ) dependent on its serine phosphorylation [24] through inhibition of gluconeogenesis and activation of glycogenesis. Moreover, our results demonstrated additional signalling events that are involved in the improved glucose tolerance by ANGPTL8 during insulin resistance. The expression of ChREBP was also reduced which is dependent for its activation on the serine 473 phosphorylation event of AKT (Fig. 12). The signalling events leading to the ChREBP activation through this signalling event is shown in Fig. 2 and have been discussed comprehensively in [4]. ChREBP is a glucose mediated transcription factor which regulates glycolysis and lipogenesis through the transcription of key enzymes [107]. Overall, the role of ANGPTL8 in glucose metabolism is supported through FOXO, GSK3‐ and ChREBP mediated signalling events according to our results.
Fig. 12.
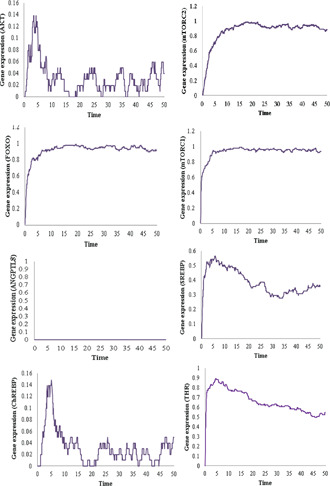
Gene expressions of all entities of the Petri net model of ANGPTL8 associated BRN during insulin resistance with KO of ANGPTL8. The expression of AKT, ChREBP and FOXO is altered in comparison to the insulin resistance state with ANGPTL8 as shown in Fig. 11 . The results are in‐line with the experimental observations of [5 , 12]. Every simulation was performed 1000 times
The expression of the entities in ANGPTL8 KO experiment of Petri net (Fig. 12) resembles the characteristic behaviour of Diabetes Mellitus as described in [12, 41]. In Diabetes Mellitus, both the gluconeogenic processes (regulated by FOXOs mainly) and lipogeneic processes (regulated by ANGPTL8, SREBP, ChREBP, and mTORC1) occur together [41]. Thus, our results revealed that the loss of ANGPTL8 can accelerate the process of pathogenesis. This supports the hypothesis of [12] that ANGPTL8 could be useful in the management of Diabetes Mellitus as a glucose lowering agent.
4 Concluding remarks
ANGPTL8 has been demonstrated to play crucial role in glucose homeostasis during insulin resistance. In this study, we sought to elucidate its role in glucose homeostasis to allow its assessment as a glucose lowering agent as proposed in [12]. As a first step, we constructed the ANGPTL8 signalling pathway by integrating its regulatory information [4]. In this follow‐up study, we isolated important signalling feedback circuits from this pathway and constructed its BRN using the methods of reduction [49, 50]. The kinetic parameters of the BRN were estimated using computational tree logic (CTL) which is a model checking approach. It encodes the biological behaviours into CTL formulas which are verified for their existence in the subsequent discrete model. The discrete model of ANGPTL8 (based on the selected kinetic parameters from the previous step) revealed regulation of the entities in homeostasis and insulin resistance, in‐line with the previous studies. This model was converted into a stochastic Petri net to simulate the time dependent dynamics of this model. The predicted results are in agreement with the previous experimental observations of [12] in exhibiting the sustained elevated and reduced expression levels of AKT and FOXO, respectively during insulin resistance. Moreover, it provides new insights on the role of ANGPTL8 by exhibiting the low levels of ChREBP through ANGPTL8 KO experiment. Our results support the hypothesis of [12] on the role of ANGPTL8 in supplementing the IS pathway during insulin resistance in comparison to homeostasis. It demonstrates that ANGPTL8 improves glucose tolerance during insulin resistance through AKT serine (473) phosphorylation which regulates FOXO, GSK3 and ChREBP. The ANGPTL8 KO experiment further demonstrates that the loss of ANGPTL8 can aggravate the pathogenic process and can quickly lead towards Diabetes Mellitus. Thus, the results of this study could help in further delineating and verifying the role of ANGPTL8 as a therapeutic target for treatment of Diabetes Mellitus and related disorders. However, its therapeutic potential cannot be assessed without fully comprehending its role in lipid metabolism as well which involves organ crosstalk. Therefore, similar studies which could delineate the role of ANGPTL8 in lipid metabolism are suggested for future investigations.
5 References
- 1. Quagliarini F., Wang Y., and Kozlitina J. et al.: ‘Atypical Angiopoietin‐like protein that regulates ANGPTL3’, Proc. Natl. Acad. Sci., 2012, 109, (48), pp. 19751–19756 [DOI] [PMC free article] [PubMed] [Google Scholar]
- 2. Ren G., Kim J.Y., and Smas C.M.: ‘Identification of RIFL, a novel adipocyte‐enriched insulin target gene with a role in lipid metabolism’, Am. J. Physiol.‐Endocrinol. Metab., 2012, 303, (3), pp. E334–E351 [DOI] [PMC free article] [PubMed] [Google Scholar]
- 3. Zhang R.: ‘Lipasin, a novel nutritionally‐regulated liver‐enriched factor that regulates serum triglyceride levels’, Biochem. Biophys. Res. Commun., 2012, 424, (4), pp. 786–792 [DOI] [PubMed] [Google Scholar]
- 4. Siddiqa A., Cirillo E., and Tareen S.H. et al.: ‘Visualizing the regulatory role of Angiopoietin‐like protein 8 (ANGPTL8) in glucose and lipid metabolic pathways’, Genomics, 2017, 109, (5–6), pp. 408–418 [DOI] [PubMed] [Google Scholar]
- 5. Yi P., Park J.S., and Melton D.A.: ‘Betatrophin: a hormone that controls pancreatic beta cell proliferation’, Cell, 2013, 153, (4), pp. 747–758 [DOI] [PMC free article] [PubMed] [Google Scholar] [Retracted]
- 6. Samuel V.T., and Shulman G.I.: ‘The pathogenesis of insulin resistance: integrating signaling pathways and substrate flux’, J. Clin. Invest., 2016, 126, (1), pp. 12–22 [DOI] [PMC free article] [PubMed] [Google Scholar]
- 7. Kraft J.R.: ‘Diabetes epidemic … you’ (Trafford Publishing, Canada, 2008) [Google Scholar]
- 8. Harvey R.A., and Ferrier D.R.: ‘Biochemistry’ (Lippincott Williams … Wilkins, United States, 2011) [Google Scholar]
- 9. Weyer C., Bogardus C., and Mott D.M. et al.: ‘The natural history of insulin secretory dysfunction and insulin resistance in the pathogenesis of type 2 diabetes mellitus’, J. Clin. Invest., 1999, 104, (6), pp. 787–794 [DOI] [PMC free article] [PubMed] [Google Scholar]
- 10. Goldstein B.J.: ‘Insulin resistance as the core defect in type 2 diabetes mellitus’, Am. J. Cardiol., 2002, 90, (5), pp. 3–10 [DOI] [PubMed] [Google Scholar]
- 11. Weyer C., Tataranni P.A., and Bogardus C. et al.: ‘Insulin resistance and insulin secretory dysfunction are independent predictors of worsening of glucose tolerance during each stage of type 2 diabetes development’, Diabetes Care, 2001, 24, (1), pp. 89–94 [DOI] [PubMed] [Google Scholar]
- 12. Guo X.R., Wang X.L., and Chen Y. et al.: ‘ANGPTL8/betatrophin alleviates insulin resistance via the Akt‐GSK3β or Akt‐FoxO1 pathway in HepG2 cells’, Exp. Cell Res., 2016, 345, (2), pp. 158–167 [DOI] [PubMed] [Google Scholar]
- 13. Ouaamari A.E., Kawamori D., and Dirice E. et al.: ‘Liver‐derived systemic factors drive β cell hyperplasia in insulin‐resistant states’, Cell. Rep., 2013, 3, (2), pp. 401–410 [DOI] [PMC free article] [PubMed] [Google Scholar]
- 14. Michael M.D., Kulkarni R.N., and Postic C. et al.: ‘Loss of insulin signaling in hepatocytes leads to severe insulin resistance and progressive hepatic dysfunction’, Mol. Cell, 2000, 6, (1), pp. 87–97 [PubMed] [Google Scholar]
- 15. Cox A.R., Barrandon O., and Cai E.P. et al.: ‘Resolving discrepant findings on ANGPTL8 in β‐cell proliferation: a collaborative approach to resolving the betatrophin controversy’, PloS one, 2016, 11, (7), p. e0159276 [DOI] [PMC free article] [PubMed] [Google Scholar]
- 16. Gusarova V., Alexa C.A., and Na E. et al.: ‘ANGPTL8/betatrophin does not control pancreatic beta cell expansion’, Cell, 2014, 159, (3), pp. 691–696 [DOI] [PMC free article] [PubMed] [Google Scholar]
- 17. Bevan P.: ‘Insulin signalling’, J. Cell Sci., 2001, 114, (8), pp. 1429–1430 [DOI] [PubMed] [Google Scholar]
- 18. Stokoe D., Stephens L.R., and Copeland T. et al.: ‘Dual role of phosphatidylinositol‐3, 4, 5‐trisphosphate in the activation of protein kinase B’, Science, 1997, 277, (5325), pp. 567–570 [DOI] [PubMed] [Google Scholar]
- 19. Alessi D.R., James S.R., and Downes C.P. et al.: ‘Characterization of a 3‐phosphoinositide‐dependent protein kinase which phosphorylates and activates protein kinase Bα’, Curr. Biol., 1997, 7, (4), pp. 261–269 [DOI] [PubMed] [Google Scholar]
- 20. Alessi D.R., Andjelkovic M., and Caudwell B. et al.: ‘Mechanism of activation of protein kinase b by insulin and IGF‐1’, EMBO J., 1996, 15, (23), pp. 6541–6551 [PMC free article] [PubMed] [Google Scholar]
- 21. Sarbassov D.D., Guertin D.A., and Ali S.M. et al.: ‘Phosphorylation and regulation of Akt/PKB by the rictor‐mTOR complex’, Science, 2005, 307, (5712), pp. 1098–1101 [DOI] [PubMed] [Google Scholar]
- 22. Yang G., Murashige D.S., and Humphrey S.J. et al.: ‘A positive feedback loop between Akt and mTORC2 via sin1 phosphorylation’, Cell. Rep., 2015, 12, (6), pp. 937–943 [DOI] [PubMed] [Google Scholar]
- 23. Guertin D.A., Stevens D.M., and Thoreen C.C. et al.: ‘Ablation in mice of the mTORC components raptor, rictor, or mLST8 reveals that mTORC2 is required for signaling to Akt‐FOXO and PKCα, but not S6K1’, Dev. Cell, 2006, 11, (6), pp. 859–871 [DOI] [PubMed] [Google Scholar]
- 24. Vadlakonda L., Dash A., and Pasupuleti M. et al.: ‘The paradox of Akt‐mTOR interactions’, Front. Oncol., 2013, 3, p. 165 [DOI] [PMC free article] [PubMed] [Google Scholar]
- 25. Düvel K., Yecies J.L., and Menon S. et al.: ‘Activation of a metabolic gene regulatory network downstream of mTOR complex 1’, Mol. Cell, 2010, 39, (2), pp. 171–183 [DOI] [PMC free article] [PubMed] [Google Scholar]
- 26. Owen J.L., Zhang Y., and Bae S.‐H. et al.: ‘Insulin stimulation of SREBP‐1c processing in transgenic rat hepatocytes requires p70 S6‐kinase’, Proc. Natl. Acad. Sci., 2012, 109, (40), pp. 16184–16189 [DOI] [PMC free article] [PubMed] [Google Scholar]
- 27. Quinn W.J., and Birnbaum M.J.: ‘Distinct mTORC1 pathways for transcription and cleavage of SREBP‐1c’, Proc. Natl. Acad. Sci., 2012, 109, (40), pp. 15974–15975 [DOI] [PMC free article] [PubMed] [Google Scholar]
- 28. Grønning‐Wang L.M., Bindesbøll C., and Nebb H.I.: ‘The role of liver X receptor in hepatic de novo lipogenesis and cross‐talk with insulin and glucose signaling’, in Baez R.V. (Ed.): ‘Lipid metabolism’ (InTech, London UK, 2013), pp. 61–90 [Google Scholar]
- 29. Julien L.‐A., Carriere A., and Moreau J. et al.: ‘mTORC1‐activated S6K1 phosphorylates rictor on threonine 1135 and regulates mTORC2 signaling’, Mol. Cell. Biol., 2010, 30, (4), pp. 908–921 [DOI] [PMC free article] [PubMed] [Google Scholar]
- 30. Lee J., Hong S.‐W., and Park S.E. et al.: ‘Amp‐activated protein kinase suppresses the expression of LXR/SREBP‐1 signaling‐induced ANGPTL8 in HepG2 cells’, Mol. Cell. Endocrinol., 2015, 414, pp. 148–155 [DOI] [PubMed] [Google Scholar]
- 31. Cha J.‐Y., and Repa J.J.: ‘The liver X receptor (LXR) and hepatic lipogenesis the carbohydrate‐response element‐binding protein is a target gene of LXR’, J. Biol. Chem., 2007, 282, (1), pp. 743–751 [DOI] [PubMed] [Google Scholar]
- 32. Tikhanovich I., Cox J., and Weinman S.A.: ‘Forkhead box class O transcription factors in liver function and disease’, J. Gastroenterol. Hepatol., 2013, 28, (S1), pp. 125–131 [DOI] [PMC free article] [PubMed] [Google Scholar]
- 33. Chen C.‐C., Jeon S.‐M., and Bhaskar P.T. et al.: ‘FOXOs inhibit mTORC1 and activate Akt by inducing the expression of sestrin3 and rictor’, Dev. Cell, 2010, 18, (4), pp. 592–604 [DOI] [PMC free article] [PubMed] [Google Scholar]
- 34. Saltiel A.R., and Kahn C.R.: ‘Insulin signalling and the regulation of glucose and lipid metabolism’, Nature, 2001, 414, (6865), pp. 799–806 [DOI] [PubMed] [Google Scholar]
- 35. Poupeau A., and Postic C.: ‘Cross‐regulation of hepatic glucose metabolism via ChREBP and nuclear receptors’, Biochim. Biophys. Acta, Mol. Basis Dis., 2011, 1812, (8), pp. 995–1006 [DOI] [PubMed] [Google Scholar]
- 36. Fu Z., Berhane F., and Fite A. et al.: ‘Elevated circulating lipasin/betatrophin in human type 2 diabetes and obesity’, Sci. Rep., 2014, 4, p. 1415 [DOI] [PMC free article] [PubMed] [Google Scholar]
- 37. Jeong Y.‐S., Kim D., and Lee Y.S. et al.: ‘Integrated expression profiling and genome‐wide analysis of ChREBP targets reveals the dual role for ChREBP in glucose‐regulated gene expression’, PLOS One, 2011, 6, (7), p. e22544 [DOI] [PMC free article] [PubMed] [Google Scholar]
- 38. Tseng Y.‐H., Ke P.‐Y., and Liao C.‐J. et al.: ‘Chromosome 19 open reading frame 80 is upregulated by thyroid hormone and modulates autophagy and lipid metabolism’, Autophagy, 2014, 10, (1), pp. 20–31 [DOI] [PMC free article] [PubMed] [Google Scholar]
- 39. Mullur R., Liu Y.‐Y., and Brent G.A.: ‘Thyroid hormone regulation of metabolism’, Physiol. Rev., 2014, 94, (2), pp. 355–382 [DOI] [PMC free article] [PubMed] [Google Scholar]
- 40. Lartey L.J., Werneck‐de Castro J.P., and InSug O. et al.: ‘Coupling between nutrient availability and thyroid hormone activation’, J. Biol. Chem., 2015, 290, (51), pp. 30551–30561 [DOI] [PMC free article] [PubMed] [Google Scholar]
- 41. Haeusler R.A., Hartil K., and Vaitheesvaran B. et al.: ‘Integrated control of hepatic lipogenesis vs. glucose production requires FOXO transcription factors’, Nat. Commun., 2014, 5, p. 5190 [DOI] [PMC free article] [PubMed] [Google Scholar]
- 42. Khalis Z., Comet J.‐P., and Richard A. et al.: ‘The SMBioNet method for discovering models of gene regulatory networks’, Genes Genomes Genomics, 2009, 3, (1), pp. 15–22 [Google Scholar]
- 43. Chaouiya C., Remy E., and Ruet P. et al.: ‘Qualitative modelling of genetic networks: from logical regulatory graphs to standard Petri nets’. Int. Conf. on Application and Theory of Petri Nets, Bologna, Italy, 2004, pp. 137–156 [Google Scholar]
- 44. Thomas R., and D'Ari R.: ‘Biological feedback’ (CRC press, United States, 1990) [Google Scholar]
- 45. Aslam B., Ahmad J., and Ali A. et al.: ‘On the modelling and analysis of the regulatory network of dengue virus pathogenesis and clearance’, Comput. Biol. Chem., 2014, 53, pp. 277–291 [DOI] [PubMed] [Google Scholar]
- 46. Ahmad J., Niazi U., and Mansoor S. et al.: ‘Formal modeling and analysis of the mal‐associated biological regulatory network: insight into cerebral malaria’, PloS One, 2012, 7, (3), p. e33532 [DOI] [PMC free article] [PubMed] [Google Scholar]
- 47. Tareen S.H.K., and Ahmad J.: ‘Modelling and analysis of the feeding regimen induced entrainment of hepatocyte circadian oscillators using Petri nets’, PloS one, 2015, 10, (3), p. e0117519 [DOI] [PMC free article] [PubMed] [Google Scholar]
- 48. Ahmad J., and Roux O.: ‘Invariance kernel of biological regulatory networks’, Int. J. Data Mining Bioinf., 2010, 4, (5), pp. 553–570 [DOI] [PubMed] [Google Scholar]
- 49. Naldi A., Remy E., and Thieffry D. et al.: ‘A reduction of logical regulatory graphs preserving essential dynamical properties’. Computational Methods in Systems Biology (CMSB), Bologna, Italy, 2009, vol. 9, pp. 266–280 [Google Scholar]
- 50. Saadatpour A., Albert R., and Reluga T.C.: ‘A reduction method for boolean network models proven to conserve attractors’, SIAM J. Appl. Dyn. Syst., 2013, 12, (4), pp. 1997–2011 [DOI] [PMC free article] [PubMed] [Google Scholar]
- 51. Bibi Z., Ahmad J., and Siddiqa A. et al.: ‘Formal modeling of mTOR associated biological regulatory network reveals novel therapeutic strategy for the treatment of cancer’, Front. Physiol., 2017, 8, p. 416 [DOI] [PMC free article] [PubMed] [Google Scholar]
- 52. Saeed M.T., Ahmad J., and Kanwal S. et al.: ‘Formal modeling and analysis of the hexosamine biosynthetic pathway: role of o‐linked n‐acetylglucosamine transferase in oncogenesis and cancer progression’, PeerJ, 2016, 4, p. e2348 [DOI] [PMC free article] [PubMed] [Google Scholar]
- 53. Paracha R.Z., Ahmad J., and Ali A. et al.: ‘Formal modelling of toll like receptor 4 and JAK/STAT signalling pathways: insight into the roles of SOCS‐1, interferon‐β and proinflammatory cytokines in sepsis’, PloS One, 2014, 9, (9), p. e108466 [DOI] [PMC free article] [PubMed] [Google Scholar]
- 54. Bernot G., Comet J.‐P., and Richard A. et al.: ‘Application of formal methods to biological regulatory networks: extending Thomas’ asynchronous logical approach with temporal logic’, J. Theor. Biol., 2004, 229, (3), pp. 339–347 [DOI] [PubMed] [Google Scholar]
- 55. Richard A., Comet J.‐P., and Bernot G.: ‘Formal methods for modeling biological regulatory networks’, in Gabbar H.A. (Ed.): ‘Modern formal methods and applications’ (Springer, Dordrecht, 2006), pp. 83–122 [Google Scholar]
- 56. Saeed M.T., Ahmad J., and Baumbach J. et al.: ‘Parameter estimation of qualitative biological regulatory networks on high performance computing hardware’, BMC Syst. Biol., 2018, 12, (1), p. 146 [DOI] [PMC free article] [PubMed] [Google Scholar]
- 57. Bakir M.E., Konur S., and Gheorghe M. et al.: ‘Automatic selection of verification tools for efficient analysis of biochemical models’, Bioinformatics, 2018, 34, (18), pp. 3187–3195 [DOI] [PMC free article] [PubMed] [Google Scholar]
- 58. Ito S., Izumi N., and Hagihara S. et al.: ‘Qualitative analysis of gene regulatory networks by satisfiability checking of linear temporal logic’. 2010 IEEE Int. Conf. on BioInformatics and BioEngineering, Philadelphia, PA, 2010, pp. 232–237 [Google Scholar]
- 59. Bondy J.A., and Murty U.S.R.: ‘Graph theory with applications’, vol. 290, (Citeseer, United States, 1976) [Google Scholar]
- 60. Barabasi A.‐L., and Oltvai Z.N.: ‘Network biology: understanding the cell's functional organization’, Nat. Rev. Genetics, 2004, 5, (2), pp. 101–113 [DOI] [PubMed] [Google Scholar]
- 61. Goh K.‐I., Cusick M.E., and Valle D. et al.: ‘The human disease network’, Proc. Natl. Acad. Sci., 2007, 104, (21), pp. 8685–8690 [DOI] [PMC free article] [PubMed] [Google Scholar]
- 62. Vidal M., Cusick M.E., and Barabási A.‐L.: ‘Interactome networks and human disease’, Cell, 2011, 144, (6), pp. 986–998 [DOI] [PMC free article] [PubMed] [Google Scholar]
- 63. Gallos L.K., Song C., and Havlin S. et al.: ‘Scaling theory of transport in complex biological networks’, Proc. Natl. Acad. Sci., 2007, 104, (19), pp. 7746–7751 [DOI] [PMC free article] [PubMed] [Google Scholar]
- 64. Bullmore E., and Sporns O.: ‘Complex brain networks: graph theoretical analysis of structural and functional systems’, Nat. Rev. Neurosci., 2009, 10, (3), pp. 186–198 [DOI] [PubMed] [Google Scholar]
- 65. Noort V.V., Snel B., and Huynen M.A.: ‘The yeast coexpression network has a small‐world, scale‐free architecture and can be explained by a simple model’, EMBO Rep., 2004, 5, (3), pp. 280–284 [DOI] [PMC free article] [PubMed] [Google Scholar]
- 66. Barthelemy M.: ‘Betweenness centrality in large complex networks’, Eur. Phys. J. B, 2004, 38, (2), pp. 163–168 [Google Scholar]
- 67. White D.R., and Borgatti S.P.: ‘Betweenness centrality measures for directed graphs’, Soc. Networks., 1994, 16, (4), pp. 335–346 [Google Scholar]
- 68. Joy M.P., Brock A., and Ingber D.E. et al.: ‘High‐betweenness proteins in the yeast protein interaction network’, BioMed Res. Int., 2005, 2005, (2), pp. 96–103 [DOI] [PMC free article] [PubMed] [Google Scholar]
- 69. Jordán F., Benedek Z., and Podani J.: ‘Quantifying positional importance in food webs: a comparison of centrality indices’, Ecol. Modell, 2007, 205, (1–2), pp. 270–275 [Google Scholar]
- 70. Shah P.P.: ‘Network destruction: the structural implications of downsizing’, Acad. Manage. J., 2000, 43, (1), pp. 101–112 [Google Scholar]
- 71. Brauer W., and Reisig W.: ‘Carl Adam Petri and “Petri nets”’, in Gelenbe E., and Kahane J.P. (Eds.): ‘Fundamental concepts in computer science’ (Imperial College Press, London, UK, 2009), pp. 129–139 [Google Scholar]
- 72. Polak M.E., Ung C.Y., and Masapust J. et al.: ‘Petri net computational modelling of Langerhans cell interferon regulatory factor network predicts their role in T cell activation’, Sci. Rep., 2017, 7, (1), p. 668 [DOI] [PMC free article] [PubMed] [Google Scholar]
- 73. Livigni A., O'Hara L., and Polak M.E. et al.: ‘Petri net‐based graphical and computational modelling of biological systems’ (bioRxiv, United States, 2016), p. 047043 [Google Scholar]
- 74. Rżosińska K., Formanowicz D., and Formanowicz P.: ‘The study of the influence of micro‐environmental signals on macrophage differentiation using a quantitative Petri net based model’, Arch. Control Sci., 2017, 27, (2), pp. 331–349 [Google Scholar]
- 75. Formanowicz D., Radom M., and Zawierucha P. et al.: ‘Petri net‐based approach to modeling and analysis of selected aspects of the molecular regulation of angiogenesis’, PloS one, 2017, 12, (3), p. e0173020 [DOI] [PMC free article] [PubMed] [Google Scholar]
- 76. Scheidel J., Lindauer K., and Ackermann J. et al.: ‘Quasi‐steady‐state analysis based on structural modules and timed Petri net predict system's dynamics: the life cycle of the insulin receptor’, Metabolites, 2015, 5, (4), pp. 766–793 [DOI] [PMC free article] [PubMed] [Google Scholar]
- 77. Oyelade O.J., Isewon I., and Mba‐Kalu S. et al.: ‘Simulation and analysis of pentose phosphate pathway in plasmodium falciparum using colored Petri nets model’, J. Comput. Sci. Appl., 2015, 22, (2), pp. 115–125 [Google Scholar]
- 78. Bibi Z., Ahmad J., and Paracha R.Z. et al.: ‘Modeling and analysis of the signaling crosstalk of PI3K, AMPK and MAPK with timed hybrid Petri nets approach’. 2017 17th Int. Conf. on Computational Science and Its Applications (ICCSA), Italy, 2017, pp. 1–7 [Google Scholar]
- 79. Sheikh I.A., Ahmad J., and Saeed M.T.: ‘Modelling and simulation of biological regulatory networks by stochastic Petri nets’. Proc. of the World Congress on Engineering and Computer Science, San Francisco, USA, 2016, vol. 2 [Google Scholar]
- 80. David R., and Alla H.: ‘Discrete, continuous, and hybrid Petri nets’, vol. 1, (Springer, Heidelberg, 2005) [Google Scholar]
- 81. Valk R.: ‘On the two worlds of Carl Adam Petri's nets’, in Reisig W., and Rozenberg G. (Eds.): ‘Carl Adam Petri: ideas, personality, impact’ (Springer Nature, Switzerland AG, 2019), pp. 37–44 [Google Scholar]
- 82. Reisig W., and Rozenberg G.: ‘Lectures on Petri nets I: basic models: advances in Petri nets’ (Springer Science … Business Media, Heidelberg, 1998) [Google Scholar]
- 83. Blätke M.A., Heiner M., and Marwan W.: ‘Petri nets in systems biology’. Technical report, Otto‐von‐Guericke University Magdeburg, 2011. [Google Scholar]
- 84. Niarakis A., and Thieffry D.: ‘Logical modelling of cellular networks’, 2018.
- 85. Heiner M., Gilbert D., and Donaldson R.: ‘Petri nets for systems and synthetic biology’. Int. School on Formal Methods for the Design of Computer, Communication and Software Systems, Bertinoro, Italy, 2008, pp. 215–264 [Google Scholar]
- 86. Livigni A., O'Hara L., and Polak M.E. et al.: ‘A graphical and computational modeling platform for biological pathways’, Nat. Protoc., 2018, 13, (4), pp. 705–722 [DOI] [PubMed] [Google Scholar]
- 87. Zhang R.: ‘The ANGPTL3‐4‐8 model, a molecular mechanism for triglyceride trafficking’, Open Biol., 2016, 6, (4), p. 150272 [DOI] [PMC free article] [PubMed] [Google Scholar]
- 88. Ahmad J.: ‘Modélisation hybride et analyse des dynamiques des réseaux de régulations biologiques en tenant compte des délais’. PhD thesis, Nantes, 2009. [Google Scholar]
- 89. Shannon P., Markiel A., and Ozier O. et al.: ‘Cytoscape: a software environment for integrated models of biomolecular interaction networks’, Genome Res., 2003, 13, (11), pp. 2498–2504 [DOI] [PMC free article] [PubMed] [Google Scholar]
- 90. Samuel V.T., and Shulman G.I.: ‘Mechanisms for insulin resistance: common threads and missing links’, Cell, 2012, 148, (5), pp. 852–871 [DOI] [PMC free article] [PubMed] [Google Scholar]
- 91. Kahn S.E., Hull R.L., and Utzschneider K.M.: ‘Mechanisms linking obesity to insulin resistance and type 2 diabetes’, Nature, 2006, 444, (7121), pp. 840–846 [DOI] [PubMed] [Google Scholar]
- 92. Abdallah E.B., Folschette M., and Roux O. et al.: ‘Exhaustive analysis of dynamical properties of biological regulatory networks with answer set programming’. 2015 IEEE Int. Conf. on Bioinformatics and Biomedicine (BIBM), Washington DC,USA, 2015, pp. 281–285 [Google Scholar]
- 93. Paulevé L.: ‘Pint: a static analyzer for transient dynamics of qualitative networks with IPython interface’. Int. Conf. on Computational Methods in Systems Biology, Darmstadt, Germany, 2017, pp. 309–316 [Google Scholar]
- 94. Franzke A.: ‘Charlie 2.0‐a multi‐threaded petri net analyzer’, Brandenburg University of Technology Cottbus, 2009. [Google Scholar]
- 95. David R., and Alla H.: ‘Discrete, continuous, and hybrid Petri nets’, IEEE Control Syst., 2008, 28, (3), pp. 81–84 [Google Scholar]
- 96. Minervini G., Panizzoni E., and Giollo M. et al.: ‘Design and analysis of a Petri net model of the Von Hippel‐Lindau (VHL) tumor suppressor interaction network’, PloS One, 2014, 9, (6), p. e96986 [DOI] [PMC free article] [PubMed] [Google Scholar]
- 97. Heiner M., Koch I., and Will J.: ‘Model validation of biological pathways using Petri nets – demonstrated for apoptosis’, Biosystems, 2004, 75, (1–3), pp. 15–28 [DOI] [PubMed] [Google Scholar]
- 98. Wang Y., Viscarra J., and Kim S.‐J. et al.: ‘Transcriptional regulation of hepatic lipogenesis’, Nat. Rev. Mol. Cell Biol., 2015, 16, (11), pp. 678–689 [DOI] [PMC free article] [PubMed] [Google Scholar]
- 99. Li S., Brown M.S., and Goldstein J.L.: ‘Bifurcation of insulin signaling pathway in rat liver: mTORC1 required for stimulation of lipogenesis, but not inhibition of gluconeogenesis’, Proc. Natl. Acad. Sci., 2010, 107, (8), pp. 3441–3446 [DOI] [PMC free article] [PubMed] [Google Scholar]
- 100. Cantley L.C.: ‘The phosphoinositide 3‐kinase pathway’, Science, 2002, 296, (5573), pp. 1655–1657 [DOI] [PubMed] [Google Scholar]
- 101. Guo S.: ‘Insulin signaling, resistance, and metabolic syndrome: insights from mouse models into disease mechanisms’, J. Endocrinol., 2014, 220, (2), pp. T1–T23 [DOI] [PMC free article] [PubMed] [Google Scholar]
- 102. Perry R.J., Samuel V.T., and Petersen K.F. et al.: ‘The role of hepatic lipids in hepatic insulin resistance and type 2 diabetes’, Nature, 2014, 510, (7503), pp. 84–91 [DOI] [PMC free article] [PubMed] [Google Scholar]
- 103. Siddiqa A., Ahmad J., and Paracha R.Z. et al.: ‘Identification of key genes and pathways involved in compensatory pancreatic beta cell hyperplasia during insulin resistance’. 13th Int. Conf. on Natural Computation, Fuzzy Systems and Knowledge Discovery (ICNC‐FSKD), China, 2017. [Google Scholar]
- 104. Bedell M.A., Jenkins N.A., and Copeland N.G.: ‘Mouse models of human disease. Part I: techniques and resources for genetic analysis in mice’, Genes Dev., 1997, 11, (1), pp. 1–10 [DOI] [PubMed] [Google Scholar]
- 105. Scheidel J., Giese H., and Schweizer B. et al.: ‘Isiknock: in silico knockouts in biochemical pathways’ (bioRxiv, UK, 2018), p. 313858 [Google Scholar]
- 106. Scheidel J., Amstein L., and Ackermann J. et al.: ‘In silico knockout studies of xenophagic capturing of salmonella’, PLoS Comput. Biol., 2016, 12, (12), p. e1005200 [DOI] [PMC free article] [PubMed] [Google Scholar]
- 107. Iizuka K., and Horikawa Y.: ‘ChREBP: a glucose‐activated transcription factor involved in the development of metabolic syndrome’, Endocr. J., 2008, 55, (4), pp. 617–624 [DOI] [PubMed] [Google Scholar]