

Abstract
Prediction of drug synergy score is an ill‐posed problem. It plays an efficient role in the medical field for inhibiting specific cancer agents. An efficient regression‐based machine learning technique has an ability to minimise the drug synergy prediction errors. Therefore, in this study, an efficient machine learning technique for drug synergy prediction technique is designed by using ensemble based differential evolution (DE) for optimising the support vector machine (SVM). Because the tuning of the attributes of SVM kernel regulates the prediction precision. The ensemble based DE employs two trial vector generation techniques and two control attributes settings. The initial generation technique has the best solution and the other is without the best solution. The proposed and existing competitive machine learning techniques are applied to drug synergy data. The extensive analysis demonstrates that the proposed technique outperforms others in terms of accuracy, root mean square error and coefficient of correlation.
Inspec keywords: cancer, evolutionary computation, support vector machines, regression analysis, drugs, learning (artificial intelligence), medical computing
Other keywords: ensemble based differential evolution, specific cancer agents, efficient regression‐based machine learning technique, drug synergy prediction errors, efficient machine learning technique, drug synergy prediction technique, support vector machine, prediction precision, trial vector generation techniques, initial generation technique, drug synergy data, drug synergy score prediction, medical field, SVM kernel attributes, ensemble based DE, control attribute settings, competitive machine learning techniques, root mean square error
1 Introduction
Rational design of multi‐targeted drug combinations is an efficient way to handle the drug resistance issue for several complex disorders [1, 2]. A combination of drug is generally decomposed into synergistic, antagonistic and additive based upon the deviation of the evaluated combination response from the probable effect computed using a reference technique of non‐interaction [3–5]. The majority of standard reference techniques were designed for low‐throughput drug combination analysis that make the technique expectations frequently unsuited with the complex drug interaction patterns across several dose pairs [6–8]. These dose pairs are computed in large‐scale dose–response matrix analysis [9].
To compute the interaction between different drugs, the experiential combination response is generally compared to the probable effect under the hypothesis of non‐interaction estimated by a reference technique [10, 11]. In case, the combination response is more than as expected, then the combinations are recognised as synergistic [12]. The antagonism is considered when the combination evaluated is less as compared to expected effect and if there is no change in combination response with respect to expected, then it is additive [13, 14].
There are several recent studies on drug sensitivity and anti‐cancer drug response prediction [15, 16]. In [17], random forest (RF) regression technique was used for obtaining a single drug or a group of drugs for certain cancer. Zhang et al. [18] proposed a technique with cell line similarity network and drug similarity network data to predict anti‐cancer drug responses of a given cell line by using dual‐layer integrated cell line–drug network. To predict drug activity, Turki and Wei [19] propose a novel technique that uses link prediction algorithms and compared their results with existing drug sensitivity prediction techniques. Based on their experimental results, link prediction algorithms perform better than the methods used in the comparison. Multi‐task learning schemes have come into prominence as a consequence of their capability of exploiting inter‐drug relationships during training. While multi‐task learning for the drug activity prediction was largely limited to regularised linear techniques earlier, recently more sophisticated techniques have emerged [20]. A technique called kernelised Bayesian multi‐task learning [21] relying on kernel‐based dimension reduction and this multi‐task learning demonstrated notable performance for drug response prediction. In 2016, Tan [22] has shown that the trace‐norm regularised multi‐task learning followed by a kernel transform of the input gene expression data is superior to several other methods proposed for this task. A similar work by Yuan et al. [23], also demonstrates the improved predictive power of multi‐task learning with trace‐norm regularisation. In another study [24], the authors premeditate that the similar drugs should possess similar responses and define drug‐similarity by Pearson correlation of drug responses. This is followed by application of a novel method called similarity‐regularised matrix factorisation which maps drugs and cell lines to a lower‐dimensional space and reconstruct the drug response matrix in this latent space. The usage of ensemble methods was also found promising in drug response prediction task, as in many other problems. These low‐variance techniques surpassed all other schemes in a recent dream challenge on predicting human responses to toxic compounds [25]. Winners of both sub‐tasks utilised ensemble of RF techniques where each forest was devoted to a single cluster of cell lines [26]. In addition to ensemble learning, biologically‐plausible preprocessing techniques such as filtrating irrelevant genetic features, clustering cell lines and chemical using external datasets were found to be efficient strategies. None of these methods consider using both multi‐task and single‐task methods together in an ensemble technique [27, 28].
Our contributions in this paper can be summarised as follows. First, we propose to use an ensemble based differential evolution (DE) to predict drug synergy by using support vector machine (SVM). Second, we apply the proposed technique to test drug synergy dataset. Afterwards, 10‐fold cross‐validation is also considered to prevent the over‐fitting issue. The proposed technique is compared with five competitive techniques on drug synergy data by considering different performance metrics.
The remaining paper is organised as follows: Section 2 describes the SVM for regression and conventional DE. Various operators under conventional DE such as mutation, recombination and selection are explained. The proposed ensemble based DE technique is discussed in Section 3. Experimental setup, dataset description, results, comparative analysis and discussions are demonstrated in Section 4. The concluding remarks and acknowledgment are given in Sections 5 and 6.
2 Mathematical preliminaries
2.1 SVM for regression
SVM is extensively utilised to explore small samples under statistical learning rules [29]. The sample dataset is defined as . Here denotes the input parameters. represents the output parameters [30].
The SVM search for one misalignment mapping from the input space to the output space . By using this mapping, data is mapped to a feature space , and linear regression is carried out in as [31]
| (1) |
Here is a threshold value in (1). The SVM determines the regression equation by using the objective function minimisation as
| (2) |
Here is used to balance the complex items of the SVM and training error. The relaxation factors are denoted by and . represents insensitive loss function. is evaluated by
| (3) |
By normalising (2), lag range factors (i.e. , ) can be evaluated. Therefore, the regression coefficient is computed as
| (4) |
The SVM regression equation is obtained as
| (5) |
Here represents SVM kernel function. Kernel function parameter and penalty factor () evaluate the performance of SVM. estimates the complexity of the solution. estimates the penalty to the large fitting deviation. However, a large value of may cause over‐fitting. Also, the too small value of causes under‐fitting issue. Therefore, an efficient tuning of these attributes can improve the performance of SVM.
2.2 Conventional DE
DE is a well‐known meta‐heuristic technique. It is a simple, robust and effective global optimisation technique. From the literature, DE has shown better performance as compared to existing meta‐heuristic technique in terms of robustness and convergence speed over many real‐world applications [32–35].
DE utilises mutation, recombination and selection operators to optimise a given problem. Initially, randomly population is developed. Afterwards, mutation, recombination and selection operators are utilised to develop new solutions. The selection operator is then utilised to evaluate the best trial vector for the next generation [36].
DE starts with a population of ‐dimensional candidate solutions which may be represented as
| (6) |
Here j represents the solution of the population. shows the current generation. represents the dimension of the population.
Initial population tries to cover the entire search space and constrained by minimum bound as
| (7) |
Also, the initial population is constrained using maximum bound as
| (8) |
Therefore, the initial population can be represented as
| (9) |
Here represents a uniformly distributed random variable [36, 37].
2.2.1 Mutation
After initialisation, mutation operation [38] is used for computing a trial vector as
| (10) |
The can be computed using various mutation techniques such as [35, 39]
| (11) |
| (12) |
| (13) |
| (14) |
| (15) |
| (16) |
Here , , , , represent mutually exclusive indices [39, 40]. F shows the mutation scale factor that controls the amplification of DE [36].
2.2.2 Recombination
After applying the mutation process, the recombination operator is utilised to maximise the diversity of target vectors. The recombination operation is implemented as
| (17) |
Equation (17) is utilised to develop a trial vector as
| (18) |
Therefore, a new trial vector is evaluated as
| (19) |
Here shows the recombination constant. is a randomly chosen index that ensures will differ from by at least one parameter.
2.2.3 Selection
In case exceeds the upper or lower bounds, then it is randomly re‐initiated within the search range. The fitness values of all trail vectors are then computed as
| (20) |
In case, if provides a better fitness as compared to , then will be replaced with and proceeds for next generation; continue otherwise.
3 Proposed technique
3.1 Ensemble mutation operator based DE
The performance of DE depends upon a mutation and recombination operators. In this paper, mutation operators are then divided into two types (i.e. and ). The is with the best solution in (11)–(13), and the is without best solution including (14)–(16) (Algorithm 1 (see Fig. 1)). To balance the diversity of the population and the convergence speed, the proposed technique considers two mutation operators. The first one is obtained from , and the second one is obtained from . Two mutation operators are randomly selected from and , respectively, as shown in Fig. 2.
Fig. 1.

Ensemble based DE based drug synergy prediction
Fig. 2.

Ensemble based mutation
In this research work, accuracy (A) and correlation coefficient (CC) are used to evaluate the fitness of each solution as follows:
| (21) |
Ensemble based DE uses adaptive and . The mutation technique and the attributes of are self‐adapted based upon their previous performance. The proposed technique decomposes mutation into two types. The first one provides the best population and the other does not have. During evolution, the proposed technique selects two techniques from these types in a random fashion. Therefore, the ensemble based DE outperforms existing variants of DE.
3.2 Drug synergy prediction using ensemble based DE
This section describes various steps which are required to be implemented to evaluate the drug synergy score in an efficient manner. These steps are briefly discussed in the succeeding section.
Parameter selection: In order to achieve the proposed technique, RBF kernel function of SVM is considered for regression as it demands only two attributes. These attributes will be optimised using the proposed ensemble based DE.
- Scaling: It is utilised is to avoid features in maximum numeric ranges dominating those with minimum numeric ranges. It also reduces the computational complexity for machine learning techniques [41]. In this paper, we have scaled the numeric attributes between either [–1, 1] or [0, 1] as
Here v represents the original value. is a scaled value. and represent the upper and lower bounds of feature values, respectively.(22) Training and testing data: The synergistic data obtained from [42] is decomposed into training and testing data. The training data is used to train the proposed SVM based machine learning technique. Afterwards, testing data is used to monitor the effectiveness of the proposed technique.
Ensemble based DE: The ensemble based DE is used to tune the required attributes of SVM. The root mean squared error (RMSE) is used as a fitness function. The overall objective is to find optimal parameters for SVM based drug synergy prediction technique.
Stopping criteria: When the stopping criteria achieved, the ensemble based DE terminates itself and return tuned attributes; otherwise, continues for the next iterations of ensemble based DE.
Technique building: The results obtained from ensemble based DE are used as initial attributes of the SVM technique. It is then utilised to build the trained SVM based drug synergy prediction technique.
Performance analysis: In this step, trained technique obtained using ensemble based DE. SVM is applied to the training data to predict the drug synergy values. Afterwards, these values are used to evaluate the performance of the proposed machine learning technique.
4 Methodology
This section describes the experimental setup, used dataset and experimental analysis of existing and proposed machine learning techniques for drug synergy prediction.
4.1 Experimental setup
The proposed and other methods are implemented on Intel core i 7 processor with 16 GB RAM. The simulation environment is designed using MATLAB 2017a software with the help of the matplotlib library. the The description of used datasets (i.e. AstraZeneca‐Sanger Drug Combination [42]) along with its features are discussed in the succeeding section.
4.2 Dataset
The drug effects on cells are measured at different concentrations can also be performed with drug combinations. In the presence of two drugs, the concentration space are increased by one‐dimension and the induced effect are described by a dose–response surface rather than a curve as shown in Fig. 3. A dose–response surface generally given in Table 1.
Fig. 3.

Dose response surface
Table 1.
Dataset features
| Column name | Description |
|---|---|
| CELL_LINE | normalised cell line name |
| COMPOUND_A | name of drug/compound A described by its target |
| COMPOUND_B | name of drug/compound B described by its target |
| MAX_CONC_A | maximum concentration (uM) of drug A |
| MAX_CONC_B | maximum concentration (uM) of drug B |
| IC50_A | concentration where half of the maximum kill is obtained with drug A |
| h_A | slope of the dose‐response curve for drug A |
| einf_A(Potency) | maximum cells killed (percentage) with drug A |
| IC50_B | concentration where half of the maximum kill is obtained with drug B |
| h_B | slope of the dose‐response curve for drug B |
| einf_B | maximum cells killed (percentage) with drug B |
| SYNERGY_SCORE | estimated total synergy between drug A and drug B in combination |
| QA | quality assurance (assessment) flag of combination assays |
| COMBINATION_ID | name for drug A and drug B combination |
The benefit of a drug combination are partly assessed in terms of the amount of ‘extra‐effect’ (i.e. obtained when combining the drugs). Thus effects can be decomposed as follows:
| (23) |
is the observed effect. is what is often termed the ‘additive’ effect, i.e. a baseline effect which should be obtained when the combination does not amplify or reduce the killing of cells [43]. is the amount of extra‐effect, also termed synergistic effect (when this extra‐effect is negative, it is termed antagonistic). To identify synergy or antagonism, an additive effect is first derived based on single agent dose–response curves [44]. This is done here by using the Loewe technique [44, 45]. The Loewe technique relies on the isobole equation which was solved numerically for all drug concentration values in order to calculate and then derive . The resulting procedure can be visualised graphically as shown in Fig. 4.
Fig. 4.
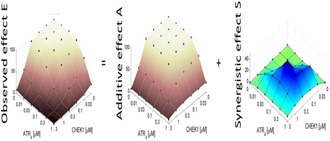
Evaluated dose response surface for E(a,b), A(a,b) and S(a,b)
Once the synergy distribution is obtained, it is summarised via unique score number which we called total‐synergy.
The synergy score data, which is used in this research work for validation purpose contain two terms, i.e. (a) maximum concentration (uM) of drug A and (b) maximum concentration (uM) of drug B. Therefore, the significance of synergy score data depends upon the different concentration of different drugs. Therefore, the proposed machine learning technique is implemented on the train data set containing the different concentration of different drugs to predict the synergy score [42]. The different concentration of different drugs is evaluated using the coefficient of drug interaction (CDI). It is evaluated as follows:
| (24) |
Here AB is the ratio of the 2‐drug combination group to the control group and A or B is the ratio of the single drug group to the control group. The indicates the synergism, especially indicates a significantly synergistic effect, indicates the additivity and indicates the antagonism.
Subsequent sections describe the experimental results of proposed and other techniques when they are applied to drug synergy score data [42].
4.3 Results
In this research work, ten‐fold cross‐validation is used to test the proposed ensemble based DE during the training phase to evaluate overfitting issue. To achieve ten‐fold cross‐validation, initially, training data is divided into ten equal subsets (fold). Keep the one fold as validation set and keep other nine folds in the cross‐validation training set. Train the proposed technique using the cross‐validation training set and evaluate the accuracy of the proposed technique by validating the predicted values against the validation set. Similarly, the accuracy of all ten folds has been evaluated. To overcome the issue of overfitting, mean of calculated accuracies is evaluated. Each fold is utilised for validation just once. Therefore, ten‐fold cross‐validation guarantees that the proposed trained technique does not suffer from the overfitting issue.
4.3.1 Accuracy analysis
The accuracy is a performance metric of a machine learning technique that reflects the proportionate number of times that the developed technique is correct when implemented to data. In regression based machine learning techniques, accuracy depends upon a factor so‐called acceptance error . It allows us to accept the predicted data as accurate with some amount of error. Ae converts the difference between actual and predicted data to the binary form. In which some 1s determine the accuracy of data. In the same way, the number of 0s determines the error rate. The accuracy can be computed as follows:
| (25) |
Here N represents the total number of records in the predicted data. Also, a binary difference can be computed as follows:
| (26) |
Here and represented actual and predicted drug energy scores, respectively.
Thus, accuracy ranges from 0 to 100. The technique with accuracy techniques to 100 is more efficient compared with other techniques. In our experiment, we have taken .
Table 2 depicts the accuracy analysis of the proposed ensemble based machine learning technique with existing techniques such as linear model (LM), J48, SVM, neural network and RF. In Table 2, data is trained and tested on the same drug synergy score data by dividing it into training and testing data. It is observed that the proposed technique outperforms other machine learning techniques because the proposed technique has shown better accuracy compared to different techniques.
Table 2.
Comparative analysis of accuracy
| Dataset | 50% | 60% | 70% | 80% |
|---|---|---|---|---|
| LM | 89.6 ± 4.9 | 90.1 ± 4.9 | 92.4 ± 3.6 | 92.1 ± 4.1 |
| J48 | 88.3 ± 4.7 | 86.3 ± 4.4 | 87.9 ± ±4.5 | 89.2 ± 3.4 |
| SVM | 90.5 ± 3.7 | 91.3 ± 3.1 | 90.3 ± 3.9 | 91.3 ± 3.4 |
| NN | 87.2 ± 5.4 | 86.2 ± 4.8 | 87.2 ± 4.9 | 90.1 ± 4.7 |
| RF | 91.2 ± 4.1 | 90.9 ± 4.1 | 90.1 ± 3.4 | 90.1 ± 3.1 |
| proposed | 94.1 ± 2.8 | 93.6 ± 2.7 | 94.4 ± 2.1 | 95.7 ± 2.1 |
4.3.2 RMSE analysis
RMSE is a measure of the differences between actual and predicted values. RMSE denotes the standard deviation of the error between predicted and actual values the so‐called residuals or prediction errors.
The RMSE of predicted values for attributes t of a regression's dependent attribute is evaluated for n different predictions as follows:
| (27) |
Table 3 shows the comparison of RMSE analysis between the proposed and other machine learning techniques. It depicts that the proposed technique outperforms others because it has lesser RMSE as compared to others. In Table 3, data is trained and tested on the same drug synergy score data by dividing it into training and testing data. It is observed that if we increase the size of training data, i.e. from 40 to 80% even then proposed technique outperforms others. Therefore, the proposed technique has more realistic results as compared to other machine learning techniques.
Table 3.
Comparative analysis of RMSE
| Dataset | 50% | 60% | 70% | 80% |
|---|---|---|---|---|
| LM | 13.89 ± 2.6 | 14.21 ± 2.6 | 13.56 ± 3.1 | 13.82 ± 2.7 |
| J48 | 13.41 ± 3.4 | 14.97 ± 3.1 | 14.53 ± 3.1 | 13.56 ± 2.9 |
| SVM | 14.04 ± 2.8 | 14.01 ± 3.6 | 13.88 ± 3.3 | 14.08 ± 2.9 |
| NN | 14.99 ± 3.1 | 15.21 ± 3.1 | 14.98 ± 3.4 | 14.34 ± 2.5 |
| RF | 13.79 ± 2.5 | 14.20 ± 2.6 | 13.47 ± 2.4 | 13.89 ± 2.6 |
| proposed | 12.42 ± 1.6 | 12.14 ± 1.5 | 11.64 ± 1.3 | 11.79 ± 1.4 |
4.3.3 Coefficient of correlation analysis
The coefficient of correlation so‐called Pearson correlation coefficient measures the degree of linear correlation between two attributes A and B. , where 1 is represented a positive linear correlation, 0 indicates no linear correlation and −1 represents negative linear correlation. Mathematically, r can be computed as follows:
| (28) |
Here represents covariance between A and B. shows the standard deviation of A and shows the standard deviation of B.
can be computed as follows:
| (29) |
Here and represent the mean of A and y, respectively. shows the expectation.
Now, r can be rewritten as follows:
| (30) |
Therefore, the formula for r can be represented in terms of uncentred moments. Since
| (31) |
| (32) |
| (33) |
| (34) |
| (35) |
Therefore, r can also be rewritten as follows:
| (36) |
Table 4 demonstrates the coefficient of correlation analysis between the proposed ensemble based machine learning technique with other techniques. It is observed that the proposed technique has a significant correlation coefficient than other machine learning techniques. It has also been observed that the proposed technique has better as well as more consistent results as compared to other techniques, as proposed techniques show minor variation than others.
Table 4.
Comparative analysis of coefficient of correlation
| Dataset | 50% | 60% | 70% | 80% |
|---|---|---|---|---|
| LM | 0.89 ± 0.06 | 0.89 ± 0.08 | 0.91 ± 0.04 | 0.87 ± 0.04 |
| J48 | 0.86 ± 0.07 | 0.84 ± 0.06 | 0.87 ± 0.06 | 0.91 ± 0.06 |
| SVM | 0.91 ± 0.08 | 0.90 ± 0.05 | 0.89 ± 0.07 | 0.91 ± 0.06 |
| NN | 0.85 ± 0.20 | 0.87 ± 0.09 | 0.89 ± 0.08 | 0.90 ± 0.07 |
| RF | 0.90 ± 0.06 | 0.91 ± 0.07 | 0.92 ± 0.08 | 0.90 ± 0.07 |
| proposed | 0.94 ± 0.04 | 0.93 ± 0.02 | 0.96 ± 0.02 | 0.95 ± 0.02 |
4.4 Discussion
In this paper, an ensemble DE has been designed to predict drug synergy by using the SVM. The proposed technique is tested on benchmark drug synergy dataset. The ten‐fold cross‐validation is utilised to prevent the over‐fitting issue. Additionally, all the features of the dataset are normalised between [0, 1], therefore, the proposed technique does not suffer from outliers issues. The comparison of the proposed technique has been drawn with five competitive prediction techniques on drug synergy data by considering various metrics such as accuracy, RMSE and coefficient of correlation. From the quantitative analysis, it has been observed that the proposed technique provides a significant improvement in terms of accuracy, RMSE and coefficient of correlation as compared to existing techniques. It is also found that the proposed technique does not suffer from parameter tuning and over/under fitting issues. The higher accuracy has indicated that the proposed technique is well‐suitable for real‐time drug synergy prediction systems.
5 Conclusion
In this paper, an ensemble based DE has been proposed to tune the attributes of SVM to predict drug synergy score in an efficient manner. Initially, the random population has been generated by considering the normal distribution with mean = 0 and variance = 1. Thereafter, the fitness of each solution has been evaluated. Based upon the fitness values, a ranking of the generated population has been done. Afterwards, the proposed mutation and recombination operators have been applied to obtain the final optimal solutions for SVM. The proposed technique has been evaluated on benchmark drug synergy score data and also compared with five well‐known competitive machine learning techniques. Extensive analyses have been carried out by varying the ratio of training and testing data. From experimental results, it has been observed that mean improvement of the proposed technique over existing machine learning techniques regarding accuracy, RMSE, and coefficient of correlation are 3.9271, 1.6974 and 1.6986%, respectively. Therefore, the proposed technique is more efficient for designing a real‐time drug synergy predictor.
6 Acknowledgment
This research was funded by DST‐SERB (Science and Engineering Research Board, Government of India) under the Scheme of ‘Early Career Research Scheme’ with File No: ECR /2015/000150/LS. Also, the authors gratefully acknowledge the support of NVIDIA Corporation with the donation of the Tesla K 40 GPU used for this research.
7 References
- 1. Madani Tonekaboni S.A. Soltan Ghoraie L., and Manem V.S.K. et al.: ‘Predictive approaches for drug combination discovery in cancer’, Briefings Bioinform., 2016, 19, (2), pp. 263–276 [DOI] [PMC free article] [PubMed] [Google Scholar]
- 2. Wu H. Dong J., and Wei J.: ‘Network‐based method for detecting dysregulated pathways in glioblastoma cancer’, IET Syst. Biol., 2018, 12, (1), pp. 39–44 [DOI] [PMC free article] [PubMed] [Google Scholar]
- 3. He L. Kulesskiy E., and Saarela J. et al.: ‘Methods for high‐throughput drug combination screening and synergy scoring’ in von Stechow L. (Ed.): ‘Cancer systems biology’ (Humana Press, New York, USA, 2018), pp. 351–398 [DOI] [PMC free article] [PubMed] [Google Scholar]
- 4. Ashiq M.G.B. Saeed M.A., and Ibrahim N. et al.: ‘Numerical study of nanophotolysis approach for breast cancer’, Mod. Phys. Lett. B, 2012, 26, (28), p. 1250187 [Google Scholar]
- 5. Akutekwe A. Seker H., and Yang S.: ‘In silico discovery of significant pathways in colorectal cancer metastasis using a two‐stage optimisation approach’, IET Syst. Biol., 2015, 9, (6), pp. 294–302 [DOI] [PMC free article] [PubMed] [Google Scholar]
- 6. Ianevski A. He L., and Aittokallio T. et al.: ‘Synergyfinder: a web application for analyzing drug combination dose–response matrix data’, Bioinformatics, 2017, 33, (15), pp. 2413–2415 [DOI] [PMC free article] [PubMed] [Google Scholar]
- 7. Yang Z.‐K. Cheng C.‐C., and Wang Z. et al.: ‘Detection of breast cancer using ultra‐wide band beamforming algorithm’, Mod. Phys. Lett. B, 2017, 31, (09), p. 1750091 [Google Scholar]
- 8. Huang C.H. Wu M.Y., and Chang P.M.H. et al.: ‘In silico identification of potential targets and drugs for non‐small cell lung cancer’, IET Syst. Biol., 2014, 8, pp. 56–66 [DOI] [PMC free article] [PubMed] [Google Scholar]
- 9. Li X. Qin G., and Yang Q. et al.: ‘Biomolecular network‐based synergistic drug combination discovery’, BioMed Res. Int., 2016, 2016 [DOI] [PMC free article] [PubMed] [Google Scholar]
- 10. Tang J.: ‘Informatics approaches for predicting, understanding, and testing cancer drug combinations’ in Tan A., and Huang P.H. (Eds.): ‘Kinase signaling networks’ (Humana Press, New York, USA, 2017), pp. 485–506 [DOI] [PMC free article] [PubMed] [Google Scholar]
- 11. Wu Z. Wang Y., and Chen L.: ‘Drug repositioning framework by incorporating functional information’, IET Syst. Biol., 2013, 7, pp. 188–194 [DOI] [PMC free article] [PubMed] [Google Scholar]
- 12. Roemer T., and Boone C.: ‘Systems‐level antimicrobial drug and drug synergy discovery’, Nature Chem. Biol., 2013, 9, (4), p. 222 [DOI] [PubMed] [Google Scholar]
- 13. Yadav B. Wennerberg K., and Aittokallio T. et al.: ‘Searching for drug synergy in complex dose–response landscapes using an interaction potency model’, Comput. Struct. Biotechnol. J., 2015, 13, pp. 504–513 [DOI] [PMC free article] [PubMed] [Google Scholar]
- 14. Xie J. Zeng X., and Lu D. et al.: ‘Mhc2nnz: A novel peptide binding prediction approach for hla dq molecules’, Mod. Phys. Lett. B, 2017, 31, (19–21), p. 1740086 [Google Scholar]
- 15. Gurkan‐Cavusoglu E. Avadhani S., and Liu L. et al.: ‘Developing an in silico model of the modulation of base excision repair using methoxyamine for more targeted cancer therapeutics’, IET Syst. Biol., 2013, 7, pp. 27–37 [DOI] [PMC free article] [PubMed] [Google Scholar]
- 16. Singh H. Rana P.S., and Singh U.: ‘Prediction of drug synergy in cancer using ensemble‐based machine learning techniques’, Mod. Phys. Lett. B, 2018, 32, (11), p. 1850132 [Google Scholar]
- 17. Wan Q., and Pal R.: ‘An ensemble based top performing approach for nci‐dream drug sensitivity prediction challenge’, PLoS one, 2014, 9, (6), p. e101183 [DOI] [PMC free article] [PubMed] [Google Scholar]
- 18. Zhang N. Wang H., and Fang Y. et al.: ‘Predicting anticancer drug responses using a dual‐layer integrated cell line‐drug network model’, PLoS Comput. Biol., 2015, 11, (9), p. e1004498 [DOI] [PMC free article] [PubMed] [Google Scholar]
- 19. Turki T., and Wei Z.: ‘A link prediction approach to cancer drug sensitivity prediction’, BMC Syst. Biol., 2017, 11, (5), p. 94 [DOI] [PMC free article] [PubMed] [Google Scholar]
- 20. Wani N., and Raza K.: ‘Multiple kernel‐learning approach for medical image analysis’ in Dey N. Ahsour A., and Shi F. et al. (EDs.): ‘Soft computing based medical image analysis’ (Academic Press, London, UK, 2018), pp. 31–47 [Google Scholar]
- 21. Gönen M., and Margolin A.A.: ‘Drug susceptibility prediction against a panel of drugs using kernelized Bayesian multitask learning’, Bioinformatics, 2014, 30, (17), pp. i556–i563 [DOI] [PMC free article] [PubMed] [Google Scholar]
- 22. Tan M.: ‘Prediction of anti‐cancer drug response by kernelized multi‐task learning’, Artif. Intell. Med., 2016, 73, pp. 70–77 [DOI] [PubMed] [Google Scholar]
- 23. Yuan H. Paskov I., and Paskov H. et al.: ‘Multitask learning improves prediction of cancer drug sensitivity’, Sci. Rep., 2016, 6, p. 31619 [DOI] [PMC free article] [PubMed] [Google Scholar]
- 24. Wang L. Li X., and Zhang L. et al.: ‘Improved anticancer drug response prediction in cell lines using matrix factorization with similarity regularization’, BMC Cancer, 2017, 17, (1), p. 513 [DOI] [PMC free article] [PubMed] [Google Scholar]
- 25. Eduati F. Mangravite L.M., and Wang T. et al.: ‘Prediction of human population responses to toxic compounds by a collaborative competition’, Nat. Biotechnol., 2015, 633, (9), p. 933 [DOI] [PMC free article] [PubMed] [Google Scholar]
- 26. Raza K.: ‘Clustering analysis of cancerous microarray data’, J. Chem. Pharm. Res., 2014, 6, (9), pp. 488–493 [Google Scholar]
- 27. Brown C.C. Havener T.M., and Medina M.W. et al.: ‘Genome‐wide association and pharmacological profiling of 29 anticancer agents using lymphoblastoid cell lines’, Pharmacogenomics, 2014, 15, (2), pp. 137–146 [DOI] [PMC free article] [PubMed] [Google Scholar]
- 28. Raza K.: ‘Reconstruction, topological and gene ontology enrichment analysis of cancerous gene regulatory network modules’, Curr. Bioinform., 2016, 11, (2), pp. 243–258 [Google Scholar]
- 29. Vapnik V.: ‘The nature of statistical learning theory’ (Springer Science & Business Media, New York, USA, 2013) [Google Scholar]
- 30. Tang J.L. Cai C.Z., and Zhao S.: ‘Electrical power prediction of proton exchange membrane fuel cell by using support vector regression’, Mod. Phys. Lett. B, 2012, 26, (19), p. 1250121 [Google Scholar]
- 31. Cheng W.D. Cai C.Z., and Luo Y. et al.: ‘Mechanical properties prediction for carbon nanotubes/epoxy composites by using support vector regression’, Mod. Phys. Lett. B, 2015, 29, (05), p. 1550016 [Google Scholar]
- 32. Wang B. Liu S., and Liu J. et al.: ‘Advanced prediction for multiple disaster sources of laneway under complicated geological conditions’, Mining Sci. Technol., 2011, 21, (5), pp. 749–754 [Google Scholar]
- 33. Wang H. Wu Z., and Rahnamayan S.: ‘Enhanced opposition‐based differential evolution for solving high‐dimensional continuous optimization problems’, Soft Comput., 2011, 15, (11), pp. 2127–2140 [Google Scholar]
- 34. Wang Y. Cai Z., and Zhang Q.: ‘Differential evolution with composite trial vector generation strategies and control parameters’, IEEE Trans. Evol. Comput., 2011, 15, (1), pp. 55–66 [Google Scholar]
- 35. Yu X. Cai M., and Cao J.: ‘A novel mutation differential evolution for global optimization’, J. Int. Fuzzy Syst., 2015, 28, (3), pp. 1047–1060 [Google Scholar]
- 36. Sharma H. Bansal J.C., and Arya K.: ‘Fitness based differential evolution’, Memetic Comput., 2012, 4, (4), pp. 303–316 [Google Scholar]
- 37. Ali M., and Pant M.: ‘Improving the performance of differential evolution algorithm using Cauchy mutation’, Soft Comput., 2011, 15, (5), pp. 991–1007 [Google Scholar]
- 38. Raza K., and Parveen R.: ‘Evolutionary algorithms in genetic regulatory networks model’, J. Adv. Bioinform. Appl. Res. ISSN, 2012, 3, (1), pp. 271–280 [Google Scholar]
- 39. Qin A.K. Huang V.L., and Suganthan P.N.: ‘Differential evolution algorithm with strategy adaptation for global numerical optimization’, IEEE Trans. Evol. Comput., 2009, 13, (2), pp. 398–417 [Google Scholar]
- 40. Yu X.: ‘Disaster prediction model based on support vector machine for regression and improved differential evolution’, Nat. Hazards, 2017, 85, (2), pp. 959–976 [Google Scholar]
- 41. Raza K., and Hasan A.N.: ‘A comprehensive evaluation of machine learning techniques for cancer class prediction based on microarray data’, Int. J. Bioinform. Res. Appl., 2015, 11, (5), pp. 397–416 [DOI] [PubMed] [Google Scholar]
- 42.‘Astrazeneca‐sanger drug combination prediction dream challenge’, AstraZeneca‐Sanger Drug Combination Prediction DREAM Challenge, Synapse, 2015, (25), pp. 235671–235672
- 43. Jia J. Zhu F., and Ma X. et al.: ‘Mechanisms of drug combinations: interaction and network perspectives’, Nat. Rev. Drug Discovery, 2009, 8, (2), p. 111 [DOI] [PubMed] [Google Scholar]
- 44. Fitzgerald J.B. Schoeberl B., and Nielsen J.B. et al.: ‘Systems biology and combination therapy in the quest for clinical efficacy’, Nat. Chem. Biol., 2006, 2, (9), p. 458 [DOI] [PubMed] [Google Scholar]
- 45. Geary N.: ‘Understanding synergy’, Am. J. Physiol.‐Endocrinol. Metab., 2012, 304, (3), pp. E237–E253 [DOI] [PubMed] [Google Scholar]