Abstract
Streptomyces sp. with grey white mycelium was isolated from Kodiyakkarai marine segment of east coastal of India. The isolate produced spiny spores and did not produce any diffusible pigments. Various biochemical tests were carried out to confirm the isolate classification. The amylolytic enzyme activity was estimated using the isolated strain which was confirmed by golden yellowish zone formation after using the Gram's iodine stain. The amount of amylase produced by the isolate was 6.15 U/ml. Higher living cells always produce better enzymes, so that the process parameters especially pH was maintained in fermentation chamber for higher growth and also for large‐scale growth. For maintaining the pH a mathematical process model was developed using the data obtained during the process. The addition of Kalman's filter along with proportional–integral–derivative controller gave better stability in pH. By maintaining of pH 7, growth rate was significantly increased from 0.51to 0.59 gm/l on day 5 which are discussed in the results and discussions.
Inspec keywords: enzymes, pH control, fermentation, biochemistry, biological techniques
Other keywords: isolation, enzymatic activity, Streptomyces sp, pH control, fermentation process, grey white mycelium, Kodiyakkarai marine segment, east coastal India, diffusible pigments, biochemical tests, isolate classification, amylolytic enzyme activity, isolated strain, golden yellowish zone formation, Gram's iodine stain, fermentation chamber, mathematical process model, Kalman's filter, proportional–integral–derivative controller, pH 7
Nomenclature
- V
culture volume (l)
- F
feed flow rate of substrate (l/h)
acid/base flow rate (ml/h)
evaporative loss (l)
- X
biomass concentration (g/l/lg)
biomass inlet flow (l)
specific growth rate of biomass (h−1)
Arrhenius constant for cell death
hydrogen ion concentration (mol/l)
proportionality constant (mol H+/g biomass)
- T
time (s)
1. Introduction
Streptomyces sp. represent a ubiquitous set of microbes that are the greatest economically and biotechnologically valuable prokaryotes [1]. They are filamentous and sporulating microorganism with high G + C content of 73% and the behaviour of Streptomyces sp. consists of both bacteria and fungi [2]. Thus far, more than 80% of antibiotics have been produced by actinobacterias [3]. Apart from the antibiotics production, Streptomyces sp. also have the ability to produce and excrete a large variety of different enzymes [4, 5]. Among the different types of enzymes, amylase is one which have wide spectrum of applications in many fields [6] like starch industries for the hydrolysis of starch [7, 8] and other industries which includes food, baking, brewing, detergent, paper and textile industries [9, 10, 11]. Due to the significance of such bacteria, the production in large scale is an important task. For the large‐scale production we have chosen the fermentation chamber as the process unit. The mathematical modelling and control of process parameters are challenging task for researchers and it need to be resolved. The process parameters which mostly affect the growth rate of Streptomyces sp. in healthy manner is pH [12]. In this paper, the isolation of strain, characterisation based on biochemistry, analysing the activity of enzyme and implementing the required control strategy for pH control are proposed. Proportional–integral–derivative (PID) control with Kalman's filtering is a technique which is suitable for time‐varying functions [13]. Here the fermentation process is a time‐varying one, and the process will be operated continuously for 7 days. The mathematical model was developed for the overall process of the fermenter‐assisted growth rate of strain and for the pH profile.
2. Isolation, characterisation process modelling and controller design
2.1. Sample collection
Soil samples were collected from marine sediment of Kodiyakarai (latitude 10.77, longitude 79.83) east coast region of southern India. The samples were collected from 5 to 25 cm depth using sterile spatula and transfer it into the sterile plastic bags. The samples were air dried at room temperature for 1 week and are used for Streptomyces sp. isolation.
2.2. Sample processing
The samples were allowed to various physical and chemical pre‐treatment methods in order to facilitate the isolation process of Streptomyces sp. The sediment samples were air dried and heated aseptically, which stimulate the isolation of Streptomyces sp. by eliminating most unwanted Gram‐negative bacteria. Appropriate selective media such as starch casein agar, Kuster's agar and antibiotics (nalidixic acid and cyclohexane) were used for growth promotion of Streptomyces sp. and also for the prevention of contamination, respectively.
2.3. Isolation and characterisation of Streptomyces sp.
Isolation and enumeration of Streptomyces sp. can be performed through serial dilution [14] and spread plate technique [15]. One gram of soil sample was suspended in 10 ml of sterile double distilled water. The dilution was carried out up to 10−5 dilution. 0.1 ml of aliquots from 10−2, 10−3, 10−4 and 10−5 were spread on the yeast‐malt extract agar medium. Nalidixic acid 100 mg/l and cyclohexane 20 mg/l were added to minimise the bacterial and fungal contamination and the plates were incubated at 30°C for 7 days. The various biochemical tests such as catalase test, citrate utilisation test, indole test, oxidase test, urease test, nitrate test, methyl red were performed to identify the isolate (see Supplementary information).
2.4. Culture condition
The pre‐germinated spore was inoculated into culture medium in 5 g glucose, 5 g yeast extract, 1 g KNO3, 1.0 g NaCl, 0.5 g K2HPO4, 0.5 g MgSO4 in 1 l distilled water for 7 days at 28°C and agitated at 220 rpm.
2.5. Assay of amylase enzyme activity
The activity of amylase enzyme was determined by using dinitrosalicyclic acid (DNS) method [16]. The reaction mixture contained 1 ml of 1% soluble starch and 1 ml of culture extract in sodium buffer (pH 7). The mixture was incubated at 35°C for 10 min. After incubation, 2 ml of DNS reagent was added to stop the reaction and then the mixture was boiled at 100°C for 10 min in boiling water bath. After that, the mixture was cooled at room temperature and the reaction mixture was diluted using 4 ml of distilled water. Then the absorbance was read at 540 nm by spectrophotometer. One unit of enzyme activity was defined as the amount of amylase required to catalyse the liberation of reducing sugar which is equivalent to 1 mM of reducing sugar glucose per minute under the assay condition [17]. After amylase enzyme confirmation, the guaze cloth was dipped 24 h in the 5 M sucrose aqueous solution and dried for 2 days. After that the dripped cloth was dipped for 1 h in the Streptomyces culture.
2.6. Optimisation studies for pH
By varying the pH of the medium, the optimised pH required for the efficient growth of the isolate was studied. The various pH values from pH 3 to pH 9 were adjusted using 0.1 M of NaOH and 0.1 M of HCl. The culture was inoculated into its suitable medium and incubated at 28°C for 7 days. After incubation, the absorbance was read at 570 nm using spectrophotometer to determine the efficient growth of the isolate. The pH was monitored online throughout the process.
2.7. Fermentation process
The isolated Streptomyces sp. was further moved to the fermenter (3 l working volume, LARK Make, India) for maintaining the process parameters. The process parameters, pH 7, temperature at 28°C, agitator speed at 225 rpm and dissolved oxygen at 0.3% were maintained at optimised condition which were obtained during the lab‐scale process. Here the pH is one of the most growth affecting parameter while comparing the others.
2.8. Modelling of the process
Modelling is a process which is used to convert the process into a simple mathematical representation. It is used for offline simulation and predicting the errors. A single cell is measured as a microscopic bio‐chemical dynamic. Metabolic activities are controlled both inside and outside of the cell. The cell growth in the bioreactor is defined as (in this study, most of the parameters and models have followed in the modified form of [18])
| (1) |
The mathematical expression is represented as
| (2) |
where r g is cell growth (g/dm3), μ is specific growth rate and x is cell concentration (g/dm3).
The most commonly used expression for the growth of microorganism is Monod's equation
| (3) |
where is maximum specific growth rate (S−1), K S is Monod constant and S is substrate concentration. The importance of K S is, when the substrate concentration is numerically equal to K S, then the growth rate is half of the maximum growth rate. In common, the cell growth
| (4) |
The common equation for the rate of substrate consumption for both cell growth and product formation is
| (5) |
where r s is substrate consumption. Since bioreactor is non‐linear process, automatic controllers were adjusted manually to set up the desired PID response pattern. However, control may be difficult when there is a long time lag between a change in a manipulated variable and its effect on the measured variable. This lag will lead to the cycling of the measured variable about the set point
| (6) |
| (7) |
| (8) |
The mathematical model for fermenter, biomass equation and effect of pH are represented by (6)–(8). These unstructured models are used prevalently because of their simplicity; whereas structured models attempt to describe the individual organisms in detail but are usually mathematically too complex to be used in controller design. Unstructured models usually consist of a few non‐linear ordinary differential equations and are particularly well suited for controller design.
2.9. Controller design
The controller which is suitable for time‐varying functions and for dedicated process is termed as optimum controller. The parameters obtained during the fermentation process (see nomenclature) are used to describe the transfer function of growth phase and stationary phase models by using (6)–(8). Based on the repeated experiments, measurements and observations, the growth phase model of the fermentation process with a delay of 0.1 s was derived
| (9) |
To evaluate the performance of the controller, three repeated experiments were conducted. The best optimal result is discussed. The stationary phase model for pH is also obtained based on the parameters observed during the experiments
| (10) |
The PID controller (11) was implemented along with the filter design (12) for (9) and (10). The general PID controller describes as follows:
| (11) |
The comparative analysis of the controller design with and without filter was performed for the pH stabilisation process. Equations (9) and (10) were approximated based on
| (12) |
where
For the normalisation of the fermentation process, we added the co‐efficient of numerator, and then divided both numerators and denominators by the added numerator co‐efficient value. The normalisation is a principle which is used to develop a system that is stable with respect to all kinds of changes and error.
3. Results and discussions
3.1. Isolation and characterisation of marine Streptomyces sp.
The isolated Streptomyces sp. were visualised by grey white aerial mycelium and brown substrate mycelium. The morphological character of the isolated strain was examined by bright field microscopy which reveals the isolated Streptomyces sp. was purple colour, rod shaped and filamentous Gram‐positive bacterium which was depicted in Fig. 1. The scanning electron microscopic topography (Fig. 2) of the isolate indicates the presence of substrate mycelia branched with filamentous hyphae and the cultural characterisation of the strain shows the higher growth in ISP1, ISP2, ISP3, ISP5, ISP6 but very poor growth in ISP4. The aerial mycelium was plentiful, well‐developed and showed variation from white to grey on all tested media. The substrate hyphae varied from yellowish‐white to yellowish‐brown. Diffusible greyish white pigments were produced on ISP 1, ISP 3 and ISP 6.0. The optimisation of the process parameters (Table 1) has been investigated and the maximum growth of the Streptomyces sp. exhibited at pH 7 and 25°C. Further biochemical characterisation such as indole, Methyl Red ‐ Voges Proskauer (MR‐VP), Simmon's citrate, triple sugar iron, catalase, starch hydrolysis, urease and nitrate has been performed to identify the potent isolates. Positive results were shown in Simmon's citrate, starch hydrolysis, urease and catalase. In Simmon's citrate test, the isolate utilises the sodium citrate as carbon source by metabolising citric acid to carbon dioxide that combines with sodium and water to produce alkaline carbonate and bicarbonate which was indicated by the colour change from green to blue. In starch hydrolysis, starch is cleaved into simple sugars by the enzyme (amylase) produced by the isolate in the presence of iodine which was visualised by the blue coloration of the medium. In urease test, the isolate secreted urease enzyme that produces ammonia which raises the pH of the medium that was confirmed by the presence of deep pink colour. In catalase test, the catalase breaks down the indicator H2O2 into water and oxygen in the presence of an enzyme catalase that leads to the formation of bubbles. From the above results based on the morphological, physiological, cultural and biochemical characterisation, the isolate was confirmed as Streptomyces sp. that was persistent with the previous report done by Antonieta Taddei et al. [19] who worked with the genus Streptomyces, morphological and biochemical data of Venezuelan isolates.
Fig. 1.
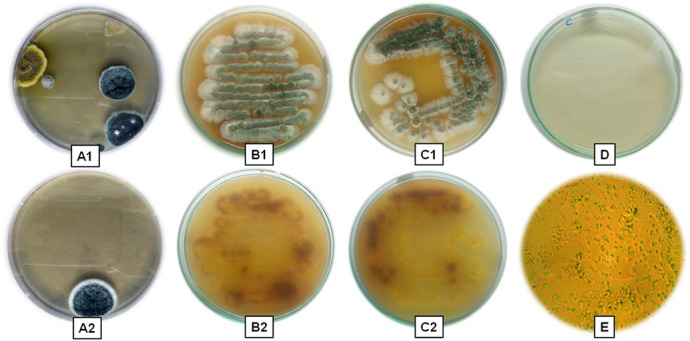
Isolate showing (A1) spread plate without antibiotic, (A2) spread plate with antibiotic,(B1) aerial mycelium (simple streak), (B2) substrate mycelium (simple streak), (C1) aerial mycelium(quardant streak), (C2) substrate mycelium (quardant streak), (D) control, (E) microscopic view ofthe strain
Fig. 2.
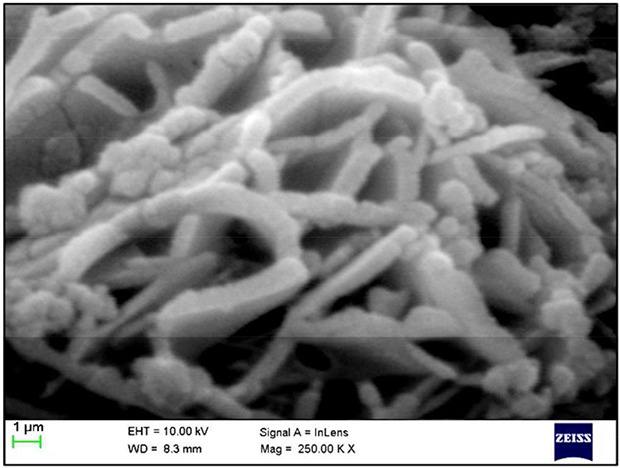
Morphological analysis using scanning electron microscopic analysis
Table 1.
Morphological and biochemical characterisation of Streptomyces sp.
| Characteristics | Results |
|---|---|
| morphological characterisation | |
| spore chains | spiral |
| spore mass | grey |
| spore surface | smooth |
| colour of aerial mycelium | white |
| colour of substrate mycelium | brown |
| motility | non‐motile |
| biochemical tests | |
| indole test | − |
| MR‐VP test | − |
| Simmon citrate agar test | + |
| nitrate test | − |
| starch hydrolysis test | + |
| gelatin test | − |
| urease test | + |
| triple sugar iron test | − |
| catalase test | + |
| casein hydrolysis | − |
| acid production from carbohydrates | |
| dextrose | ++ |
| fructose | ++ |
| inositol | − |
| lactose | + |
| maltose | + |
| mannitol | + |
| sucrose | + |
| xylose | − |
| growth at different pH | |
| 3 | − |
| 5 | + |
| 7 | +++ |
| 9 | + |
| growth at different temperature | |
| 15 | + |
| 20 | ++ |
| 25 | +++ |
| 35 | ++ |
| other conditions | |
| agitator speed | 220 rpm |
| dissolved oxygen | 0.3 gm/l |
| aeration | ∼6 psi |
| media volume | 2 l |
−, Negative reaction/no growth; +, positive reaction/moderate growth; ++, good growth; +++,optimised growth.
3.2. Enzymatic assays
Several enzymatic tests were performed for the isolated strain. Among them, the isolated Streptomyces sp. show positive result for amylase enzyme (Fig. 3) production, which was confirmed by golden yellowish zone formation after using the Gram's iodine stain. The amount of amylase produced by the isolate was 6.15 U/ml. Amylase enzymes are industrially important enzymes which hydrolyse starch into simple sugars. The results show that after 180 min, there was the maximum utilisation of starch by the strain. Fig. 3 shows the maximum utilisation of the starch. The most widespread applications of amylases are in the starch industry, which are used for starch hydrolysis in the starch liquefaction process that converts starch into fructose and glucose syrups. The enzymatic conversion of all starch includes: gelatinisation, which involves the dissolution of starch granules, thereby forming a viscous suspension; liquefaction, which involves partial hydrolysis and loss in viscosity; and saccharification, involving the production of glucose and maltose via further hydrolysis [20].
Fig. 3.
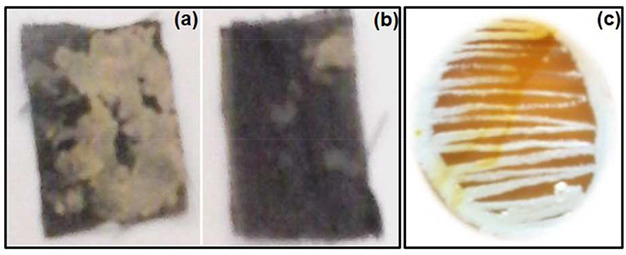
Starch utilisation analysis
(a) Before degradation, (b) Afterdegradation, (c) Starch utilisation analysis
3.3. pH optimisation and stabilisation
The parameter optimisation for pH (pH 3–9), temperature (15–45°C) and agitator speed (100–500 rpm) was analysed. Among them, the temperature and agitator speed will not affect the process at normal room temperature and normal speed condition. However, the growth is mostly affected by pH only. If we apply the pH 3 or pH 9 the growth rate is significantly decreased. The maximum growth of Streptomyces sp. can be achieved by maintaining it in an optimum pH during the lab‐scale analysis. Due to the nature of Streptomyces sp. in alkaline condition, the pH was maintained and controlled at the value of pH7.0 (Fig. 4b ) to attain higher growth rate during the fermentation process. The implementation of filtered controller design provided higher stability of pH which is shown in Fig. 4a and it was almost non‐oscillatory while comparing with the conventional PID controller.
Fig. 4.
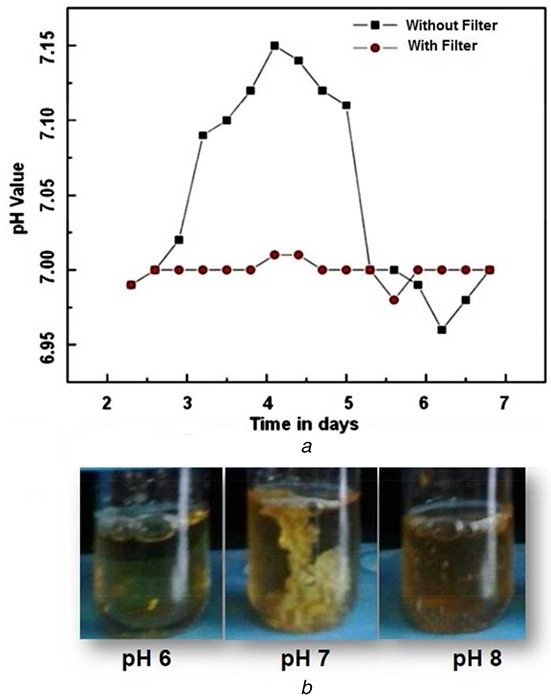
pH stabilisation analysis and optimisation analysis
(a) pH stabilisation analysis for without any control and PIDcontrol with Kalman's filtering, (b) pH optimisation analysis
3.4. Controller outputs
We reported the control of pH using PID with and without filter design. Without applying the control to the pH profile, the pH was continuously changed (Fig. 5) which lead to the uptake of acid and base. It increases the volume of culture and reduces the growth rate of Streptomyces sp. With the implementation of conventional PID control, the pH of the process is in control, but the factors like settling time and peak overshoot does not attain the desired level. However, by applying the various tuning parameters using Ziegler–Nichols tuning method, the oscillation was reduced, but the desired level was not received. To overcome these problems, we implemented the Kalman's filter design with the conventional PID controller to reduce the oscillation of acid/base addition and attained stabilisation of process parameter during the growth process. From Fig. 5, the modified PID controller gives reduced peak overshoot and quicker settling time. During fermentation, the phases of growth for the Streptomyces sp. was studied (Fig. 6) under UV–visible spectrometer at 570 nm with time interval varying from day 2 to day 7. On day 1, there was no growth observed. The phase change was clearly observed from lag (initial growth phase) to log phase on day 3 and day 4. The stationary phase was observed at day 5 where the growth was maintained constantly (no. of cells in lag phase = no. of cells in decline phase). Before and after implementation of the filter along with the controller gives notable increase in growth rate.
Fig. 5.
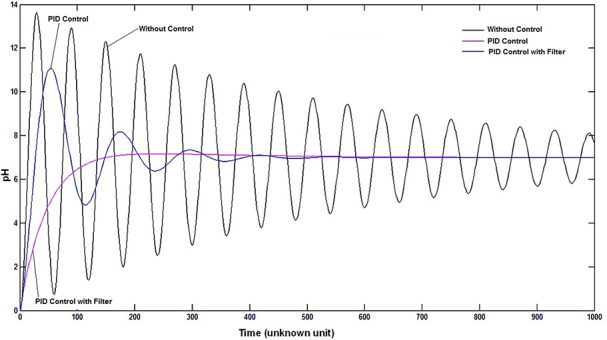
pH profile control with and without filter
Fig. 6.
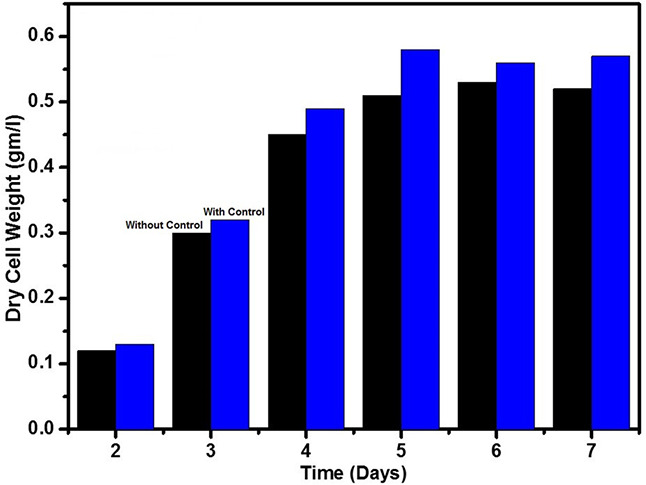
Growth rate analysis of Streptomyces sp.
4. Conclusion
The Streptomyces sp. strain was isolated from the red soil sample and various biochemical tests were performed for proper identification of genera of Streptomyces sp. Several enzymatic tests were performed for the isolated strain and it shows maximum starch utilisation. It confirmed that the strain can be utilised by the enzyme manufacturer and it can also be a possible source as idle amylolytic enzyme for different industrial purposes. After identification of the Streptomyces sp. it was transferred to the large‐scale manner, i.e. the fermentation process for attaining the higher product rate. By implementing modified control to the pH profile, it highly gets stabilised and also gives better growth rate compared with the conventional controller. The biomass increases from 0.51 to 0.59 gm/l while implementing the filtered controller.
Supporting information
Supplementary Data 1
5 References
- 1. Manivasagana, P. , Venkatesan, J. , Sivakumar, K. , et al.: ‘Marine actinobacterial metabolites: current status and future perspectives’, J. Microbiol. Res., 2013, 168, pp. 311–332, doi: 10.1016/j.micres.2013.02.002 [DOI] [PubMed] [Google Scholar]
- 2. Holt, J.G. : ‘Bergey's manual of determinative bacteriology’ (Williams & Wilkins, 1994, 9th edn.) [Google Scholar]
- 3. De Lima Procópio, R.E. , Da Silva, I.R. , Martins, M.K. , et al.: ‘Antibiotics produced by Streptomyces’, Braz. J. Infect. Dis., 2012, 16, (5), pp. 466–471, doi: 10.1016/j.bjid.2012.08.014 [DOI] [PubMed] [Google Scholar]
- 4. El‐Nagga, N.E. , El‐Ewasy, S.M. , El‐Shweihy, N.M. : ‘Microbial L‐asparaginase as a potential therapeutic agent for the treatment of acute lymphoblastic leukemia: the pros and cons. int.’, J. Pharmacol., 2014, 10, pp. 182–199, doi: 10.3923/ijp.2014.182.199 [Google Scholar]
- 5. Meena, B. , Anbu Rajan, L. , Vinithkumar, N.V. , et al.: ‘Novel marine actinobacteria from emerald Andaman & Nicobar Islands: a prospective source for industrial and pharmaceutical byproducts’, BMC Microbiol., 2013, 13, p. 145, doi: 10.1186/1471‐2180‐13‐145 [DOI] [PMC free article] [PubMed] [Google Scholar]
- 6. Tang‐um, J. , Niamsup, H. : ‘Extracellular amylase activity from endophytic streptomyces griseoflavus P4’, Chiang Mai J. Sci., 2012, 39, pp. 346–350 [Google Scholar]
- 7. Emmanuel, L. , Stephan, J. , Bernard, H. , et al.: ‘Thermophilic archeal amylolytic enzymes’, Enzyme Microb. Technol., 2000, 26, pp. 3–14 [Google Scholar]
- 8. Sarikaya, E. , Higassa, T. , Adachi, M. , et al.: ‘Comparison of degradation abilities of α and β amylases on raw starch granules’, Process. Biochem., 2000, 35, pp. 711–715 [Google Scholar]
- 9. Fogarty, W.M. , Kelly, C.J. : ‘Developments in microbial extracellular enzymes’, In Wiseman, A. (Eds.): ‘Topics in enzyme and fermentation biotechnology’ (Ellis Horwood Ltd. Publishers, England, 1979), vol. 3, p. 289 [Google Scholar]
- 10. Cheetham, P.S.J. : ‘Topics in enzyme and fermentation technology’ (Willey, New York, 1980), Ch. 6, vol. 4 [Google Scholar]
- 11. Macleod, A.M. : ‘The physiology of malting’, In Pollock, J.R.A. (Eds.): ‘Brewing science’ (Academic Press, London, 1979), vol. 1, pp. 46–232 [Google Scholar]
- 12. Le Mauxa, S. , Nongoniermaa, A.B. , Barrea, C. , et al.: ‘Enzymatic generation of whey protein hydrolysates under pH‐controlled and non pH‐controlled conditions: Impact on physicochemical and bioactive properties’, Food Chem., 2016, 199, pp. 246–251, doi: 10.1016/j.foodchem.2015.12.021 [DOI] [PubMed] [Google Scholar]
- 13. Zhao, L. , Wang, J. , Yu, T. , et al.: ‘Nonlinear state estimation for fermentation process using cubature Kalman filter to incorporate delayed measurements’, Chin. J. Chem. Eng., 2015, 23, pp. 1801–1810 [Google Scholar]
- 14. Thakur, D. , Yadav, A. , Gogoi, B.K. , et al.: ‘Isolation and screening of Streptomyces in soil of protected forest areas from the states of Assam and Tripura, India, for antimicrobial metabolites’, J. Mycol. Méd., 2007, 17, pp. 242–249 [Google Scholar]
- 15. Rajesh Muthu, M. , Subbaiya, R. , Balasubramanian, M. , et al.: ‘Isolation and identification of Actinomycetes Isoptericola variabilis from Cauvery River soil sample’, Int. J. Curr. Microbiol. Appl. Sci., 2013, 2, pp. 236–245 [Google Scholar]
- 16. Wood, I.P. , Elliston, A. , Ryden, P. , et al.: ‘Rapid quantification of reducing sugars in biomass hydrolysates: improving the speed and precision of the dinitrosalicylic acid assay’, Biomass Bioenergy, 2012, 44, pp. 117–121 [Google Scholar]
- 17. Keiji, T. , Hikaru, W. , Takuo, Y. , et al.: ‘Purification and characterization of highly branched α‐glucan‐producing enzymes from Paenibacillus sp. PP710’, Biosci. Biotechnol. Biochem., 2012, 76, pp. 721–731 [DOI] [PubMed] [Google Scholar]
- 18. Chen, H. : ‘Methods and algorithms for optimal control of fedbatch fermentation processes’. Master thesis, Cape Peninsula University of Technology, 2005. [Google Scholar]
- 19. Taddei, A. , Rodrıguez, M.J. , Marquez‐Vilchez, E. , et al.: ‘Isolation and identification of Streptomyces spp. from Venezuelan soils: morphological and biochemical studies. I.’, Microb. Res., 2006, 161, pp. 222–231 [DOI] [PubMed] [Google Scholar]
- 20. Aiyer, P.V. : ‘Amylases and their applications’, Afr. J. Biotechnol., 2005, 4, pp. 1525–1529 [Google Scholar]
Associated Data
This section collects any data citations, data availability statements, or supplementary materials included in this article.
Supplementary Materials
Supplementary Data 1


