Abstract
The authors investigated the regulatory network motifs and corresponding motif positions of cancer‐related genes. First, they mapped disease‐related genes to a transcription factor regulatory network. Next, they calculated statistically significant motifs and subsequently identified positions within these motifs that were enriched in cancer‐related genes. Potential mechanisms of these motifs and positions are discussed. These results could be used to identify other disease‐ and cancer‐related genes and could also suggest mechanisms for how these genes relate to co‐occurring diseases.
Inspec keywords: genetics, cancer
Other keywords: cancer‐related genes, cancer‐related motifs, human gene regulatory network, regulatory network motifs, motif positions, disease‐related genes, transcription factor regulatory network
1 Introduction
In the last decade, a series of efforts have been carried out to identify disease‐related genes, including many attempts to achieve disease biomarkers by computational methods [1, 2 ]. However, in recent years much focus has been placed on the study of gene regulatory or transcriptional networks with the goal of understanding how they evolve and function in disease progression. These studies include the creation of logical models, continuous models and single‐molecule methods (see [3 ] for a review). In addition, advances in the understanding of regulatory processes brought about by the Encyclopedia of DNA Elements project has allowed for in‐depth analyses of regulatory networks [4 ]. Other interesting work has involved the development of a Bayesian network model to measure the consistency of identified regulatory networks within gene expression profiles [5 ], which was subsequently used to study activated regulatory relationships in human lung epithelial cells after an H1N1 viral infection [6 ]. These types of global approaches are necessary to understand how the individual components function in concert to regulate gene expression. Many questions related to biological network organisation still remain. How do gene regulation networks manage to stay robust to genetic changes, some of which are deleterious or mutational in nature? How does an organism maintain fitness? Parallels between gene regulation networks and communication networks have been drawn, focusing on failure and attack tolerance in biological networks [7 ]. Wagner [8 ] discussed two main hypotheses on the mechanistic causes of robustness: redundancy and distributed robustness. He pointed out that while there is evidence that duplicate genes play an important role in an organism's tolerance to change, many systems, including metabolic and gene regulation networks, show no gene redundancy but are still able to tolerate the removal of highly connected nodes. Subsequently, the transcription factor (TF) co‐regulation network in yeast was shown to possess a distributed node degree distribution [9 ], which is thought to lend a level of robustness to the scale‐free gene regulation network. However, the same co‐regulation network architecture was not found in E. coli [10 ], which highlights the possibility that there are multiple pathways for achieving fitness. In 2007, Wagner and Wright [11 ] observed that many regulator–target gene pairs in more than a dozen biological networks had intermediate regulators between them. These ‘alternative routes’ could be a possible cause of robustness.
A TF regulatory network provides a map of interactions between regulating proteins and regulated genes. Within this network lie patterns of connections between them. These patterns, or motifs, give TFs a variety of tools for regulation depending on how much or how little of a protein product is needed at any given time or within a particular tissue. Having previously predicted DNA and RNA‐binding proteins [12 ] and examined the relationship between co‐regulating partners and their target genes (TGs) [13 ], we now take a closer look at how these TFs regulate their targets. We are also curious to know how disease‐related genes relate to the transcriptional regulatory network. Past analysis has shown that certain changes in transcriptional regulation can lead to disease phenotypes such as infertility [14 ], ocular diseases such as glaucoma [15 ], several developmental diseases, [16 ] and cancer [17 ]. One way to examine this problem is to identify the presence and location of disease genes in human TF network motifs. Do disease genes, specifically those that are cancer related, occur in some motifs more often than others? Are they regulated by common mechanisms in the TF network? Do cancer genes occupy a particular position within these motifs more often than other disease genes or non‐disease genes? What about for specific diseases such as breast, colon and lung cancer? This study attempts to address these questions.
2 Methods
Our procedure for identifying disease‐related genes in TF network motifs is described in Fig. 1. First, we assembled a list of 154 TFs and 3166 TGs with a total of 6883 interactions from the Transcriptional Regulatory Element Database (TRED, http://rulai.cshl.edu/TRED/, accessed January 2014) [18 ]. TRED is a collection of cis‐ and trans‐regulatory elements for mouse, rat and human. It also contains a curated list of 36 families of TFs and experimental evidence linking them to their TGs. The resulting directed network contained 3320 nodes and 6883 edges. Each node was involved in at least one regulatory interaction. The maximum number of TGs for a TF was 785 (C‐MYC). The maximum number of regulators for a single gene was 31 (CCND1). There were 71 root nodes in the network (corresponding to top‐tier regulators) and 36 mutual regulatory interactions. Although this network does not represent a comprehensive account of human TF/TG interactions, the proportion of TFs to TGs (5.2%) is very close to the previously reported value of 6% observed across 32 human tissues [19 ].
Fig 1.
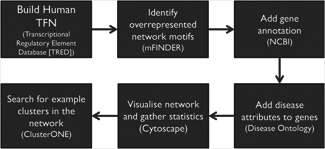
Illustration of our procedure for identifying disease‐related genes in TF network motifs
Second, we searched common motifs in the network using motif finder (mFinder) [20 ], a network‐centric algorithm capable of creating exhaustive subgraph lists. We identified statistically significant three‐node and four‐node motifs in the TF regulatory network. For three‐node motifs, we generated 1000 random networks for comparison. For four‐node motifs, we compared the real network to 100 random networks because of the computationally intensive calculation involved. The significance criteria for motifs in the real network were as follows: a Z ‐score >2.00 (i.e. the number of motifs in the real network must have been at least two standard deviations from the mean number of the same motif in random networks), a p ‐value of <0.010, an m ‐factor >1.10 and a uniqueness value ≥4 [the number of times a motif appeared in the real network with a completely different (disjoint) set of genes]. We also reported the concentration, which is the ratio of the number of occurrences of a motif against other motifs of the same size in the real network. The random networks were created using the same number of incoming, outgoing and mutual edges as the real network. The source and targets of the edges were then randomly switched between nodes, resulting in a randomly connected set of nodes. The number of times this switching occurred was an arbitrary number between 100 and 200 times the number of edges in the real network.
We then obtained gene annotation from National Centre for Biotechnology Information's RefSeq database [21 ] and disease information from DOLite [22 ]. DOLite contains 560 disease categories that are a collection of aggregated disease terms from the Disease Ontology (http://disease‐ontology.org, accessed January 2014). Next, we visualised the network and calculated statistics using Cytoscape [23 ]. Finally, we identified example network clusters using the Cytoscape plug‐in ClusterONE [24 ] to show examples of some of the significant motifs in the real network.
3 Results and discussion
We found that 4029 human genes have an associated disease according to DOLite. We identified 1217 genes (39% of the human transcriptome) that have a known association with at least one of these 560 disease categories (see Fig. 2 ). Six hundred and twenty two genes (20%) were associated with one or more types of cancer, 176 genes (5%) with breast cancer, 106 genes (3%) with colon cancer and 97 genes (3%) with lung cancer. Forty‐eight TFs (31% of TFs in the database) were associated with some type of cancer.
Fig 2.
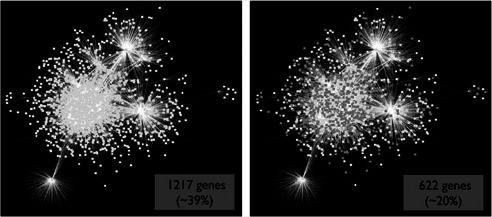
Global view of the human TF network is shown
One hundred and fifty‐four TFs and 2948 TGs with a total of 6883 regulatory interactions acquired from the TRED database are shown. Left: 1217 genes (39% of the human transcriptome) have a known association with at least one of 560 disease categories from DOLite (white). Right: 622 genes (20%) were associated with one or more types of cancer (grey), 176 genes (5%) with breast cancer, 106 genes (3%) with colon cancer and 97 genes (3%) with lung cancer. Forty‐eight TFs (31% of TFs in the database) were associated with cancer (not shown). These networks were visualised using Cytoscape [23 ]
mFinder identified a total of 972 696 three‐node subgraphs in the network with only one out of 13 possible three‐node motifs being significantly overrepresented in the real network. Likewise, 169 264 278 four‐node subgraphs were identified, with five out of 199 possible four‐node motifs being statistically significant (Table 1 ). Three examples, one three‐node and two four‐node motifs, are shown in Fig. 3. Motif 46 (A) is a regulating feedback motif with a feed‐forward loop (FFL). This motif is common in developmental and signalling transcription networks [26 ] and allows for a rapid response to signals (e.g. ON to OFF) while providing a delayed reaction to move in the opposite direction (OFF to ON). This is important for filtering noisy input and ignoring small fluctuations while allowing for a rapid response to stimuli. The most common variations of this pattern are the coherent regulating double positive feedback motif (all interactions enhance transcription) and the coherent double negative feedback motif (all interactions repress transcription). This result is in line with that of Gerstein et al. [4 ], who observed that the FFL was the most enriched three‐node motif within their network of 119 TFs. Motif 222 (B) is a combination feedback/bi‐fan. This pattern allows for combinatorial control depending on the input function of each gene. The bi‐fan is a pattern of joint regulation that usually generalises to dense overlapping regulons (DORs) in the larger network. Genes in DORs share a global function such as nutrient metabolism and biosynthesis [26 ]. Motif 2206 (C) is a combination feedback/multi‐FFL, which is useful for sign‐sensitive delay/acceleration and pulse generation. This allows the genes to be expressed in a particular order, and can act as a persistence detector for each output [26 ].
Table 1.
Significant motifs in the human transcriptional regulatory network
| Motif ID | Motif type | Occur (Real) | Occur (Rand) | Z ‐score (Real) | p ‐value | UV | [ ] |
|---|---|---|---|---|---|---|---|
| 46 | three‐node | 470 | 327.8 + −28.0 | 5.08 | 0.000 | 9 | 0.483 |
| 222 | four‐node | 4913 | 2864.9 + −451.9 | 4.53 | 0.000 | 8 | 0.029 |
| 908 | four‐node | 950 | 751.4 + −93.6 | 2.12 | 0.000 | 7 | 0.006 |
| 972 | four‐node | 703 | 363.1 + −74.4 | 4.57 | 0.000 | 4 | 0.004 |
| 2206 | four‐node | 486 | 306.2 + −44.2 | 4.07 | 0.000 | 5 | 0.003 |
| 2462 | four‐node | 264 | 162.0 + −42.6 | 2.40 | 0.000 | 4 | 0.002 |
We identified six types of statistically significant three‐ and four‐node motifs. ‘Occur (Real)’ indicates the number of times the motif occurred in the real network, ‘Occur (Rand)’ is the mean number of occurrences in random networks (shown with standard deviation), ‘Z ‐score (Real)’ is the Z ‐score for motifs in the real network, ‘p ‐value’ is the significance of the occurrence of motifs in the real network as reported by mFinder (p < 0.010), ‘UV’ is the unique value, which is the number of times a motif appears in the real network with a completely different (disjoint) set of genes, ‘[ ]’ is the concentration (×10−3 ), which is the ratio of the number of occurrences of a motif against other motifs of the same size in the real network.
Fig 3.
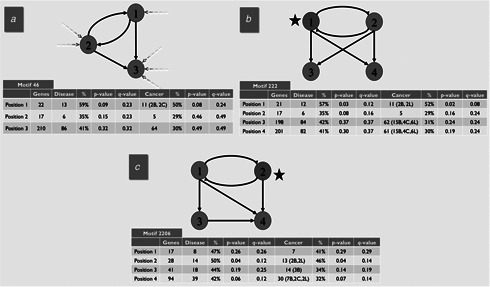
Three examples of statistically significant motifs in the human TF network
Each circle represents a node, and the number inside the circle represents the position of a gene within the motif. Since the transcriptional regulatory network is directed, the position number is determined by the in‐degree of the node in the real network (dashed arrows) so that a lower position number indicates a lower in‐degree and thus a higher‐level regulatory position. This applies to the two four‐node examples as well; the arrows are left out for simplicity. Total number of genes, number of disease‐related and cancer‐related genes, percentage and statistical significance at each position is shown. Nodes for which there are a statistically significant number of disease‐ and cancer‐related genes (i.e. p ≤ 0.05) are marked with a black star. p ‐values were calculated using a standard one‐tail t ‐test. q ‐values were calculated using the Benjamini‐Hochberg (BH) or FDR method [25 ]
One interesting observation is the high percentage of disease‐ and cancer‐related genes in the motif unit as a whole. In all three motifs, a large percentage of the disease genes were cancer related. For motif 46, 42% of genes were disease related and 32% of genes were cancer related, 42% of genes were disease related and 32% of genes were cancer related, as compared with the percentage of these categories over the entire network (39 and 20%, respectively). Notably, 76% of disease genes in this motif were involved in at least one type of cancer. The same scenario applies to the other two motifs, with motif 222 having 42% disease‐related genes, 32% cancer‐related genes and 76% cancer‐related disease genes, and motif 2206 having 44% disease‐related genes, 36% cancer‐related genes and 81% cancer‐related disease genes.
If we look at specific positions within the motifs, several characteristics apply to each example. First, the number of TFs in the first and second positions of motifs 46 and 222 and the first, second and third positions of motif 2206 are larger than that of the downstream positions (values not shown). This is expected and is due to the regulatory activity occurring in these locations (indicated by out‐going edges). Some TFs occupy the third position of motif 46, the third and fourth positions of motif 222, and the fourth position of motif 2206. This is also expected, since these patterns do not exist in isolation but are part of the larger graph, and, in the real network, these TFs most likely regulate other proteins in motifs located downstream from these examples. For motif 2206, positions 1, 2 and 3 are each regulatory in nature and follow a top‐down hierarchy. Positions 2 and 3 are both the second node in a FFL, and we would expect each of these positions to have similar number of TFs, which they do. Second, position 3 in motif 46 and positions 3 and 4 in motifs 222 and 2206 are associated with a larger overall number of genes. This too is anticipated, since one TF may regulate many genes. Third, there is one particular position in each of these motifs that is associated with a larger percentage of disease‐ and cancer‐related genes relative to the other positions. In motif 46, 13/22 (59%) genes in position 1 are associated with at least one disease compared with 35 and 41% for positions 2 and 3, respectively. Cancer‐related genes are also more common in position 1, with 11/22 (50%) genes having a cancer association while the equivalent value for positions 2 and 3 are 29 and 30%, respectively. This pattern holds for motif 222 as well, and to a lesser extent for motif 2206. For this last motif, the more equal distribution of disease‐ and cancer‐related genes may be a result of the nature of the motif itself as mentioned above.
Fig. 4 illustrates a comparison between the numbers of disease‐ and cancer‐related genes at motif positions against the percentage over the entire network. Position 1 in motif 46 is occupied by more disease‐ and cancer‐related genes, as well as genes involved in breast and colon cancer. A similar pattern holds at position 1 of motif 222 and position 2 of motif 2206. Interestingly, cancer‐related genes are more common in all motif positions relative to both other disease genes at that particular position and the network as a whole. This could be due to the effects of signalling cascades in cancer pathways (with down‐stream genes being affected by aberrant signalling upstream), whereas other diseases may be caused by mutations or other malfunctions that remain isolated.
Fig 4.
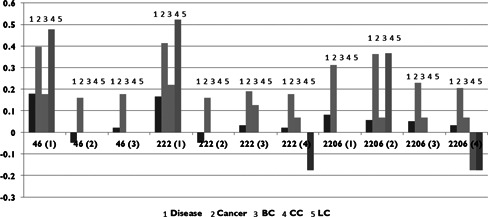
Log‐scale graph of the number of genes in three motifs by the position these genes occupy (in parentheses)
Five categories are shown: disease, cancer, breast cancer (BC), colon cancer (CC) and lung cancer (LC). Each column is normalised by the percentage of each category in the entire TF network
We then looked at the TF co‐regulation network and its relationship to disease (Fig. 5 ). We found that cancer‐related TFs regulated a higher number of TGs than non‐disease‐related TFs, and that they also had more co‐regulating partners. This seems logical given what we know about the cascading effects of cancer development, and that cancer‐related genes often have a larger number of interactions with other genes than non‐disease genes [27 ]. We also found that cancer‐related TFs were associated with more diseases of any type than non‐cancer‐related TFs. This highlights the connection between cancer and other diseases. The primary disease in a patient is often accompanied by secondary diseases, a phenomenon known as co‐morbidity [28 ].
Fig 5.
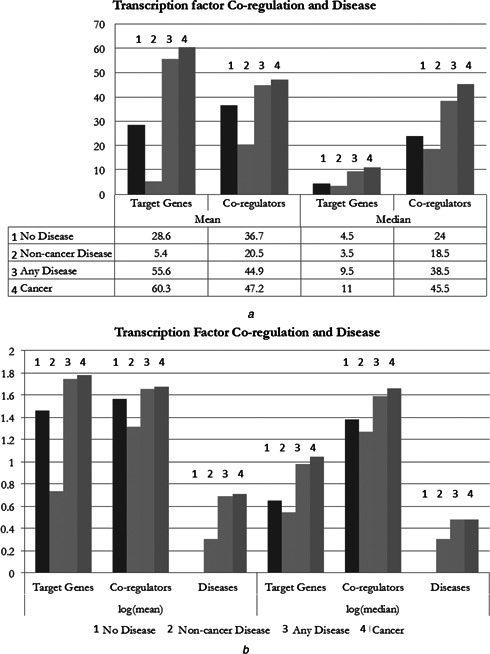
TF co‐regulation and disease
a Mean and median values for the TGs and co‐regulators of TFs as they relate to disease. Number of both TGs and co‐regulators is greatest for cancer‐related TFs
b Similar comparison on a log scale with the number of associated diseases is shown. Cancer genes are related to a larger number of total diseases compared with non‐cancer‐related disease genes
Additionally, we identified the number of TFs associated with each TG and found that TGs associated with cancer were regulated by a higher average number of TFs than both non‐disease and non‐cancer disease genes (Fig. 6 ). Furthermore, these cancer‐related TGs were involved in a higher than average number of diseases, similar to what we observed for TFs. When comparing the number of disease associations for TFs against TGs, we found that TGs were related to a higher number of diseases on average than TFs.
Fig 6.
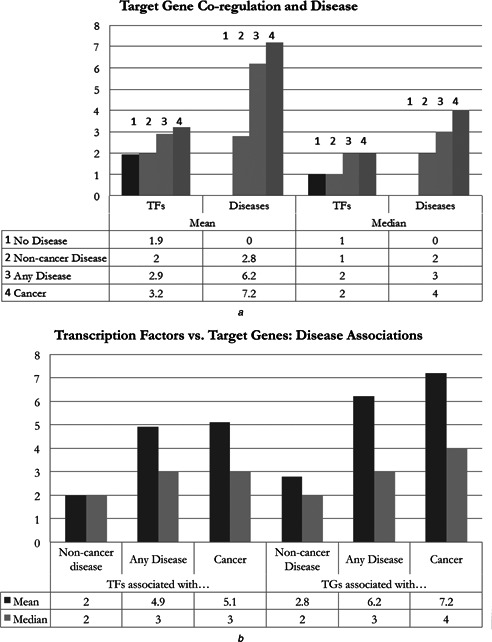
TG co‐regulation and disease
a Mean and median values for the TFs and diseases as they relate to TGs. Number of both TFs and diseases is greater for cancer‐related TGs
b Comparison of TFs and TGs and the number of associated diseases of different types. Cancer genes are related to a larger number of total diseases compared with non‐cancer‐related disease genes
To assess the significance of disease‐ and cancer‐related genes occupying specific positions within these motifs, we calculated the p‐ values for each. Using a p ‐value threshold of 0.05, we found that none of the positions in motif 46 were occupied by a statistically significant number of disease‐ or cancer‐related genes. For motif 222, position 1 has a p ‐value = 0.03 for disease‐related genes and a p ‐value = 0.02 for those that are cancer related (Fig. 3, in red). Similarly, the second position of motif 2206 has a p ‐value = 0.04 for both disease‐ and cancer‐related genes. We subsequently performed error correction using the BH or false discovery rate (FDR) method [25 ] and found that these significant p ‐values do not translate to significant q ‐values. A test for significance of specific cancer‐related genes (breast, colon and lung) resulted in similarly high q ‐values. Therefore the results on whether disease‐ and cancer‐related genes occupy specific positions within these regulatory motifs are inconclusive.
Example clusters from the human TF network are shown in Figs. 7 a and b. For each cluster, a combination of the motifs in Fig. 3 is apparent. In Fig. 7 a, the combination of multi‐output FFLs and bi‐fan motifs provide for complex and precise regulation of TGs. In Fig. 7 b, multi‐output FFLs are noticeable, but this time in conjunction with multiple bi‐fan motifs, resulting in the DOR pattern mentioned previously. It is important to emphasise that the individual motifs identified here overlap in real networks, and that analysing these regulatory interactions in the context of small sub‐graphs is done in order to reduce complexity and to try to understand the modes of action of all transcriptional regulators.
Fig 7.
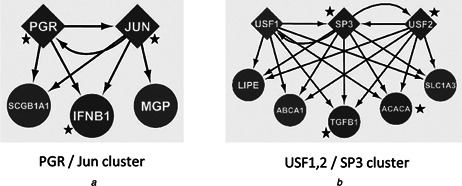
Example motifs
TFs: diamonds, TGs: ellipses, cancer‐related: marked as a black star, non‐cancer‐related: others
a PGR/Jun cluster – portion of the signalling pathway of the progesterone receptor PGR (breast cancer), which involves direct DNA‐binding and regulation of TGs. These include the oncogene JUN as well as IFNB1 (associated with colon and prostate cancer). A combination of multi‐output FFL and bi‐fan motifs is evident
b USF1,2/SP3 cluster – upstream stimulating factors (USF1 and USF2) are evolutionarily conserved and ubiquitously expressed. These TFs are major players in the transcriptional regulation of chromatin remodelling enzymes. USF2 and TGFB1 have been linked to tumour growth, whereas SP3 and ACACA have been linked to breast cancer. SP3 can act as an activator or repressor and is involved in cell‐cycle regulation, hormone induction and housekeeping. Clusters were identified using the ClusterONE [24 ] plug‐in with Cytoscape [23 ].
In further analysis, we identified the tissues in which the genes in our dataset were expressed using the UniProt database [29 ]. A total of 97 tissue types were represented. The number of genes originating in each tissue varied from 3 to 630 (mean: 63.6, median: 316). Fig. 8 shows the three most common tissues in our dataset: placenta, 630 genes (20% of dataset, 1.8% of the genome), liver, 488 genes (16% of dataset, 1.4% of the genome) and lung, 482 genes (16% of dataset, 1.4% of the genome). We found that genes were more likely to be associated with both general disease and cancer as the number of associated tissues increased. Interestingly, the number of genes related to cancer surpassed the level for other disease‐related genes as they become more ubiquitously expressed, especially for those found in three or more tissues. This is in line with the observation from Goh et al. that cancer genes that acquire somatic mutations are more ubiquitously expressed, while inherited diseases do not show the same expression pattern [25 ]. Many cancer genes also often have house‐keeping functions or are involved in cell signalling, either by direct DNA‐binding or through a signalling pathway activated by kinases.
Fig 8.
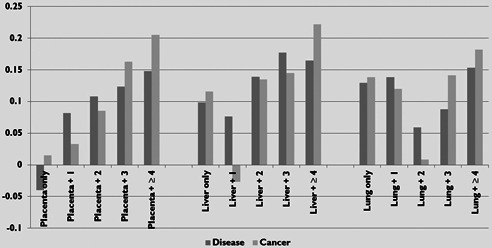
Log‐scale graph of the number of disease‐ and cancer‐related genes expressed in the three most common tissue sources for our dataset
‘+n ’ indicates that the genes are also expressed in n additional tissues
4 Conclusions
We built a human TF network from currently available data and identified eight statistically significant regulatory motifs. We found that both general disease‐related genes and cancer‐related genes were present more frequently in these motifs when compared with the network as a whole. Disease and cancer genes appeared often in a combination of the FFL, regulating feedback, and bi‐fan motifs. For two of the three examples shown, one position within the motif was occupied by a statistically significant number of disease‐ and cancer‐related genes. However, after adjusting for multiple p ‐values, the results were inconclusive. Further investigation is required to determine whether these genes are enriched at particular positions. We identified two clusters from the human TF network that exhibited a combination of statistically significant motifs and disease‐related genes. We also made a number of interesting observations. First, we found that more ubiquitously expressed genes were more likely to be associated with both general disease and cancer. Second, we found that cancer‐related TFs regulated a higher number of TGs than non‐disease‐related TFs, and that they also had more co‐regulating partners. Third, we found that cancer‐related TFs were associated with more diseases of any type than non‐cancer‐related TFs. This highlights the connection between cancer and other diseases. Finally, we identified the number of TFs associated with each TG and found that TGs associated with cancer were regulated by a higher average number of TFs than both non‐disease and non‐cancer disease genes. Furthermore, these cancer‐related TGs were involved in a higher than average number of diseases, similar to what we observed for TFs. When comparing the number of disease associations for TFs against TGs, we found that TGs were related to a higher number of diseases on average than TFs.
This analysis was not meant to ascertain or establish disease‐ or cancer‐specific pathways; our goal was simply to identify enriched motifs and attempt to determine whether disease genes occupied specific locations within these motifs. It is important to note that the network used in this study contained only a fraction of the true number of TFs, targets and disease‐related genes in the human regulatory network. Additional disease information, genes and regulatory interactions would certainly enhance our findings and possibly remove the ambiguity that we found in some of our results, particularly the significance of disease‐ and cancer‐related genes at specific motif positions. However, the method demonstrated here could be useful for identifying new disease‐related genes and could be extended to identify co‐occurring diseases among groups of genes involved in regulatory motifs.
5 References
- 1. Gu J.L. Lu Y. Liu C. Lu H.: ‘Multiclass classification of sarcomas using pathway based feature selection method ’, J. Theor. Biol., 2014, 362, pp. 3 –8 (doi: 10.1016/j.jtbi.2014.06.038 ) [DOI] [PubMed] [Google Scholar]
- 2. Zheng B. Liu J. Gu J. et al.: ‘A three‐gene panel that distinguishes benign from malignant thyroid nodules ’, Int. J. Cancer, 2015, 136, (7 ), pp. 1646 –1654 (doi: 10.1002/ijc.29172 ) [DOI] [PubMed] [Google Scholar]
- 3. Karlebach G. Shamir R.: ‘Modelling and analysis of gene regulatory networks ’, Nat. Rev. Mol. Cell Biol., 2008, 9, (10 ), pp. 770 –780 (doi: 10.1038/nrm2503 ) [DOI] [PubMed] [Google Scholar]
- 4. Gerstein M.B. Kundaje A. Hariharan M. et al.: ‘Architecture of the human regulatory network derived from encode data ’, Nature, 2012, 489, (7414 ), pp. 91 –100 (doi: 10.1038/nature11245 ) [DOI] [PMC free article] [PubMed] [Google Scholar]
- 5. Liu Z.P. Zhang W. Horimoto K. Chen L.: ‘Gaussian graphical model for identifying significantly responsive regulatory networks from time course high‐throughput data ’, IET Syst. Biol., 2013, 7, (5 ), pp. 143 –152 (doi: 10.1049/iet-syb.2012.0062 ) [DOI] [PMC free article] [PubMed] [Google Scholar]
- 6. Liu Z.P. Wu H. Zhu J. Miao H.: ‘Systematic identification of transcriptional and post‐transcriptional regulations in human respiratory epithelial cells during influenza a virus infection ’, BMC Bioinformatics, 2014, 15, p. 336 (doi: 10.1186/1471-2105-15-336 ) [DOI] [PMC free article] [PubMed] [Google Scholar]
- 7. Albert R. Jeong H. Barabasi A.L.: ‘Error and attack tolerance of complex networks ’, Nature, 2000, 406, (6794 ), pp. 378 –382 (doi: 10.1038/35019019 ) [DOI] [PubMed] [Google Scholar]
- 8. Wagner A.: ‘Distributed robustness versus redundancy as causes of mutational robustness ’, Bioessays, 2005, 27, (2 ), pp. 176 –188 (doi: 10.1002/bies.20170 ) [DOI] [PubMed] [Google Scholar]
- 9. Balaji S. Iyer L.M. Aravind L. Babu M.M.: ‘Uncovering a hidden distributed architecture behind scale‐free transcriptional regulatory networks ’, J. Mol. Biol., 2006, 360, (1 ), pp. 204 –212 (doi: 10.1016/j.jmb.2006.04.026 ) [DOI] [PubMed] [Google Scholar]
- 10. Balaji S. Babu M.M. Aravind L.: ‘Interplay between network structures, regulatory modes and sensing mechanisms of transcription factors in the transcriptional regulatory network of E. coli ’, J. Mol. Biol., 2007, 372, (4 ), pp. 1108 –1122 (doi: 10.1016/j.jmb.2007.06.084 ) [DOI] [PMC free article] [PubMed] [Google Scholar]
- 11. Wagner A. Wright J.: ‘Alternative routes and mutational robustness in complex regulatory networks ’, Biosystems, 2007, 88, (1–2 ), pp. 163 –172 (doi: 10.1016/j.biosystems.2006.06.002 ) [DOI] [PubMed] [Google Scholar]
- 12. Carson M.B. Langlois R. Lu H.: ‘Naps: a residue‐level nucleic acid‐binding prediction server ’, Nucleic Acids Res., 2010, 38, (Web Server issue), pp. W431 –435 (doi: 10.1093/nar/gkq361 ) [DOI] [PMC free article] [PubMed] [Google Scholar]
- 13. Bhardwaj N. Carson M.B. Abyzov A. Yan K.K. Lu H. Gerstein M.B.: ‘Analysis of combinatorial regulation: scaling of partnerships between regulators with the number of governed targets ’, PLoS Comput. Biol., 2010, 6, (5 ), p. e1000755 (doi: 10.1371/journal.pcbi.1000755 ) [DOI] [PMC free article] [PubMed] [Google Scholar]
- 14. Ellis P.J. Furlong R.A. Conner S.J. et al.: ‘Coordinated transcriptional regulation patterns associated with infertility phenotypes in men ’, J. Med. Genet., 2007, 44, (8 ), pp. 498 –508 (doi: 10.1136/jmg.2007.049650 ) [DOI] [PMC free article] [PubMed] [Google Scholar]
- 15. Acharya M. Huang L. Fleisch V.C. Allison W.T. Walter M.A.: ‘A complex regulatory network of transcription factors critical for ocular development and disease ’, Hum. Mol. Genet., 2011, 20, (8 ), pp. 1610 –1624 (doi: 10.1093/hmg/ddr038 ) [DOI] [PubMed] [Google Scholar]
- 16. Conrad B. Antonarakis S.E.: ‘Gene duplication: a drive for phenotypic diversity and cause of human disease ’, Annu. Rev. Genomics Hum. Genet., 2007, 8, pp. 17 –35 (doi: 10.1146/annurev.genom.8.021307.110233 ) [DOI] [PubMed] [Google Scholar]
- 17. Futreal P.A. Coin L. Marshall M. et al.: ‘A census of human cancer genes ’, Nat. Rev. Cancer, 2004, 4, (3 ), pp. 177 –183 (doi: 10.1038/nrc1299 ) [DOI] [PMC free article] [PubMed] [Google Scholar]
- 18. Zhao F. Xuan Z. Liu L. Zhang M.Q.: ‘Tred: a transcriptional regulatory element database and a platform for in silico gene regulation studies ’, Nucleic Acids Res., 2005, 33, (Database issue), pp. D103 –107 (doi: 10.1093/nar/gki004 ) [DOI] [PMC free article] [PubMed] [Google Scholar]
- 19. Vaquerizas J.M. Kummerfeld S.K. Teichmann S.A. Luscombe N.M.: ‘A census of human transcription factors: function, expression and evolution ’, Nat. Rev. Genet., 2009, 10, (4 ), pp. 252 –263 (doi: 10.1038/nrg2538 ) [DOI] [PubMed] [Google Scholar]
- 20. Kashtan N. Itzkovitz S. Milo R. Alon U.: ‘Efficient sampling algorithm for estimating subgraph concentrations and detecting network motifs ’, Bioinformatics, 2004, 20, (11 ), pp. 1746 –1758 (doi: 10.1093/bioinformatics/bth163 ) [DOI] [PubMed] [Google Scholar]
- 21. Pruitt K.D. Tatusova T. Brown G.R. Maglott D.R.: ‘Ncbi reference sequences (Refseq): current status, new features and genome annotation policy ’, Nucleic Acids Res., 2012, 40, (Database issue), pp. D130 –135 (doi: 10.1093/nar/gkr1079 ) [DOI] [PMC free article] [PubMed] [Google Scholar]
- 22. Du P. Feng G. Flatow J. et al.: ‘From disease ontology to disease‐ontology lite: statistical methods to adapt a general‐purpose ontology for the test of gene‐ontology associations ’, Bioinformatics, 2009, 25, (12 ), pp. i63 –68 (doi: 10.1093/bioinformatics/btp193 ) [DOI] [PMC free article] [PubMed] [Google Scholar]
- 23. Smoot M.E. Ono K. Ruscheinski J. Wang P.L. Ideker T.: ‘Cytoscape 2.8: new features for data integration and network visualization ’, Bioinformatics, 2011, 27, (3 ), pp. 431 –432 (doi: 10.1093/bioinformatics/btq675 ) [DOI] [PMC free article] [PubMed] [Google Scholar]
- 24. Nepusz T. Yu H. Paccanaro A.: ‘Detecting overlapping protein complexes in protein–protein interaction networks ’, Nat Methods, 2012, Mar 18:9, (5 ), pp. 471 –472. (doi: 10.1038/nmeth.1938 ) [DOI] [PMC free article] [PubMed] [Google Scholar]
- 25. Benjamini Y. Hochberg Y.: ‘Controlling the false discovery rate: a practical and powerful approach to multiple testing ’, J. R. Statist. Soc. B, 1995, 57, (1 ), pp. 289 –300 [Google Scholar]
- 26. Alon U.: ‘An introduction to systems biology: design principles of biological circuits ’ (Chapman and Hall/CRC, 2007, 1st edn. ) [Google Scholar]
- 27. Goh K.I. Cusick M.E. Valle D. Childs B. Vidal M. Barabasi A.L.: ‘The human disease network ’, Proc. Natl. Acad. Sci. USA, 2007, 104, (21 ), pp. 8685 –8690 (doi: 10.1073/pnas.0701361104 ) [DOI] [PMC free article] [PubMed] [Google Scholar]
- 28. Terret C. Castel‐Kremer E. Albrand G. Droz J.P.: ‘Effects of comorbidity on screening and early diagnosis of cancer in elderly people ’, Lancet Oncol., 2009, 10, (1 ), pp. 80 –87 (doi: 10.1016/S1470-2045(08)70336-X ) [DOI] [PubMed] [Google Scholar]
- 29. Consortium U.: ‘Reorganizing the protein space at the universal protein resource (Uniprot) ’, Nucleic Acids Res., 2012, 40, (D1 ), pp. D71 –D75 (doi: 10.1093/nar/gkr981 ) [DOI] [PMC free article] [PubMed] [Google Scholar]


