Abstract
Emission of chlorophyll fluorescence (ChlF) from photosystem II (PSII) is affected by both plant status and environmental conditions. In this work, a state space model structure for ChlF from PSII with temperature as a variable model parameter was developed to provide insights into the temperature effects on photosynthesis and greenhouse temperature control. Experiments were carried out at 20, 25, and 30°C to validate the capability and flexibility of the developed model structure. Simulations of ChlF emission were performed for different temperatures. The results demonstrated the effectiveness of the ChlF model structure and the findings are useful for the development of greenhouse temperature control strategies.
Inspec keywords: fluorescence, state‐space methods, photosynthesis, temperature control, vegetation
Other keywords: chlorophyll fluorescence, photosystem II, PSII, plant status, environmental conditions, state space model structure, variable model parameter, temperature effects, photosynthesis, ChlF emission, ChlF model structure, greenhouse temperature control strategies, temperature 20.0 degC, temperature 25.0 degC, temperature 30.0 degC
1 Introduction
Photosynthesis is the basis for all life activities. It can be affected by many factors such as nutrients, salt, chilling, heat, herbicides, heavy metals, drought etc. [1]. With global climate changes, many plants show considerable phenotypic changes in their photosynthetic characteristics [2]. They respond to changes in temperature, slowly showing a certain degree of adaptability to changes in the environment. As one of the most common factors affecting plant photosynthesis, global warming has attracted wide interest from researchers in predicting temperature effects on plant growth [3, 4]. Moreover, greenhouses play vital roles in modern agriculture, which provide large amounts of vegetables, especially for locations with low temperatures and short duration of sunshine or cities with high population densities and limited farming land. Current greenhouse temperature control strategies do not rely on real‐time temperature effects on plant growth as feedback and thus cannot achieve optimal plant yield. For greenhouse temperature control, it is desirable to model temperature effects on photosynthesis with a measurable plant‐status‐based variable as feedback.
In photosynthesis, plants use water, CO2, and light to produce carbohydrates, proteins, and other compounds. Part of the absorbed light by photosystem II (PSII) may be emitted as ChlF. Photochemical reactions, heat dissipation, and fluorescence emission are the three pathways for the absorbed light energy [5]. According to the law of energy conservation, there is a competitive relationship between the three energy pathways. Changes in any of the three will lead to changes in the other two. For example, electron transport rate increase may lead to enhanced photochemical reaction rates and consequently reduced fluorescence and heat dissipation [6, 7]. PSII is very sensitive to heat [8]. Although ChlF signal is very complex, it does provide reliable, quantitative information about plant photosynthesis process and status, and it can be measured by portable instruments. In addition, ChlF measurement does not harm the organism, which is a non‐invasive and convenient tool to investigate the photosynthesis process and plant physiology [9]. When plants face a rapidly changing temperature, they do not show visible symptoms such as yellowing and withered leaves. ChlF dynamics can show variations in plant photosynthesis induced by environmental changes even if the changes are subtle.
In the literature, ChlF has been used to study the effects of many factors including temperature on photosynthesis [10–12]. Herbicide [3‐(3,4‐dichlorophenyl)‐1,1‐dimethylurea] and temperature can affect the ChlF induction of barley leaves [13]. ChlF intensity at room temperature was found higher than that at higher temperatures. The temperature dependence of ChlF intensity in barley leaves under weak and actinic light excitation during linear heating from room temperature to 50°C was studied by Kouril [14]. Their model suggested that the heat‐induced fluorescence rise was caused by both the light‐induced reduction of Quinone acceptor (QA) and enhanced back electron transfer from Quinone acceptor B (QB) to QA. The ChlF induction curve and fluorescence‐temperature curve can be used for evaluation of changes in thylakoid membrane caused by high temperature stress [15]. The temperature of the K‐peak in the ChlF induction curve was used as an indicator of PSII thermostability and more generally as a plant stress indicator [16]. It is evident that ChlF is a useful variable to reflect temperature effects on photosynthetic activities.
Modern control techniques are usually based on models in state space [17–21]. Photosynthetic activities have been modelled in the literature with different levels of complexities, which often include more than 20 [22] or more state variables [7, 23, 24]. These models may be theoretically comprehensive, but they are difficult to use in developing greenhouse temperature control strategies. Vershubskii et al. [25] simulated the relationships between electron and proton fluxes, and the adenosine triphosphate and nicotinamide adenine dinucleotide phosphate consumption. CO2 uptake, O2 evolution, chlorophyll fluorescence emission, lumen and stromal pH, and membrane potential following perturbations in light were simulated successfully [26]. An fluorescence induction (FI) model can improve the accuracy of the prediction of the OJIP kinetics [27].
There have been many experiments demonstrating temperature effects on ChlF dynamics, chemical concentrations, and PSII photochemistry efficiency in plants [28]. The results show that temperature has a significant effect on enzyme reactions, physiological and biochemical reactions in cell membranes [29]. The plant photosynthetic apparatus can be damaged by severe heat stress, even irreversibly, which will seriously inhibit the growth of plants ultimately. Under moderate heat stress, damages can be reversible.
There is a lack of published work on modelling and simulation of major PSII activities as affected by temperature. In this work, a simple model structure for chlorophyll fluorescence from PSII with temperature as a variable parameter was proposed according to the prior work of Guo and Tan [7]. Moderate temperature changes were assumed as they would be the case for a greenhouse environment.
2 Model structure development for chlorophyll fluorescence emission as affected by temperature
2.1 Theory of temperature effect on chemical reaction rates
The Arrhenius equation states that a chemical reaction rate varies with temperature exponentially
| (1) |
where k is reaction rate, R is the molar gas constant (8.3145 J/mol K), T is the absolute temperature in Kelvin, k 0 is a constant of proportionality called the Arrhenius constant, and E A is the activation energy. Different reaction processes have different k 0 and EA .
The Arrhenius equation was originally proposed for chemical reactions, but it has been used in many areas including botany. For example, a method of temperature compensation for ChlF emission has been proposed by using the Arrhenius equation [14, 30]. The method was applied to describe the relationship between temperature and leaf or seeding expansion rates, germination, cell division or development rates, and leaf elongation rates. In this work, the concept was adopted and the Arrhenius equation was applied to a kinetic ChlF model structure reported in [7] and incorporated into the chemical reaction rates. It should be mentioned that the Arrhenius equation is an approximation to temperature effects on PSII activities since the equation is usually used for chemical reactions with freely moving reactants but electron donors and acceptors in PSII may not move freely. Nonetheless, the results from this work show that the Arrhenius equation is a reasonable representation of the temperature effects on PSII activities.
2.2 Model structure for ChlF from PSII as affected by temperature
For a fully dark‐adapted plant leaf, the antenna complex (A) of the PSII captures a photon and jumps to the excited state (A*), which will then transfer the captured light energy to the reaction centre (P680) and excite P680 to the first excited singlet state (P680*). Since P680* is very unstable, it will pass the excited electrons in higher energy levels via a pheophytin molecule (Pheo) immediately to the primary QA and reduces QA to the form of QA −. QA − will pass the electron to the secondary QB and reduce QB. QB can carry two extra electrons and become QB 2−.
The conversion process between platoquinol (QH2) and plastoquinone (PQ) will be involved in the protonation of QB 2−. QB 2− will combine with two protons from the chloroplast stroma to become QH2, which will transfer from the QB site to the thylakoid lumen. QH2 in the thylakoid membrane is oxidised through the cytochrome b6f complex (Cytb6f), and the oxidised QH2 will return to the PQ pool and become a new PQ. In this work, we only consider the ChlF from PSII and ignore the ChlF from other sources. Furthermore, ChlF from PSI is not sensitive to environmental stresses and does not contribute to variable ChlF significantly [31]. ChlF from PSI was thus ignored in this work. The application of (1) for all rates related to chemical ratios in the photochemical scheme in Guo and Tan [7] will lead to the following cascade reactions:
| (2) |
| (3) |
| (4) |
| (5) |
| (6) |
| (7) |
where k 1 and k 2 are constants, k 3 through k 10 are Arrhenius constants, E A3 through E A10 are activation energy values, and u is the excitation light intensity.
The Arrhenius equation was not applied to the reactions represented by k 1 and k 2 in (2) since they represent a physical process. Since temperature may affect electron excitation to a higher energy state or relaxing to the ground state [32–35], different k 1 and k 2 values were directly estimated for different temperatures.
Use x 1, x 2, x 3, x 4, and x 5 to denote the probability of existence or concentration of A*, QA −, QB −, QB 2−, and PQ, respectively. The averages of unreduced and reduced QB sites over all reaction centres in a sample are represented in the model structure and their total probability is set to 1. The probability for reduced QB sites is represented as r 2 (0 ≤ r 2 ≤ 1). There are about 290 chlorophyll molecules in one PSII unit [32]. A0 is used to denote the antenna pool size and PQ0 used to represent the PQ pool size. The following six state equations can be derived to represent the system dynamics:
| (8) |
| (9) |
| (10) |
| (11) |
| (12) |
ChlF emission is one of the competiting energy pathways, which is from the PSII antenna complex [6]. Therefore, ChlF is proportional to the concentration of excited A* [31]. If G is used to account for light intensity and instrumentation gain, the following equation can be obtained to describe ChlF:
| (13) |
where F is the ChlF intensity.
3 Samples and experiments
3.1 Plant samples
ChlF from three types of dicotyledonous plant leaves (Camellia japonica, Ligustrum japonicum ‘ Howardii’, and Euonymus L.) was measured. The leaves were collected from naturally grown trees on the campus of Jiangnan University (Wuxi City, Jiangsu Province, China). Pairs of leaves were picked in September when the environment temperature was from 18 to 25°C. To reduce the effect of different leaf moisture contents on the measured ChlF, the leaves were soaked in water at least 2 h before experiments were performed.
3.2 Experiments
Each pair of dicotyledon leaves was cut into four quarters and three of them were used. Each of the leaf segments was clamped into a plastic dark‐adaptation clip. The leaf segments along the clips were put into water baths at three different temperatures (20, 25, and 30°C) for 1 h to achieve temperature balance. The leaf segments were assumed to have a similar physiological status. All the leaves were dark‐adapted for at least half an hour before ChlF measurement was performed. ChlF OJIP induction of the leaves was measured with a chlorophyll fluorometer (FluorPen, PSI, Photon Systems Instruments, Czech Republic). During the measurement, the leaf segments were never removed from their plastic dark‐adaptation clips. The illumination light intensity was set as 3000 µmol photons m−2 s−1. A total of 21 leaf quarters (obtained from seven pairs of dicotyledon leaves) were measured for each species of plant. Since all the leaf segments were equilibrated in water for 1 h, the final concentration of the terminal acceptors such as CO2 was assumed the same for all the leaf segments.
4 Results and discussion
4.1 Model validation
ChlF data from the three types of trees were used to test the capability of the model structure in describing measured ChlF under different temperatures. The model parameters in (7)–(12) were adjusted by the Levenberg–Marquardt method to achieve optimal fitting to the measured ChlF. Comparisons between the model fitting and experimental data are shown in Fig. 1. For reach tree species, the same set of model parameter values was used for the three different temperatures. The model parameters used are listed in Table 1.
Fig. 1.
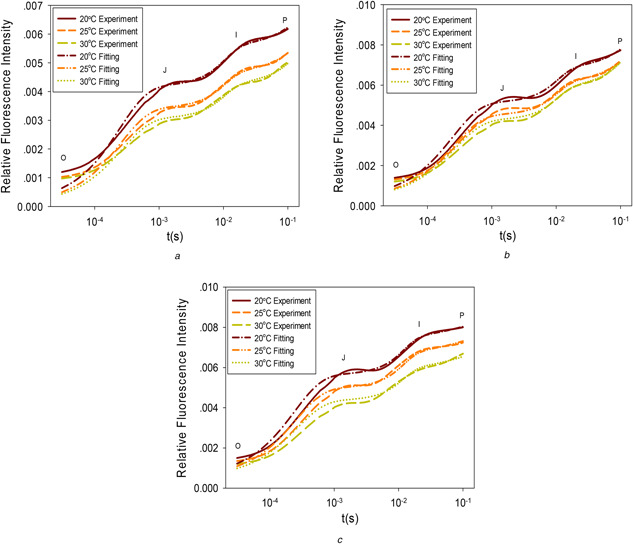
Example comparison between experimental data and model predictions under different temperatures
(a) Camellia japonica, (b) Ligustrum japonicum ‘ Howardii’, and (c) Euonymus L
Table 1.
Model parameter values used for model prediction in Figs. 1 a –c
| Fig. 1 a | Fig. 1 b | Fig. 1 c | |
|---|---|---|---|
| k 1 u | 0.49 | 0.54 | 0.42 |
| k 2 | 611.80 | 611.41 | 611.41 |
| k 3 | 3624.17 | 3624.17 | 3624.17 |
| k 4 | 0.58 | 0.60 | 0.61 |
| k 5 | 16172.69 | 16172.69 | 16172.69 |
| k 6 | 1158.41 | 1127.49 | 1227.88 |
| k 7 | 6150.56 | 6116.12 | 6226.10 |
| k 8 | 3013.28 | 3013.17 | 3009.83 |
| k 9 | 30.98 | 30.92 | 29.99 |
| k 10 | 9.56 | 9.39 | 14.95 |
| E A3 | 165.04 | 164.92 | 108.86 |
| E A4 | 56.91 | 0.00 | 60.48 |
| E A5 | 304.83 | 160.22 | 0.94 |
| E A6 | 479.68 | 605.11 | 737.24 |
| E A7 | 500.63 | 437.99 | 1725.48 |
| E A8 | 170.97 | 205.50 | 1193.69 |
| E A9 | 0.00 | 90.02 | 0.00 |
| E A10 | 212.72 | 133.88 | 36.33 |
| r 2 | 1.00 | 1.00 | 1.00 |
| PQ pool | 9.20 | 9.20 | 9.21 |
The total relative fitting error for each tree species at different temperatures was estimated with
where yi * is the i th experiment data and yi is the i th model prediction, N is the total number of data points, M is the total number of different temperatures. The average relative fitting error for Figs. 1 a –c is <0.161%. In Figs. 1 a –c, there are noticeable fitting errors between experiment data and model predictions at the initial phase, which is explainable. The time axis is shown in the logarithmic scale, which visually exaggerates the fitting errors in the early part of the process. The early ChlF signal changes very fast and has very high‐frequency components. The simplified kinetic model used has limited capability to represent high‐frequency dynamics and thus leads to some expected fitting residuals. However, this will not weaken its capability of representing the more meaningful and useful low‐frequency trends.
In the developed model structure, temperature is directly a parameter. With only five state variables or equations, the simple model structure could describe experimental data measured at multiple temperatures with one set of model parameters. This demonstrates the effectiveness of the developed model structure. It can be observed from the simulations and experiments that high temperature enhances forward photosynthetic reactions and thus leads to a reduction in ChlF, which is consistent with other research [15].
4.2 Chemical species concentrations under different temperatures
Fig. 2 shows the concentrations of QA −, QB −, QB 2−, and PQ under three temperatures based on parameters estimated from the experimental data. Figs.2 a–c show that the concentrations of QA − and QB 2− increase with temperature, but high temperatures may lead to a reduction of QB − and PQ because high temperatures accelerate forward reactions, which convert QB − to QB 2− and PQ to PQH2 at a later stage.
Fig. 2.
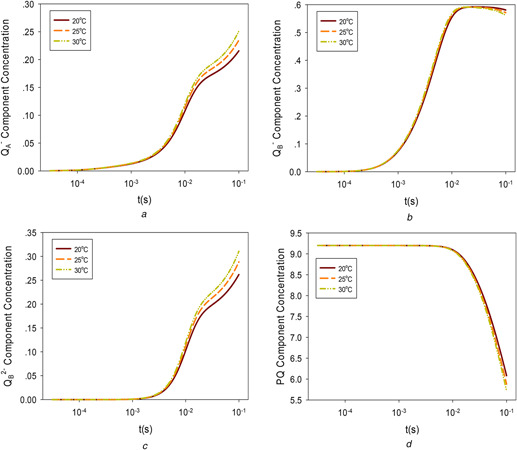
Chemical species concentrations under different temperatures
(a) QA −, (b) QB −, (c) QB 2−, (d) PQ
4.3 Temperature influence on chlorophyll fluorescence for different PQ sizes
The degree of PQ pool protonation affects the amount of ChlF emission. Temperature affects chemical reaction speed and balance, and thus modulates the effect of PQ pool size on photosynthesis and ChlF emission. The effect of temperature on ChlF for different PQ sizes was simulated and shown in Fig. 3. With different PQ pool sizes, the temperature effect on ChlF kinetics is different. From Fig. 3 a, it can be observed that when the PQ pool size is small, the curves fluctuate for all three temperatures but show no obvious J feature. The processes of going from O to J and I to P become steep. The higher the temperature, the more dramatic the changes occur. When the PQ pool size is small, the temperature effect on ChlF is because the system is easier to be saturated and thus the reduction in ChlF caused by higher photosynthetic efficiency induced by higher temperature is masked by the smaller capacity of the system.
Fig. 3.
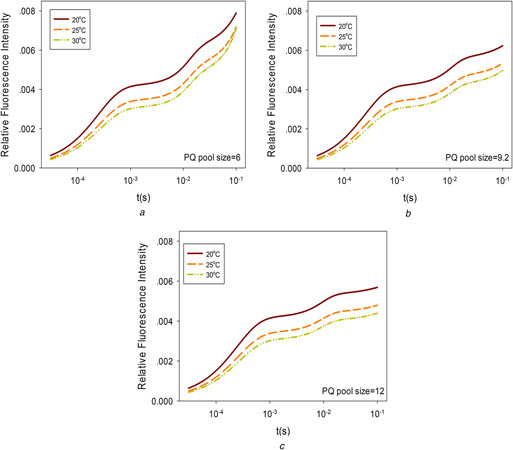
Temperature influence on ChlF for different PQ sizes
(a) PQ pool size is 6, (b) PQ pool size is 9.2, (c) PQ pool size is 12
4.4 Temperature influence on chlorophyll fluorescence for different percentages of active QB sites
Many factors in nature affect the active state of QB, such as ultraviolet‐B radiation, temperature, pesticides and some other mechanisms [36, 37], which leads to changes in the structure of the accessory enzyme electron acceptor, and in turn, affects PSII electron transfer efficiency. The influence of temperature on ChlF was simulated for different percentages of active QB sites. The results are shown in Figs. 4 a –c. A non‐active QB cannot accept electrons in a timely manner, which will lead to a large number of QA − accumulations and higher ChlF emission, but the trends of the curves are similar to ChlF for different percentages of active QB sites.
Fig. 4.
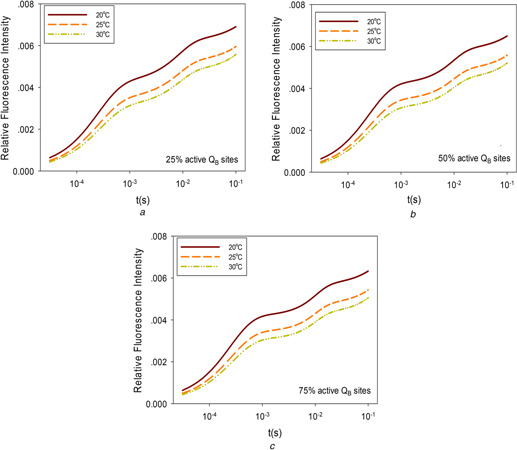
Influence of temperature on ChlF with different percentages of active QB sites
(a) Active QB sites are 25%, (b) Active QB sites are 50%, (c) Active QB sites are 75%
4.5 Temperature influence on chlorophyll fluorescence with different levels of light intensity
The excitation light intensity can affect the ChlF kinetic curve to a large extent. The light intensity for Figs. 5 a –c is fixed at 50, 100, and 150% of that for Fig. 1 a, respectively. It can be observed from the figures that the intensity of ChlF will change when the illumination light intensity and environmental temperatures change. Higher temperatures reduce the intensity of ChlF at all light levels but the basic OJIP pattern is maintained within the moderate range of temperatures analysed.
Fig. 5.
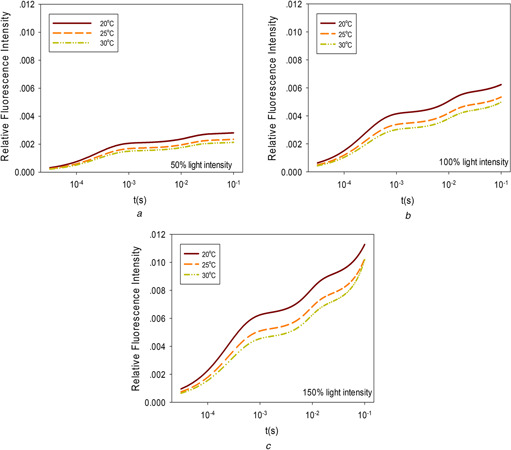
Influence of the temperature on ChlF at different levels of light intensity
(a) Light intensity is 50%, (b) Light intensity is 100%, (c) Light intensity is 150%
5 Conclusion
The growth rate of plants at different temperatures is significantly different. A state space kinetic model structure for the major PSII activities at different temperatures was developed in the context of greenhouse temperature control. The developed model structure applies the Arrhenius equation and makes temperature as a transparent model parameter, which makes it fit experimental data at different temperature possible. This cannot be achieved in earlier published ChlF model structures. With one set of parameter values for a plant species, the model structure developed can fit experimental data measured at multiple occasions. The average relative prediction error is as low as 0.161%. This demonstrates the flexibility of the model structure to represent plant response to moderate temperature changes. In future work, both chilling stress and heat stress should be considered to extend the model structure to cover the effects of wider environmental changes.
6 Acknowledgments
This project was partially supported by the National Natural Science Foundation of China (no. 31771680), the Fundamental Research Funds for the Central Universities of China (no. JUSRP51730A), the Modern Agriculture Funds of Jiangsu Province (nos. BE2015310 and SXGC[2017]210), the New Agricultural Engineering of Jiangsu Province (no. SXGC[2016]106), the 111 Project (B1208) and the Research Funds for New Faculty in Jiangnan University.
7 References
- 1. Guo Y., and Tan J.: ‘Recent advances in the application of chlorophyll a fluorescence from photosystem II’, Photochem. Photobiol., 2015, 91, (1), pp. 1–14 [DOI] [PubMed] [Google Scholar]
- 2. Gunderson C.A. Norby R.J., and Wullschleger S.D.: ‘Acclimation of photosynthesis and respiration to simulated climatic warming in northern and southern populations of Acer saccharum: laboratory and field evidence’, Tree Physiol., 2000, 20, (2), pp. 87–96 [DOI] [PubMed] [Google Scholar]
- 3. Oukarroum A. Goltsev V., and Strasser R.J.: ‘Temperature effects on pea plants probed by simultaneous measurements of the kinetics of prompt fluorescence, delayed fluorescence and modulated 820 nm reflection’, PLoS ONE, 2013, 8, (3), p. e59433 [DOI] [PMC free article] [PubMed] [Google Scholar]
- 4. Chaki M. Valderrama R., and Fernández‐Ocaña A.M. et al.: ‘High temperature triggers the metabolism of S‐nitrosothiols in sunflower mediating a process of nitrosative stress which provokes the inhibition of ferredoxin–NADP reductase by tyrosine, nitration’, Plant Cell Environ., 2011, 34, (11), pp. 1803–1818 [DOI] [PubMed] [Google Scholar]
- 5. Goltsev V. Zaharieva I., and Lambrev P. et al.: ‘Simultaneous analysis of prompt and delayed chlorophyll a fluorescence in leaves during the induction period of dark to light adaptation’, J. Theor. Biol., 2003, 225, (2), pp. 171–183 [DOI] [PubMed] [Google Scholar]
- 6. Krause G.H., and Weis E.: ‘Chlorophyll fluorescence and photosynthesis: the basics’, Annu. Rev. Plant Biol., 1991, 42, (1), pp. 313–349 [Google Scholar]
- 7. Guo Y., and Tan J.: ‘Modeling and simulation of the initial phases of chlorophyll fluorescence from photosystem II. BioSystems, 2011, 103, (2), pp. 152–157 [DOI] [PubMed] [Google Scholar]
- 8. Balouchi H.R.: ‘Screening wheat parents of mapping population for heat and drought tolerance, detection of wheat genetic variation’, Int. J. Biol. Life Sci., 2010, 6, pp. 56–66 [Google Scholar]
- 9. Baker N.R.: ‘Chlorophyll fluorescence: a probe of photosynthesis in vivo’, Annu. Rev. Plant Biol., 2008, 59, pp. 89–113 [DOI] [PubMed] [Google Scholar]
- 10. Guo Y., and Tan J.: ‘A plant‐tissue‐based biophotonic method for herbicide sensing’, Biosens. Bioelectron., 2010, 25, pp. 1958–1962 [DOI] [PubMed] [Google Scholar]
- 11. Rodriguez M., and Greenbaum E.: ‘Detection limits for real‐time source water monitoring using indigenous freshwater microalgae’, Water Environ. Res., 2009, 81, (11), pp. 2363–2371 [DOI] [PubMed] [Google Scholar]
- 12. Zivcak M. Brestic M., and Olsovska K.: ‘Application of photosynthetic parameters in the screening of wheat (Triticum aestivum L.) genotypes for improved drought and high temperature tolerance’, in Allen J.F. Gantt E. Golbeck J.H., and Osmond B. (Eds.): ‘Photosynthesis. Energy from the sun: 14th international congress on photosynthesis’ (Springer, Dordrecht, 2008), pp. 1247–1250 [Google Scholar]
- 13. Lazár D., and Pospíšil P.: ‘Mathematical simulation of chlorophyll a fluorescence rise measured with 3‐(3′, 4′‐dichlorophenyl)‐1, 1‐dimethylurea‐treated barley leaves at room and high temperatures’, Eur. Biophys. J., 1999, 28, (6), pp. 468–477 [DOI] [PubMed] [Google Scholar]
- 14. Kouřil R. Lazár D., and Ilík P. et al.: ‘High‐temperature induced chlorophyll fluorescence rise in plants at 40–50°C: experimental and theoretical approach’, Photosynth. Res., 2004, 81, (1), pp. 49–66 [DOI] [PubMed] [Google Scholar]
- 15. Lazár D., and Ilik P.: ‘High‐temperature induced chlorophyll fluorescence changes in barley leaves comparison of the critical temperatures determined from fluorescence induction and from fluorescence temperature curve’, Plant Sci., 1997, 124, (2), pp. 159–164 [Google Scholar]
- 16. Lazár D. Ilík P., and Nauš J.: ‘An appearance of K‐peak in fluorescence induction depends on the acclimation of barley leaves to higher temperatures’, J. Lumin., 1997, 72, pp. 595–596 [Google Scholar]
- 17. Dorf R.C., and Bishop R.H.: ‘Modern control systems’ (Pearson, Boston, MA, USA, 2011) [Google Scholar]
- 18. Kiencke U., and Nielsen L.: ‘Automotive control systems: for engine, driveline, and vehicle’, 2000.
- 19. Tewari A.: ‘Modern control design’ (John Wiley & sons, NY, 2002), pp. 283–308 [Google Scholar]
- 20. Friedland B.: ‘Control system design: an introduction to state‐space methods’ (Courier Corporation, New York, NY, USA, 2012) [Google Scholar]
- 21. Ying H. Siler W., and Buckley J.J.: ‘Fuzzy control theory: a nonlinear case’, Automatica, 1990, 26, (3), pp. 513–520 [Google Scholar]
- 22. Chernev P. Goltsev V., and Zaharieva I. et al.: ‘A highly restricted model approach quantifying structural and functional parameters of photosystem II probed by the chlorophyll a fluorescence rise’, Ecol. Eng. Environ. Protect., 2006, 5, (2), pp. 19–29 [Google Scholar]
- 23. Lazár D., and Jablonský J.: ‘On the approaches applied in formulation of a kinetic model of photosystem II: different approaches lead to different simulations of the chlorophyll a fluorescence transients’, J. Theor. Biol., 2009, 257, (2), pp. 260–269 [DOI] [PubMed] [Google Scholar]
- 24. Lazár D.: ‘Modelling of light‐induced chlorophyll a fluorescence rise (OJIP transient) and changes in 820 nm‐transmittance signal of photosynthesis’, Photosynthetica, 2009, 47, (4), pp. 483–498 [Google Scholar]
- 25. Vershubskii A.V. Kuvykin I.V., and Priklonskii V.I. et al.: ‘Functional and topological aspects of pH‐dependent regulation of electron and proton transport in chloroplasts in silico’, BioSystems, 2011, 103, (2), pp. 164–179 [DOI] [PubMed] [Google Scholar]
- 26. Zhu X.G. Wang Y., and Ort D.R. et al.: ‘e‐Photosynthesis: a comprehensive dynamic mechanistic model of C3 photosynthesis: from light capture to sucrose synthesis’, Plant Cell Environ., 2013, 36, pp. 1711–1727 [DOI] [PubMed] [Google Scholar]
- 27. Xin C.P. Yang J., and Zhu X.G.: ‘A model of chlorophyll a fluorescence induction kinetics with explicit description of structural constraints of individual photosystem II units’, Photosynth. Res., 2013, 117, pp. 339–354 [DOI] [PubMed] [Google Scholar]
- 28. Krause G.H. Winter K., and Krause B. et al.: ‘High‐temperature tolerance of a tropical tree, Ficus insipida: methodological reassessment and climate change considerations’, Funct. Plant Biol., 2010, 37, pp. 890–900 [Google Scholar]
- 29. Sharkey T.D., and Zhang R.: ‘High temperature effects on electron and proton circuits of photosynthesis’, J. Integr. Plant Biol., 2010, 52, (8), pp. 712–722 [DOI] [PubMed] [Google Scholar]
- 30. Parent B Turc O, and Gibon Y et al.: ‘Modelling temperature‐compensated physiological rates, based on the co‐ordination of responses to temperature of developmental processes’, J. Exp. Bot., 2010, 61, (8), pp. 2057–2069 [DOI] [PubMed] [Google Scholar]
- 31. Zhu X.G. Baker N.R., and Ort D.R. et al.: ‘Chlorophyll a fluorescence induction kinetics in leaves predicted from a model describing each discrete step of excitation energy and electron transfer associated with photosystem II’, Planta, 2005, 223, (1), pp. 114–133 [DOI] [PubMed] [Google Scholar]
- 32. Peng X. Yang Z., and Wang J. et al.: ‘Fluorescence ratiometry and fluorescence lifetime imaging: using a single molecular sensor for dual mode imaging of cellular viscosity’, J. Am. Chem. Soc., 2011, 133, (17), pp. 6626–6635 [DOI] [PubMed] [Google Scholar]
- 33. Du X.C. He Z.Q., and Lin X. et al.: ‘Low‐cost robust polymer optical fiber temperature sensor based on FIR method for in situ measurement’, 2015.
- 34. Liu J. Zhang Y., and Li J.Z. et al.: ‘Relationship between intensity of laser induced fluorescence and oil temperature’, J. Beijing Inst. Technol., 2000, 20, (5), pp. 636–638 [Google Scholar]
- 35. Lai H.S. Chen B.J., and Xu W. et al.: ‘Synthesis and luminous characteristics of Y (P, V) O4: Eu3+ phosphors for PDP’, Guang Pu Xue Yu Guang Pu Fen Xi, 2005, 25, (12), pp. 1929–1932 [PubMed] [Google Scholar]
- 36. Fiscus E.L., and Booker F.L.: ‘Is increased UV‐B a threat to crop photosynthesis and productivity?’, Photosynth. Res., 1995, 43, (2), pp. 81–92 [DOI] [PubMed] [Google Scholar]
- 37. Wang G.H. Hao Z., and Anken R.H. et al.: ‘Effects of UV‐B radiation on photosynthesis activity of Wolffia arrhiza as probed by chlorophyll fluorescence transients’, Adv. Space Res., 2010, 45, pp. 839–845 [Google Scholar]


