Abstract
Transdermal drug delivery is a non‐invasive method of drug administration. However, to achieve this, the drug has to pass through the complicated structure of the skin. The complex structure of skin can be modelled by an electrical equivalent circuit to calculate its impedance. In this work, the transfer function of three electrical models of the human skin (Montague, Tregear and Lykken Model) based on physiological stratification are analysed. Sensitivity analysis of these models is carried out to consider the extent to which changes in system parameters (different types of R and C as described by different models) affect the behaviour of the model. Techniques like normal of derivative and Hausdorff Distance is also used to study and understand the different curves. Comparison is also made with CPE based model. As Montague Model is the most widely used model, Tregear and Lykken Model are compared with it. It can be commented that out of the above observations Tregear Model at Level 3 can be used for establishing the electrical equivalent of human skin due to its simplicity. However, fractional ordered CPE models provide a good approximation. Future prospect lies in developing a model that characterize both biological properties and physiological stratification.
Inspec keywords: electric impedance measurement, transfer functions, biological techniques
Other keywords: skin impedance models, physiological stratification, transdermal drug delivery, noninvasive method, drug administration, electrical equivalent circuit, electrical models, human skin, Lykken models, sensitivity analyses, Montague model, Tregear model, CPE models, constant phase element‐based model, Hausdorff distance
1 Introduction
The traditional methods of drug administrations are oral intake and hypodermic injection. However, in addition to the above methods, a drug can be administrated to a person in different ways. Transdermal drug delivery is one of the ways, in which medication is administered into the patient's body through the skin [1–3]. Various methods for transdermal drug delivery have been developed based on diffusion, absorption, thermal energy, radiofrequency energy, ultrasound, electrostatic force (electrophoresis) or electric field (iontophoresis). All these developed methods are non‐invasive or minimally invasive methods. Electrically assisted transdermal drug delivery is the facilitated transport of compounds across skin using electromotive force [4]. Depending on the nature of the applied field, the molecule to be delivered and the barrier to be crossed, this mode of active drug delivery includes iontophoresis, electro‐osmosis, iontohydrokinesis, electroporation and electroincorporation. This method facilitates the delivery of drug both locally into the skin as well as into systemic circulation [1, 4]. All these methods are non‐invasive methods and provide a controlled release of a drug without significant discomfort to the patient [5].
All the methods of transdermal drug delivery have to deal with the complicated properties of the human skin. Human skin is one of the most complex organs with many functions, properties and components. It comprises pores, hair follicles, sweat glands and keratinised skin cells. The main function of the skin is to provide a natural barrier to foreign chemicals and biological agents. It also helps to maintain homeostasis and thermal regulation for the body [6]. Of all the organs in the human body, skin is the most dynamic organ, which is always in a constant state of change. The outer layer cells are being continuously shed and replaced by inner cells, which move up to the surface. There also exists vast variation in the thickness of skin based on its anatomical site, the age of the individual and environmental factors such as temperature and humidity. Besides, both geographical and seasonal variations affect its thickness considerably. In spite of all the factors, its structure is consistent throughout the whole body. All of the factors affect skin permeability, and thereby greatly influence transdermal drug delivery. Therefore, for optimising transdermal drug delivery, it requires a thorough understanding of the skin's impedance [7].
Skin impedance is one of the important aspects of bioimpedance and has been used to analyse the various information of the underlying tissues such as those related to moisture content, fat deposits and other related contents. However, as stated above, the thickness of skin varies greatly with the structure intact. To deal with the changing physiological stratification of the skin, various researchers have proposed various electrical equivalent models of skin. The best‐known models are Montague model, Tregear model and Lykken model. These models have been categorised as resistor‐capacitor (RC) layered models and are based on the layered nature of the skin [7]. The present investigation deals with the transfer function of the electrical equivalent model of human skin mainly the mentioned RC layered models for determining skin impedance. This includes an assessment of the various electrical parameters, which affect skin impedance value. This work also includes constant phase element (CPE) model, which categorises the biological characteristics of skin ignoring its layered nature [8, 9]. The purpose of the present work is to determine the difference between different levels of the Tregear model and study the effect of different sections and parallel paths of Lykken model and the difference between them. It also studies the difference between RC and CPE models on a parameter of distance measurement. Hausdorff distance is a mathematical construct to measure the ‘closeness’ of two sets of points that are subsets of a metric space [10, 11]. Therefore, techniques such as normal of derivative and Hausdorff distance are also used to study and understand the different curves. Efforts have been taken to compare all the models and obtain prospects for further integration of the models.
2 Methods and analysis of skin impedance model
Mammalian skin is one of the most important organs of the body. Therefore, for a clear understanding of the model of skin impedance, it is necessary to understand the anatomy of the skin and the routes of ion transport in the skin. Hence, a short description of human skin structure will be studied along with the different pathways of ion transport in skin, followed by the different models of skin impedance.
The flow of work and methodology adopted for the presented work are highlighted below for easy access:
(i) A concise study of the morphology of human skin and routes of ion transport through skin.
(ii) Study of the electrical equivalent model of skin (based on physiological stratification).
(iii) An insight into fractional ordered CPE‐based model for comparison with physiological stratification‐based models.
(iv) Use of transfer function for sensitivity analysis of each model.
(v) Assessment of electrical component parameters.
(vi) Simulation of Tregear model for various levels and study the difference between each level.
(vii) Simulation of Lykken model for different sections and parallel paths and study the effect of it on impedance plot.
(viii) Simulation of fractional ordered three‐element model with varying values of .
(ix) Comparison of Montague model against Tregear model, Lykken model and CPE‐based three‐element model using normal of derivative and Hausdorff distance.
2.1 Morphology of human skin
The skin is a multi‐layered organ composed of many histological layers mainly the epidermis and dermis [12] as shown in Fig. 1. It also includes some skin appendages in the horizontal direction such as sweat glands and hair follicles [14]. The epidermis is made up of keratinocyte (95% of cells), which is the principal cell forming ‘brick and mortar’ structure. This layer exhibits the barrier property of the skin [15]. The stratum corneum (SC) is the outer most layer of the epidermis with a thickness of about . It provides the main barrier between substances entering and moisture leaving the body. The SC has a moisture content of about 20%. Such structure and composition of SC imparts hydrophobic properties of skin [16]; this imparts skin a high impedance [17]. Also, saturated lipids such as ceramides, cholesterol and free fatty acids are another permeability barrier [18]. In conclusion, the physiological structure and hydrophobic properties of SC, greatly affect the evaluation of skin permeability and the measurement of skin impedance.
Fig. 1.
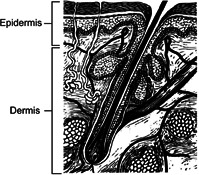
Structure of the dermis and epidermis. Figure adapted from Goldsmith [13]
Beneath the epidermal layer is the dermis, which is much thicker than the epidermis (usually 1–4 mm). The dermis is composed of collagen and elastic fibres. It has fewer cells and more of fibres as compared with epidermis [19]. The microvascular systems such as blood vessels, lymphatics, skin appendages and nervous system are found in this layer. Thus, blood vessel area increases with depth from the epidermal–dermal junction [20].
Hair follicle extends ∼ to the sebaceous duct from the surface of the skin. The sebaceous gland produces a lipophilic substance called sebum, which is composed of triglycerides, wax, squalene, cholesterol and lipids. Sebum protects skin against bacteria, excessive moisture and heat loss. Sweat glands root rises from the lower dermis up to the epidermis by a duct in diameter. It secretes water, which moisturises skin and lower body temperature through evaporation [14].
2.2 Routes of ion transport through skin
For a significant understanding of the physiological changes occurring in the skin concerning electrical parameters, the study of the transport mechanisms of charged ions in the skin would reveal significant details. Many researchers have studied and experimented with possible paths for transport of charged ions through the skin surface. Two main pathways: transappendageal and transcellular pathways have been reported in most research works. Transappendageal/follicular pathways include the hair follicles, sebaceous glands and sweat ducts, while transepidermal pathways result in movement around or across skin cells [21]. Transcellular/intracellular pathways are movements through cells while paracellular/intercellular pathways are movement around cells [22]. The transcellular and intercellular routes are collectively known as transepidermal route [23]. Fig. 2 shows the various penetration pathways in the skin.
Fig. 2.
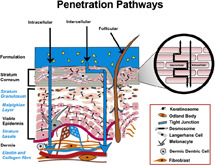
Penetration pathways in skin. Figure adapted from Alexander and Ajazuddin [24]
Various researchers have reported the following pathways:
(i) Pathway through epidermis is reported by Tregear [25].
(ii) Transcellular route/transepidermal pathway reported by Wahlberg (1968) [26].
(iii) Sweat ducts as pathway reported by Grimnes [27].
(iv) Transcellular, paracellular or appendageal pathways reported by Cullander [22].
(v) Transcellular route reported by Singh (1998) [28].
While considering the transepidermal pathways, the transport of ions in the dermis is similar to diffusion in aqueous medium [14]. Wherein, the aqueous medium offers main resistance while the blood vessel contraction and expansion assist in the transport process by providing both the driving force and as an ion source. Similar resistance is offered by an aqueous medium in the epidermis. From microscopic observation, it is observed that the intercellular pathways are the main pathway in SC [29]. However, because of the dense structure and hydrophobic nature of SC, ions move least easily. Thus, SC has the highest impedance as compared with the other two layers [30]. Therefore, the greatest barrier for ion transdermal transport is the SC.
In transappendageal pathways, ions bypass the resistances offered by SC. However, researchers are still unclear about the amount of ion transfer through this pathway [31].
2.3 Skin impedance models
Research has found that the skin impedance is dependent on frequency. Precisely, skin impedance and frequency are inversely related to each other. Resistance property is shown by hair follicles and sweat glands, whereas capacitance property is shown by the lipid bilayer [14]. Thus, it has been proved that the existence of a resistive component and a capacitive component in the case of human skin. Consequently, no quantity of inductance has ever been observed for the skin [32].
Various researchers have modelled and simulated skin impedance using combination circuits comprising of the resistor (R) and capacitance (C) values to develop a standard electrical equivalent model of skin. According to the literature, there are two categories of skin impedance models [7]:
(i) CPE model – emphasises on the biological characteristics of the skin.
(ii) RC layered model – considers the nature of physiological stratification.
The CPE model is based on the well known biological impedance model used by Cole in 1940 [33]. This model is based on the biological characteristics of the skin alone leaving its layered nature. Data fitted in the CPE model was found to be closer to the measured impedance spectrum than the RC model (simple RC circuit in parallel) [34]. However, considering the anisotropic property of skin, there is a variation in the biological and chemical properties in each layer of skin. Thus, the CPE model fails to express the electrical properties of skin considering its layered nature. However, as the human skin is a highly ordered multi‐layer organ, it is a particularly suitable model for the application of fractional calculus (FC) [35].
Various skin models are proposed by various researchers. The earliest skin impedance model was developed by Cole. The second model was proposed by Montague. This model was followed by Tregear model and Lykken model. Yamamoto and Yamamoto presented another model. Besides, there exist different skin impedance models with their own characteristics advantages and disadvantages. The three models of skin proposed by Montague, Tregear and Lykken are designed considering the hierarchical structure of skin; hence, they can be classified under RC layered model. The three‐element model proposed by Montague is the most widely used skin impedance model. Its popularity result from its ease of simulation, intuitive nature and its ability to provide a lumped parameter analysis [6].
2.3.1 Montague model
Montague developed an R–RC lumped parameter model of skin, which consists of two resistances and a dielectric capacitance. The parallel resistance and capacitance and , respectively, represent the resistance and capacitance of the SC. The series resistance represents the resistance of the deeper layers of the SC (Fig. 3). The literature defines various values for these components. However, early investigators determined that could range between to , whereas ranges from to [6].
Fig. 3.
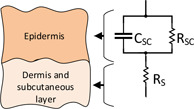
Montague electrical model for skin impedance
The transfer function for the Montague electrical equivalent circuit of skin is given by the equation below:
| (1) |
2.3.2 Tregear model
Montague model shows that the magnitude of the skin impedance decreases with increasing frequency. Research have shown that there is a variation in the skin impedance model components with increasing depth of the skin [36]. However, as the Montague model is based on fixed element values, so it fails to relate with the physiological systems, and thus have acquired properties of inaccuracies and inadequacies [6].
Through the method of tape stripping experiments, Tregear and others have found that as the individual layers of the SC are removed, there is a decrease in the values of the capacitance and resistance of the SC. These experiments have established that the SC alone is the largest contribution to the overall skin impedance and there exists a direct relationship that exists between the layers of the SC and skin impedance. Considering these facts, Tregear developed multiple parallel RC circuits in series to represent the changing capacitance and resistance of the epidermal skin layers. In this model, one single level consists of only three sections, which depicts different depths of the epidermal skin layer (Fig. 4). Each section comprises of resistance and capacitance . The more the number of levels is increased, more skin layers at varying depths are taken into consideration. Thus, this model captures the physiological phenomenon of varying capacitance and resistance values with increase in depth of the epidermis skin [36], which was not considered earlier in Montague model.
Fig. 4.
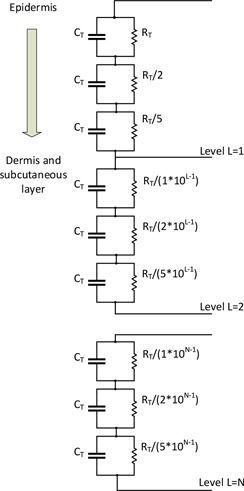
Skin impedance model provided by Tregear [36]
The transfer function for the Tregear electrical equivalent circuit of skin is given by the equation below:
| (2) |
Equation (2) describes the transfer function for level 1. However, when level 2 is also considered, the transfer function is defined by the equation below:
| (3) |
Subsequently (4) and (5) describe the transfer function for level 3 and level 4, respectively
| (4) |
| (5) |
2.3.3 Lykken model
Subsequently, with the addition of a series resistance between series RC stages, Lykken improved on the Tregear model. The series resistance represents the remaining deep tissue resistance even after removal of the entire epidermis [37]. Lykken model consists of several parallel paths and each path is made up of several RC circuits (herein called sections, made up of a parallel combination of resistance and capacitance in series with a series resistance ), wherein each section represents a different layer of the skin. This is shown in Fig. 5. According to Lykken, biased results are provided by the previous models because the bridge circuits used to measure skin impedance were inadvertently calibrated against certain circuit topologies [37]. Lykken model facilitates the contributions of various cell layers unlike the previous models [32]. Furthermore, his experiments show that the development of a more realistic model of skin impedance can avoid capacitive dependence on frequency [37]. He thus suggested using at least an R–RC–RC model for improved accuracy against the physiologic system [6].
Fig. 5.
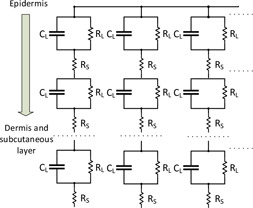
Skin impedance model provided by Lykken [37]
The transfer function for the Lykken electrical equivalent circuit of skin is given by the equation below:
| (6) |
Equation (6) describes the transfer function for the Lykken model with three parallel paths and three sections. Equations (7)–(10) describe the transfer function for three parallel paths and six sections; three parallel paths and nine sections; four parallel paths and three sections; and five parallel paths and three sections, respectively
| (7) |
| (8) |
| (9) |
| (10) |
2.3.4 Three‐element model
Kenneth Cole developed the skin impedance model as early as 1928 [38]. The electrical impedance properties of the skin can be attributed almost entirely to the SC. According to Cole, for most biological membranes, they are simply described by a parallel arrangement of resistor and capacitor and a series low resistor for inner tissues. In an ideal condition, a homogeneous membrane would have the same composition and structure in each region. This condition of the skin is well‐described by the physiological stratification‐based RC model with a single time constant (product of membrane capacitance and resistance). However, the skin is heterogeneous in structure and composition. Hence, each region would have different time constants [39]. A more accurate representation would be to replace the capacitor with a more general CPE, which can have capacitive, resistive and inductive properties [34].
The Cole impedance model was postulated in its final form in 1940 [40]. This Cole impedance model is based on replacing the ideal capacitor with the general element CPE [41] (Fig. 6). The impedance of the CPE is represented by , which is given by (11). represents a pseudocapacitor. It is an empirical function commonly used for impedance spectroscopy measurement. A is a constant representing the quasi‐capacitor impedance [42]. is related to the fractal dimension of the skin's surface and is regarded as the measure of the roughness of the skin's surface [43]. When , CPE behaves as a pure capacitor, when , it behaves as a pure resistor and when , it behaves as a pure inductor. Thus, a variation in the values of indicates its variation from ideality [39]. The variations in CPE will reflect the heterogeneity of skin by a distribution of time constants. represents the impedance of the parallel combination of resistor and CPE. Equation (12) represents the total impedance of the model and (13) represents the transfer function of the impedance model. Grimnes and Martinsen [8] have almost used the same model in their work. Besides, this model is used in most work for analysis [9, 42]. Hence, this model has been named as three‐element model
| (11) |
| (12) |
| (13) |
For the study of complex biological tissues and materials such as skin, multi‐frequency measurements and modelling of electrical impedance is an important spectroscopy method [35]. Biological membranes are known to have high capacitance and a low but complicated pattern of conductivity [40]. The highly layered system of human skin behaves as an anisotropic material because of its variable orientation of the cell. Therefore, the physical phenomena involved in considering the human skin as a system is of fractional order. FC can help a lot explaining such a system. FC helps in providing more accurate models of physical systems than ordinary calculus. The use of CPE can be further mathematically defined and generalised by impedance equations from the FC approach. Most works often report modelling of bioimpedance model using FC approach and experimental data fitting for human test systems [35]. To analyse the dynamic behaviour of a fractional system, it is required to use appropriate fractional derivatives. The definitions of the fractional order derivative are not unique and there exist several definitions including Grünwald–Letnikov, Riemann–Liouville, Weyl, Riesz and Caputo representation [41]. Gómez [41] prefer to use Caputo fractional derivative and fractional Laplace transform on the electrical impedance of Fig. 3. If , then overall impedance is given by
| (14) |
where is the fractional nature. If is a natural number, then it becomes integral in nature. When , the impedance reduces to that of an ideal RC circuit. The arbitrary constant can be considered its bioelectrical parameter. When , the model is reduced to the Cole model. has dimensions of seconds. The parameter is introduced to retain the consistency of units (dimensionality). Thus, considering the simplicity of introducing the CPE (13) and application of FC (14), both and must be of fractional order and not of integral nature.
Fig. 6.
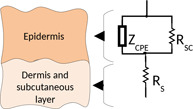
Three‐element model for skin impedance
2.4 Methodology
The transfer function analysis is a mathematical approach, which relates the system response to an input signal (or excitation). It is possible to find the zeros and poles from the ratio formed by the pattern of the output over the signal by input [44]. The equivalent electrical circuit of Montague model for skin is taken into consideration for the application of the general theory of transfer function to the skin type system.
The range for the values of the components of this equivalent circuit is as reported in the literature [6]. As known, human skin impedance changes in the most complex ways based on season, time, circumstances and ages. Also, it changes due to various factors both inside and outside the body in different periods of time. Considering these various factors, research have characterised human skin impedance with an impedance spectra [45, 46]. On the basis of the range of components available for Montague model and available impedance spectra, impedance plot can be plotted from the transfer function. The effect of the various components on the impedance plot can be studied from these plots.
As reported from the literature [6], the only range of various components and are available, which marks the range of these components for a great variety of evaluation of overall human skin impedance. Thus, for effective use of these ranges and to study the various skin impedance models effectively, a broad class of computational algorithms must be considered that rely on repeated random sampling to obtain numerical results. This has resorted in the use of Monte Carlo simulation. Monte Carlo simulation is a technique, which is used to study how a model responds to randomly generated inputs. It typically involves a three‐step process:
(i) Randomly generate ‘N’ inputs (sometimes called scenarios) from a given range of conditions.
(ii) Simulate for each of the ‘N’ inputs. Simulations are run on a computerised model of the system being analysed.
(iii) Aggregate and assess the outputs from the simulations. Common measures include the mean value of an output, the distribution of output values and the minimum or maximum output value.
Most of the simulations are performed using Monte Carlo simulations and the output measures: mean, maximum and minimum values are used extensively.
During the analysis of skin impedance models, it is required to consider the extent to which changes in system parameters (different types of R, C as described by different models) affect the behaviour of the model [47]. The degree to which changes in system parameters affect system transfer function, and hence performance is called sensitivity. Mathematically, sensitivity is the ratio of the fractional change in the function to the fractional change in the parameter as the fractional change of the parameter approaches zero [48]. Sensitivity analysis is performed for each of Montague model and Tregear model. However, as the Lykken model shares the basic structure of the Montague model, sensitivity analysis of Lykken model shares the same result with Montague model.
Equations (15)–(17) describe the sensitivity of Montague model for parameter components and , respectively
| (15) |
| (16) |
| (17) |
Equations (18) and (19) describe the sensitivity of Tregear model concerning parameter components and , respectively
| (18) |
| (19) |
where
| (20) |
| (21) |
| (22) |
3 Results and simulations
3.1 Sensitivity analysis of skin impedance models
Sensitivity analysis is performed for Montague model of skin impedance using (15)–(17) concerning parameter components and , respectively. Fig. 7 shows the simulation of the sensitivity of Montague model.
Fig. 7.
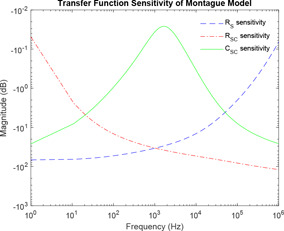
Sensitivity analysis of Montague model
Equations (18) and (19) represent the sensitivity of Tregear model of skin impedance concerning parameter components and , respectively. Fig. 8 shows the simulation of the sensitivity of Tregear model.
Fig. 8.
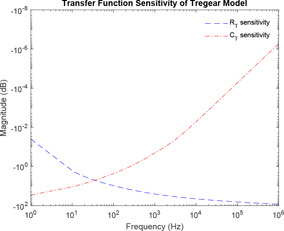
Sensitivity analysis of Tregear model
3.2 Simulations based on Montague model of skin impedance and impedance spectra
For simulation, * denotes the limiting of original impedance spectra as obtained from the research paper [45]. The presence of two * against each frequency indicates the boundary, i.e. upper and lower range of impedance for corresponding frequency as obtained from the research paper by Rosell. Fig. 9 attempts to show the Monte Carlo simulation of Montague model using component parameter ranges as obtained from the literature [6]. Impedance plot is plotted for frequency ranging from 1 Hz to 1 MHz. In the entire paper, frequency lesser than is referred to as lower frequency, whereas frequency higher than is referred to as higher frequency and the intermediate range between and is mid‐frequency. Fig. 10 shows the maximum and minimum boundaries of Montague impedance spectrum developed using Monte Carlo simulation for 100 runs. It has been observed that the simulation of Montague model using component parameter ranges as obtained from the literature could not be contained into the original impedance spectra as obtained from the research paper [45]. However, Prausnitz [46] has defined the range of those parameter value based on impedance spectra. The ranges are , and .
Fig. 9.
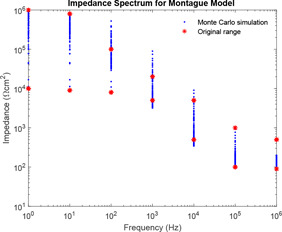
Combined impedance plot of impedance spectra as obtained from the literature
Fig. 10.
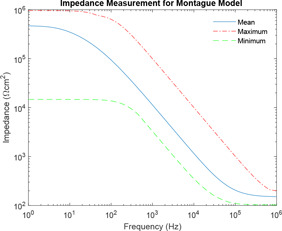
Combined impedance plot of impedance spectra and Montague circuit parameters
3.3 Simulation based on varying values of , and
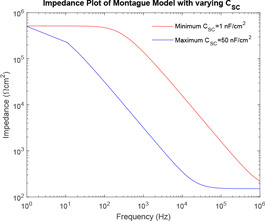
From Fig. 11, it can be observed that as the value of increases, the curve of impedance plot shifts to the left for the entire range of frequency.
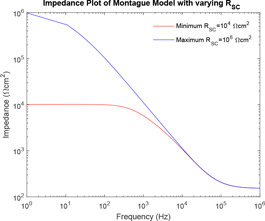
From Fig. 12, it can be observed that as the value of increases, the curve of impedance plot changes linearly for the entire range of frequency.
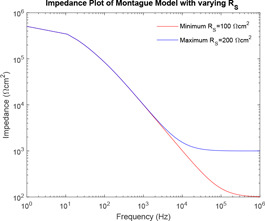
From Fig. 13, it can be observed that as the value of increases, the curve of impedance plot retains a constant mid‐impedance for the entire range of higher frequencies, which is practically impossible. However, for lower values of the curve of impedance plot changes linearly.
3.4 Simulation of Tregear model
Impedance plot is plotted for various levels of Tregear model using the range of component values as defined by Prausnitz. Fig. 14 shows the impedance plot for various combinations of , . It has been observed that as the number of level increases, the value of corresponding impedance increases for a given frequency.
Fig. 14.
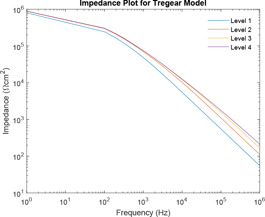
Impedance plot of Tregear model for different levels
Two distance calculator algorithms mainly normal of derivative and Hausdorff distance is used to compute the distance between level 1 and level 2, level 2 and level 3 and level 3 and level 4 which are shown by Figs. 15 and 16, respectively. In the graphs; ‘dist’ and ‘hd’ signify normal of derivative and Hausdorff distance, respectively, whereas the associated subscripts ‘12’, ‘23’ and ‘34’ refer to the distance between level 1 and level 2, level 2 and level 3 and level 3 and level 4, respectively. For each difference in levels, the respective maximum, minimum and mean are computed and difference is expressed in terms of points (Tables 1 and 2).
Fig. 15.
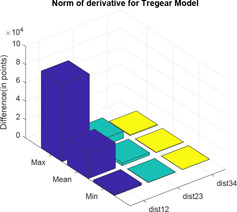
Normal of derivative of Tregear model for different levels
Fig. 16.
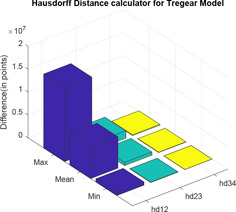
Hausdorff distance between different levels of Tregear model
Table 1.
Normal of derivative between different levels of Tregear model
| dist12 | dist23 | dist34 | |
|---|---|---|---|
| Max | 8.4349 × 10⁴ | 7.5745 × 10³ | 8.9013 × 10² |
| mean | 2.7885 × 10⁴ | 2.8515 × 10³ | 3.1816 × 10² |
| min | 2.4378 × 10³ | 2.8171 × 10² | 2.9319 × 101 |
Table 2.
Hausdorff distance between different levels of Tregear model
| hd12 | hd23 | hd34 | |
|---|---|---|---|
| max | 1.6162 × 10⁷ | 1.6162 × 10⁶ | 1.6162 × 10⁵ |
| mean | 6.8652 × 10⁶ | 6.8652 × 10⁵ | 6.8652 × 10⁴ |
| min | 7.0575 × 10⁵ | 7.0575 × 10⁴ | 7.0575 × 10³ |
3.5 Simulation of Lykken model
Impedance plot is plotted for various levels of Lykken model using the range of component values as defined by Prausnitz. Fig. 17 has been plotted for various combinations of , and . It has been observed that as the number of sections increases, the value of corresponding impedance increases for a given frequency.
Fig. 17.
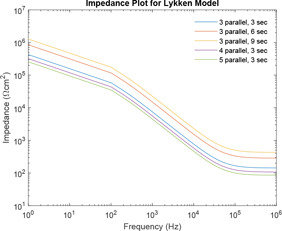
Impedance plot of Lykken model for varying numbers of sections and parallel paths
Here, again, two distance calculator algorithms are used to compute the distances between three parallel paths three sections and three parallel paths six sections; three parallel paths six sections and three parallel paths nine sections; three parallel paths three sections and four parallel paths three sections; and four parallel paths three sections and five parallel paths three sections, which are shown in Figs. 18 and 19. In the graphs; ‘dist’ and ‘hd’ signify normal of derivative and Hausdorff distance, respectively, whereas the associated subscripts ‘12’, ‘23’, ‘14’ and ‘45’ refer to the distance between three parallel paths three sections and three parallel paths six sections; three parallel paths six sections and three parallel paths nine sections; three parallel paths three sections and four parallel paths three sections; and four parallel paths three sections and five parallel paths three sections, respectively. For each difference in impedance curves, the respective maximum, minimum and mean is computed and the difference is expressed in terms of points (Tables 3 and 4).
Fig. 18.
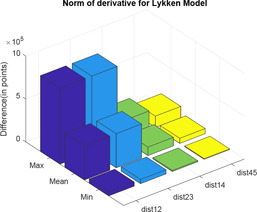
Normal of derivative between different impedance plots of Lykken model
Fig. 19.
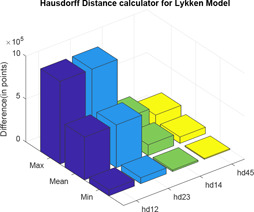
Hausdorff distance between different impedance plots of Lykken model
Table 3.
Normal of derivative between different impedance plots of Lykken model
| dist12 | dist23 | dist14 | dist45 | |
|---|---|---|---|---|
| max | 8.8324 × 10⁵ | 8.8324 × 10⁵ | 2.2081 × 10⁵ | 1.32 × 10⁵ |
| mean | 3.9705 × 10⁵ | 3.9705 × 10⁵ | 9.9264 × 10⁴ | 5.96 × 10⁴ |
| min | 4.9480 × 10⁴ | 4.9480 × 10⁴ | 1.2370 × 10⁴ | 7.42 × 10³ |
Table 4.
Hausdorff distance between different impedance plots of Lykken model
| hd12 | hd23 | hd14 | hd45 | |
|---|---|---|---|---|
| max | 9.6381 × 10⁵ | 9.6381 × 10⁵ | 2.4095 × 10⁵ | 1.45 × 10⁵ |
| mean | 4.9958 × 10⁵ | 4.9958 × 10⁵ | 1.2490 × 10⁵ | 7.49 × 10⁴ |
| min | 6.9123 × 10⁴ | 6.9123 × 10⁴ | 1.7281 × 10⁴ | 1.04 × 10⁴ |
3.6 Simulation of three‐element model
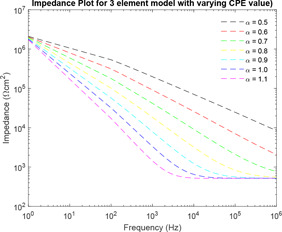
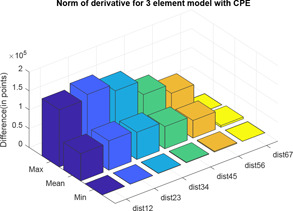
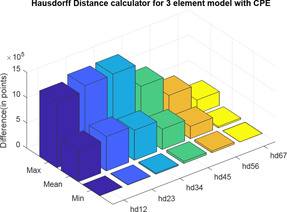
Impedance plot is plotted for various values of of the three‐element model using the range of component values as defined by Prausnitz in Fig. 20. It has been observed that as the value of increases from 0.5 to 1.1 with increment of 0.1, the value of corresponding impedance decreases for a given frequency.
Two distance calculator algorithms mainly normal of derivative and Hausdorff distance are used to compute the distance between impedance plots with values 0.5 and 0.6, 0.6 and 0.7, 0.7 and 0.8, 0.8 and 0.9, 0.9 and 1.0, 1.0 and 1.1, which are shown in Figs. 21 and 22, respectively. In the graphs, ‘dist’ and ‘hd’ signify normal of derivative and Hausdorff distance, respectively, whereas the associated subscripts ‘12’, ‘23’, ‘34’, ‘45’, ‘56’ and ‘67’ refer to the distance between varying values of as mentioned above. For each difference in levels, the respective maximum, minimum and mean are computed and difference is expressed in terms of points (Tables 5 and 6).
Table 5.
Normal of derivative between different impedance plots of varying value
| dist12 | dist23 | dist34 | dist45 | dist56 | dist67 | |
|---|---|---|---|---|---|---|
| max | 1.5 × 10⁵ | 1.6 × 10⁵ | 1.4 × 10⁵ | 1.0 × 10⁵ | 8.1 × 10⁴ | 0 |
| mean | 7.2 × 10⁴ | 7.7 × 10⁴ | 7.2 × 10⁴ | 5.8 × 10⁴ | 4.6 × 10⁴ | 4.7 × 10³ |
| min | 1.5 × 10² | 3.5 × 10² | 7.4 × 10² | 1.2 × 10³ | 2.1 × 10³ | 0 |
Table 6.
Hausdorff distance between different impedance plots of varying value
| hd12 | hd23 | hd34 | hd45 | hd56 | hd67 | |
|---|---|---|---|---|---|---|
| max | 1.3 × 10⁶ | 1.4 × 10⁶ | 1.4 × 10⁶ | 9.7 × 10⁵ | 5.8 × 10⁵ | 2.7 × 10⁵ |
| mean | 6.2 × 10⁵ | 6.8 × 10⁵ | 5.9 × 10⁵ | 4.0 × 10⁵ | 2.4 × 10⁵ | 2.7 × 10⁴ |
| min | 3.6 × 10³ | 8.4 × 10³ | 2.1 × 10⁴ | 4.2 × 10⁴ | 3.5 × 10⁴ | 0 |
3.7 Comparative impedance plot of the models
Comparative plot of impedance curves has been made in Figs. 23 and 24 between Montague and Tregear models and Montague and Lykken models, respectively. In Fig. 23, impedance curve is plotted for the Montague model along with four levels of Tregear model. While in Fig. 24, impedance curve is plotted for Montague model along with five combinations of sections and parallel paths of Lykken model.
Fig. 23.
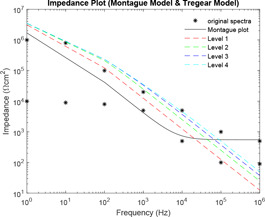
Comparative impedance plot of Montague model and Tregear model
Fig. 24.
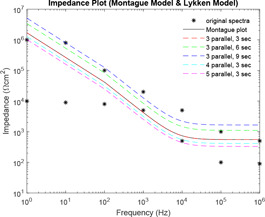
Comparative impedance plot of Montague model and Lykken model
Here, also, two distance calculator algorithms are used to compute the distance of the four levels of Tregear model and five combinations of sections and parallel paths of Lykken model from the Montague model (Figs. 25 and 26). For each difference in impedance curves, the respective maximum, minimum and mean are computed and difference is expressed in terms of points (Tables 7 and 8).
Fig. 25.
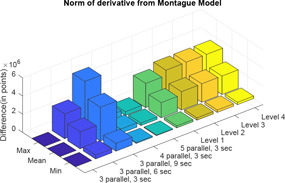
Normal of derivative of Tregear and Lykken model impedance plot from Montague model
Fig. 26.
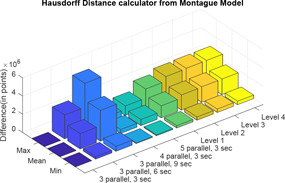
Hausdorff distance calculator of Tregear and Lykken model impedance plot from Montague model
Table 7.
Normal of derivative of Tregear and Lykken model impedance plot from Montague model
| Max | Mean | Min | |
|---|---|---|---|
| three parallel, 3 s | 0 | 0 | 0 |
| three parallel, 6 s | 2.7241 × 10⁶ | 1.8592 × 10⁶ | 4.2697 × 10⁵ |
| three parallel, 9 s | 5.4482 × 10⁶ | 3.7184 × 10⁶ | 8.5394 × 10⁵ |
| four parallel, 3 s | 6.8102 × 10⁵ | 4.6480 × 10⁵ | 1.0674 × 10⁵ |
| five parallel, 3 s | 4.0861 × 10⁵ | 2.7888 × 10⁵ | 6.4045 × 10⁴ |
| level 1 | 2.6686 × 10⁶ | 1.6642 × 10⁶ | 2.2945 × 10⁵ |
| level 2 | 3.2690 × 10⁶ | 2.0168 × 10⁶ | 2.5890 × 10⁵ |
| level 3 | 3.2925 × 10⁶ | 2.0329 × 10⁶ | 2.6249 × 10⁵ |
| level 4 | 3.2960 × 10⁶ | 2.0352 × 10⁶ | 2.6288 × 10⁵ |
Table 8.
Hausdorff distance calculator of Tregear and Lykken model impedance plot from Montague model
| Max | Mean | Min | |
|---|---|---|---|
| three parallel, 3 s | 0 | 0 | 0 |
| three parallel, 6 s | 2.6201 × 10⁶ | 1.6880 × 10⁶ | 2.7245 × 10⁵ |
| three parallel, 9 s | 5.2401 × 10⁶ | 3.3760 × 10⁶ | 5.4490 × 10⁵ |
| four parallel, 3 s | 6.5502 × 10⁵ | 4.2200 × 10⁵ | 6.8113 × 10⁴ |
| five parallel, 3 s | 1.0480 × 10⁶ | 6.7520 × 10⁵ | 1.0898 × 10⁵ |
| level 1 | 2.0534 × 10⁶ | 1.3203 × 10⁶ | 2.5664 × 10⁵ |
| level 2 | 2.5639 × 10⁶ | 1.6614 × 10⁶ | 3.5660 × 10⁵ |
| level 3 | 2.6179 × 10⁶ | 1.7020 × 10⁶ | 3.7244 × 10⁵ |
| level 4 | 2.6239 × 10⁶ | 1.7067 × 10⁶ | 3.7348 × 10⁵ |
Comparative plot of impedance curves has been made in Fig. 27 between Montague and three‐element models. This comparative plot (Fig. 27) has been made separate from the above two plots because the plots of Figs. 23 and 24 are based on impedance models, which relay on the physiological stratification of skin. However, in Fig. 27, comparison is done for Montague model with impedance plots of model based on CPE and fractional orders.
Fig. 27.
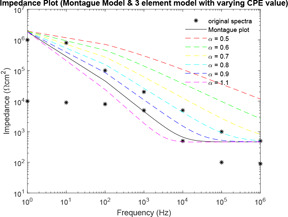
Comparative impedance plot of Montague model and three‐element model
Here, also, two distance calculator algorithms are used to compute the distance of three‐element model with varying values from the Montague model. In the three‐element model, when , it becomes a model of integral order. Therefore, when , CPE will behave as a pure capacitor and the three‐element model will be same as the Montague model. For each difference in impedance curves, the respective maximum, minimum and mean are computed and difference is expressed in terms of points (Tables 9 and 10) (Figs. 28 and 29).
Table 9.
Normal of derivative of varying values of three‐element model impedance plot from Montague model
| Max | Mean | Min | ||
|---|---|---|---|---|
|
|
1.6974 × 10⁶ | 5.8030 × 10⁵ | 1.3827 × 10⁵ | |
|
|
1.0982 × 10⁶ | 3.8427 × 10⁵ | 7.5257 × 10⁴ | |
|
|
6.5891 × 10⁵ | 2.5753 × 10⁵ | 6.7797 × 10⁴ | |
|
|
3.6699 × 10⁵ | 1.6210 × 10⁵ | 4.1702 × 10⁴ | |
|
|
1.6595 × 10⁵ | 8.0437 × 10⁴ | 2.9909 × 10⁴ | |
|
|
1.7114 × 10⁵ | 9.0517 × 10⁴ | 2.5617 × 10⁴ |
Table 10.
Hausdorff distance calculator of varying values of three‐element model impedance plot from Montague model
| Max | Mean | Min | ||
|---|---|---|---|---|
|
|
8.3706 × 10⁶ | 4.1676 × 10⁶ | 1.3790 × 10⁶ | |
|
|
3.0780 × 10⁶ | 1.5430 × 10⁶ | 5.4087 × 10⁵ | |
|
|
1.2537 × 10⁶ | 6.4411 × 10⁵ | 2.3760 × 10⁵ | |
|
|
5.1427 × 10⁵ | 2.7566 × 10⁵ | 9.8463 × 10⁴ | |
|
|
1.7965 × 10⁵ | 1.0001 × 10⁵ | 3.5097 × 10⁴ | |
|
|
1.5391 × 10⁵ | 7.8639 × 10⁴ | 2.9177 × 10⁴ |
Fig. 28.
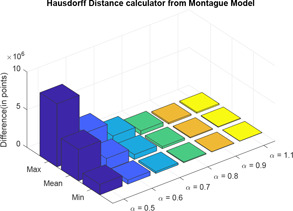
Normal of derivative of three‐element model impedance plot from Montague model
Fig. 29.
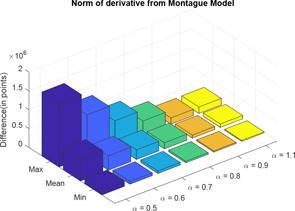
Hausdorff distance calculator of three‐element model impedance plot from Montague model
4 Discussion
The hydrophobic nature and the complex structure of SC imparts it the highest impedance as compared with the other layers of the skin. In addition, it has been found that the skin impedance is frequency dependent. In the classification of various skin models, RC layered model is the most profound as it considers the nature of physiological stratification. The three models of skin proposed by Montague, Tregear and Lykken are designed considering the hierarchical structure of the skin; hence, they can be classified under RC layered model. Out of these three models, Montague is the most widely used representation of the human skin's impedance. The CPE model is the modified form of traditional RC model, which takes into account the biological characteristics of the skin while ignoring the layered nature of the skin. The RC models are of the nature of integral order; however, CPE model is of fractional order nature.
Montague developed an R–RC lumped parameter model of skin, which consists of two resistances and a dielectric capacitance. Tregear developed this model by including multiple parallel RC circuits in series to represent the changing capacitance and resistance of the epidermal skin layers. Lykken further improved the Tregear model by adding a series resistance between series RC stages. From these frequently used electrical equivalent models of skin impedance, it is required to study the extent to which changes in system parameters (different types of R, C as described by different models) affect the behaviour of the models.
In this paper, all studies on the model are carried out considering its transfer function. Monte Carlo simulation is extensively used for effective use of the ranges of component parameters as obtained from the literature. This is required because all simulations rely on repeated random sampling to obtain numerical results. Sensitivity analysis is performed for each of Montague model and Tregear model. As the Lykken model has the basic structure of the Montague model, sensitivity analysis of Lykken model is the same with Montague model. For the Montague and Lykken model, has high sensitivity at lower frequencies, while has high sensitivity at higher frequencies. At mid‐frequencies and have the same sensitivities. However, has high sensitivity at mid‐frequencies and decreases at lower and higher frequencies giving it a bell‐shaped curve. For Tregear model, has high sensitivity at lower frequencies while has high sensitivity at higher frequencies. This implies, hair follicles and sweat glands of human skin greatly affect skin impedance at lower frequencies, whereas the deeper tissues have a high effect on skin impedance at higher frequencies. Thus, SC layer offers the highest impedance at lower frequencies. Proper stripping of the skin surface off oil and dirt can significantly stabilise impedance values at lower frequency. The existence of lipid bilayer imparts hydrophobic nature to SC, which comes into play at mid‐frequency range.
In the study of the effect of the individual system parameters effect on the behaviour of the models, it has been observed that as the value of increases, the curve of impedance plot changes linearly for the entire range of frequency. However, for lower values of , the curve of impedance plot remains at a constant low impedance for a wider range of lower frequencies, which is practically impossible. As the value of increases, the curve of impedance plot retains a constant mid‐impedance for the entire range of higher frequencies, which is practically impossible. However, for lower values of , the curve of impedance plot changes linearly. Moreover, as increases, the curve of impedance plot shifts to the left for an entire range of frequency. Now, this study of the effect of the individual system parameters is supported by the respective sensitivity analysis. At lower frequencies, has high sensitivity, a lower value of would give rise to a practically impossible impedance plot. At higher frequencies, has high sensitivity, a higher value of would also give rise to a practically impossible impedance plot.
In the impedance plot of Tregear model for various levels, it has been observed that as the number of levels increases, the value of corresponding impedance increases for a given frequency. However, after a certain increase in level, the impedance plot of levels almost merges. At best, all higher levels can be considered as having the same impedances for corresponding frequencies. So Tregear model can be considered up to only level 3. This is supported by the use of two distance calculator algorithms normal of derivative and Hausdorff distance. These algorithms are individually used to compute the distance between level 1 and level 2, level 2 and level 3 and level 3 and level 4. For each difference in levels, the respective maximum value, minimum value and mean value are computed and the difference expressed in terms of points. It is observed that in each of the distance calculator algorithms, with an increase in levels, the distance between the levels minimises almost in powers of ten.
Similarly, the impedance curve is plotted for various combinations of , and of the Lykken model. It has been observed that as the number of sections increases, the value of corresponding impedance increases for a given frequency. However, the increase in parallel path decreases the value of corresponding impedance for a given frequency. Hence, an increase in the section with the increase in parallel path compensates each other. So Lykken model can be considered best with an equal number of parallel paths and sections. Further increase in parallel paths and sections serves no purpose. This is also supported by the use of two distance calculator algorithms. As the number of section increases in multiples of three, the distance between the impedance curves is same, whereas the increase in parallel paths increases the distance by multiples of 1.6.
For the three‐element model, as the value of fractional order increases from 0.5 with increment of 0.1 order, the distance between the impedance plots almost remains same with slightest decrease in distance from the previous values. However, considering for human skin, with best vary from 0.7 to 0.9.
Tables 11 and 12 show the normalised distance of Tregear, Lykken and three‐element model's impedance plot from Montague model using two distance calculator algorithms normal of derivative and Hausdorff distance, respectively. Normalisation has been performed on the derived distances in the simulations to bring all distance in one level, which can be readily understandable and interpretable.
Table 11.
Normalisation of normal of derivative distance of Tregear, Lykken and three‐element model's impedance plot from Montague model
| Max | Mean | Min | ||
|---|---|---|---|---|
| three parallel, 3 s | 0.00 | 0.00 | 0.00 | |
| three parallel, 6 s | 10.50 | 11.90 | 15.01 | |
| three parallel, 9 s | 21.00 | 23.80 | 30.03 | |
| four parallel, 3 s | 2.62 | 2.97 | 3.75 | |
| five parallel, 3 s | 1.57 | 1.78 | 2.25 | |
| level 1 | 10.28 | 10.65 | 8.07 | |
| level 2 | 12.60 | 12.91 | 9.10 | |
| level 3 | 12.69 | 13.01 | 9.23 | |
| level 4 | 12.70 | 13.02 | 9.24 | |
|
|
6.54 | 3.71 | 4.86 | |
|
|
4.23 | 2.46 | 2.65 | |
|
|
2.54 | 1.65 | 2.38 | |
|
|
1.41 | 1.04 | 1.47 | |
|
|
0.64 | 0.51 | 1.05 | |
|
|
0.66 | 0.58 | 0.90 |
Table 12.
Normalisation of Hausdorff distance calculator of Tregear, Lykken and three‐element model's impedance plot from Montague model
| Max | Mean | Min | ||
|---|---|---|---|---|
| three parallel, 3 s | 0.00 | 0.00 | 0.00 | |
| three parallel, 6 s | 7.95 | 8.72 | 5.83 | |
| three parallel, 9 s | 15.89 | 17.44 | 11.66 | |
| four parallel, 3 s | 1.99 | 2.18 | 1.46 | |
| five parallel, 3 s | 3.18 | 3.49 | 2.33 | |
| level 1 | 6.23 | 6.82 | 5.49 | |
| level 2 | 7.78 | 8.58 | 7.63 | |
| level 3 | 7.94 | 8.79 | 7.97 | |
| level 4 | 7.96 | 8.82 | 7.99 | |
|
|
25.39 | 21.53 | 29.50 | |
|
|
9.34 | 7.97 | 11.57 | |
|
|
3.80 | 3.33 | 5.08 | |
|
|
1.56 | 1.42 | 2.11 | |
|
|
0.54 | 0.52 | 0.75 | |
|
|
0.47 | 0.41 | 0.62 |
Finally, both Tregear, Lykken model and three‐element model is compared against Montague model. With increase in levels for Tregear model, the distance of the Tregear impedance plot from Montague plot remains almost constant. Thus, Tregear model can be considered for analysis up to a maximum of level 3. The shape of the impedance curves for all combinations of Lykken model is same as that of the Montague model because the transfer function of both the models is same along with some multiplication factor for Lykken model only. The distance of three sections and three parallel path combination of Lykken model is zero from Montague model as both the models are same. With an increase in the number of sections, the impedance curves shifts above the Montague model curve and with an increase in the parallel path the impedance curve shifts below the Montague model curve. Thus, an increase in parallel path and increase in section compensates each other. In the three‐element model, the values of varying between 0.7 and 0.9, the impedance plots has the least difference from Montague model (compared with the distance between Montague and other models).
An experimental study of the impedance characteristics of skin would enhance the optimisation of skin impedance models and its usage.
5 Conclusion
The structure of the skin could be divided into three layers. The different measured impedance data reflects the specific changes in each specific layer in its equivalent electric model. This would further ease our understanding of the physiological structural changes of the skin. However, it is known that human skin impedance changes in the most complex ways based on season, time, circumstances and age. In addition, it changes due to various factors both inside and outside the body in different periods. Thus, it is increasingly difficult and complex to model the human skin. The best effort is to find the most befitting model that can reflect these changes and yet be simple in consideration.
This work presents a comparative analysis between three electrical equivalent circuits based model of human skin impedance, namely Montague model, Tregear model and Lykken model. In addition, a comparison is also performed between the RC and CPE‐based models. Out of these three models based on physiological stratification, Montague model is widely used considering its simplicity over other models. The impedance plot of Montague model depicts the frequency‐dependent response of the skin, wherein the magnitude of the skin impedance decreases with increasing frequency as observed from all the plots. It can be observed that higher values of and lower values of play an important role in shaping the impedance plot to keep it in line with impedance spectra. During repeated impedance measurement for the same patch of skin under different conditions, these findings can immensely predict which component of the Montague model is affected during the period of data acquisition. The impedance of Tregear model has been observed up to level 4 and has been found almost constant impedance level after level 3. Impedance of Lykken model has been observed up to five parallel paths and nine sections. From the various observations made in the impedance plot, Montague model is found to be similar to Tregear model until frequency . Moreover, Lykken model with three parallel paths and three sections is completely equivalent to the Montague model. It can be commented that out of the above observations, Tregear model at level 3 can be used for establishing the electrical equivalent model of human skin due to its simplicity and comprising of two circuit components only.
While considering the CPE‐based model, lies between 0.7 and 0.9 for most tissues and interfaces [49]. This has also been observed in the simulation. The value of is considered to be 0.8 for common human skin [42], which basically (but not pure) corresponds to a capacitive circuit element [39]. Thus, CPE‐based model with is identical with RC‐based Montague model. The simulations obtained from fractional representation can provide a better description of a system than those obtained with integral order. However, this study suggests that a new model can be constructed by combining the characteristics of the two categories of skin impedance model (CPE model and RC layered model) that reflects the nature of physiological stratification and biological properties of the skin. An experimental study is further required for more complete clarity of the impedance characteristics of the complex nature of the skin. The use of an equivalent circuit model to represent any biological tissues or interfaces, can accomplish potential sources of error as biological tissues and samples are of anisotropic nature. Any changes in the positioning of elements in any model can have a major effect on the validity of the calculated values of the element and the model as a whole. Therefore, effort must be given to consider simpler continuum models, which seek to represent and understand observed phenomena [49]. Such models can be developed only after extensive study of the system under different conditions. It will also immensely help in the analysis of skin type of concerned subjects from impedance plots. An experimental study is further required for a more complete clarity of the impedance characteristics of the complex nature of the skin. This study will help in choice of a particular skin impedance models for experimental data fitting in human skin test subjects. This analysis will also find applications in skin hydration, tissue classification, tissue monitoring, electrical impedance monitoring, a study of transdermal drug delivery etc.
6 References
- 1. Guy R.H.: ‘Current status and future prospects of transdermal drug delivery’, Pharm. Res., 1996, 13, (12), pp. 1765–1769 [DOI] [PubMed] [Google Scholar]
- 2. Guy R.H., and Hadgraft J.: ‘Transdermal drug delivery: a perspective’, J. Control. Release, 1987, 4, (4), pp. 237–251 [Google Scholar]
- 3. Sachan R., and Bajpai M.: ‘Transdermal drug delivery system: a review’, 2013.
- 4. Riviere J.E., and Heit M.C.: ‘Electrically assisted transdermal drug delivery’, Pharm. Res., 1997, 14, (6), pp. 687–697 [DOI] [PubMed] [Google Scholar]
- 5. Kinouchi Y., Iritani T., and Morimoto T. et al.: ‘Fast in vivo measurements of local tissue impedances using needle electrodes’, Med. Biol. Eng. Comput., 1997, 35, (5), pp. 486–492 [DOI] [PubMed] [Google Scholar]
- 6. Coston A.F., and Li J.‐J.: ‘Transdermal drug delivery: a comparative analysis of skin impedance models and parameters’. Engineering in Medicine and Biology Society 2003 Proc. 25th Annual Int. Conf. e IEEE, Cancun, Mexico, 2003, vol. 3, pp. 2982–2985 [Google Scholar]
- 7. Lu F., Wang C., and Zhao R. et al.: ‘Review of stratum corneum impedance measurement in non‐invasive penetration application’, Biosensors, 2018, 8, (2), p. 31 [DOI] [PMC free article] [PubMed] [Google Scholar]
- 8. Grimnes S., and Martinsen O.G.: ‘Cole electrical impedance model – a critique and an alternative’, IEEE Trans. Biomed. Eng., 2004, 52, (1), pp. 132–135 [DOI] [PubMed] [Google Scholar]
- 9. Kalia Y.N., and Guy R.H.: ‘The electrical characteristics of human skin in vivo ’, Pharm. Res., 1995, 12, (11), pp. 1605–1613 [DOI] [PubMed] [Google Scholar]
- 10. Aronov B., Har‐Peled S., and Knauer C. et al.: ‘Fréchet distance for curves, revisited’. European Symp. Algorithms, Berlin, Heidelberg, 2006, pp. 52–63 [Google Scholar]
- 11. Wylie T.R.: ‘The discrete Fréchet distance with applications’. PhD dissertation, Montana State University‐Bozeman, College of Engineering, 2013. [Google Scholar]
- 12. Lai‐Cheong J.E., and McGrath J.A.: ‘Structure and function of skin, hair and nails’, Medicine, 2009, 37, (5), pp. 223–226 [Google Scholar]
- 13. Odland G., and Goldsmith I.: ‘Physiology, biochemistry and molecular biology of the skin’, 1991.
- 14. Jepps O.G., Dancik Y., and Anissimov Y.G. et al.: ‘Modeling the human skin barrier – towards a better understanding of dermal absorption’, Adv. Drug Deliv. Rev., 2013, 65, (2), pp. 152–168 [DOI] [PubMed] [Google Scholar]
- 15. Candi E., Schmidt R., and Melino G.: ‘The cornified envelope: a model of cell death in the skin’, Nat. Rev. Mol. Cell Biol., 2005, 6, (4), pp. 328–340 [DOI] [PubMed] [Google Scholar]
- 16. White E.A., Horne A., and Runciman J. et al.: ‘On the correlation between single‐frequency impedance measurements and human skin permeability to water’, Toxicol. In Vitro, 2011, 25, (8), pp. 2095–2104 [DOI] [PubMed] [Google Scholar]
- 17. Ventrelli L., Marsilio Strambini L., and Barillaro G.: ‘Microneedles for transdermal biosensing: current picture and future direction’, Adv. Healthcare Mater., 2015, 4, (17), pp. 2606–2640 [DOI] [PubMed] [Google Scholar]
- 18. Wertz P.W.: ‘Lipids and barrier function of the skin’, Acta Derm. Venereol., 2000, 208, pp. 7–11 [DOI] [PubMed] [Google Scholar]
- 19. Igarashi T., Nishino K., and Nayar S.K. et al.: ‘The appearance of human skin: a survey’, Found. Trends® Comput. Graph. Vis., 2007, 3, (1), pp. 1–95 [Google Scholar]
- 20. Huclova S., Baumann D., and Talary M.S. et al.: ‘Sensitivity and specificity analysis of fringing‐field dielectric spectroscopy applied to a multi‐layer system modelling the human skin’, Phys. Med. Biol., 2011, 56, (24), p. 7777 [DOI] [PubMed] [Google Scholar]
- 21. Coston A.F., and Li J.K.‐J.: ‘Iontophoresis: modeling, methodology, and evaluation’, Cardiovasc. Eng. Int. J., 2001, 1, (3), pp. 127–136 [Google Scholar]
- 22. Cullander C.: ‘What are the pathways of iontophoretic current flow through mammalian skin?’, Adv. Drug Deliv. Rev., 1992, 9, (2–3), pp. 119–135 [Google Scholar]
- 23. Pathan I.B., and Setty C.M.: ‘Chemical penetration enhancers for transdermal drug delivery systems’, Trop. J. Pharm. Res., 2009, 8, (2), pp. 173–179 [Google Scholar]
- 24. Alexander A., Dwivedi S., and Giri T.K. et al.: ‘Approaches for breaking the barriers of drug permeation through transdermal drug delivery’, J. Control. Release, 2012, 164, (1), pp. 26–40 [DOI] [PubMed] [Google Scholar]
- 25. Tregear R.: ‘Interpretation of skin impedance measurements’, Nature, 1965, 205, (4971), pp. 600–601 [Google Scholar]
- 26. Wahlberg J.E.: ‘Transepidermal or transfollicular absorption? in vivo and in vitro studies in hairy and non‐hairy Guinea pig skin with sodium (22na) and mercuric (203hg) chlorides’, Acta Derm. Venereol., 1967, 48, (4), pp. 336–344 [PubMed] [Google Scholar]
- 27. Grimnes S.: ‘Pathways of ionic flow through human skin in vivo ’, Acta Derm. Venereol., 1984, 64, (2), pp. 93–98 [PubMed] [Google Scholar]
- 28. Singh J., and Roberts M.: ‘Transdermal delivery of drugs by iontophoresis: a review’, Drug. Des. Deliv., 1989, 4, (1), pp. 1–12 [PubMed] [Google Scholar]
- 29. Siddiqui O., Roberts M., and Polack A.: ‘Percutaneous absorption of steroids: relative contributions of epidermal penetration and dermal clearance’, J. Pharmacokinet. Biopharm., 1989, 17, (4), pp. 405–424 [DOI] [PubMed] [Google Scholar]
- 30. Scheuplein R.J., and Blank I.H.: ‘Permeability of the skin’, Physiol. Rev., 1971, 51, (4), pp. 702–747 [DOI] [PubMed] [Google Scholar]
- 31. Elias P.M., and Friend D.S.: ‘The permeability barrier in mammalian epidermis’, J. Cell Biol., 1975, 65, (1), pp. 180–191 [DOI] [PMC free article] [PubMed] [Google Scholar]
- 32. Edelberg R.: ‘Biophysical properties of the skin, elden hr, editor’, 1971.
- 33. McAdams E., and Jossinet J.: ‘Tissue impedance: a historical overview’, Physiol. Meas., 1995, 16, (3A), p. A1 [DOI] [PubMed] [Google Scholar]
- 34. Kontturi K., Murtomäki L., and Hirvonen J. et al.: ‘Electrochemical characterization of human skin by impedance spectroscopy: the effect of penetration enhancers’, Pharm. Res., 1993, 10, (3), pp. 381–385 [DOI] [PubMed] [Google Scholar]
- 35. Vosika Z.B., Lazovic G.M., and Misevic G.N. et al.: ‘Fractional calculus model of electrical impedance applied to human skin’, PloS One, 2013, 8, (4), p. e59483 [DOI] [PMC free article] [PubMed] [Google Scholar]
- 36. Tregear R.T.: ‘Physical functions of skin’, vol. 5 (Academic Press, New York, USA, 1966) [Google Scholar]
- 37. Lykken D.T.: ‘Square‐wave analysis of skin impedance’, Psychophysiology, 1970, 7, (2), pp. 262–275 [DOI] [PubMed] [Google Scholar]
- 38. Cole K.S.: ‘Electric impedance of suspensions of spheres’, J. Gen. Physiol., 1928, 12, (1), pp. 29–36 [DOI] [PMC free article] [PubMed] [Google Scholar]
- 39. Gratieri T., and Kalia Y.N.: ‘Mathematical models to describe iontophoretic transport in vitro and in vivo and the effect of current application on the skin barrier’, Adv. Drug Deliv. Rev., 2013, 65, (2), pp. 315–329 [DOI] [PubMed] [Google Scholar]
- 40. Cole K.S.: ‘Permeability and impermeability of cell membranes for ions’, in (Eds.): ‘Cold Spring Harbor symposia on quantitative biology’, vol. 8 (Cold Spring Harbor Laboratory Press, New York, USA, 1940), pp. 110–122 [Google Scholar]
- 41. Gómez F., Bernal J., and Rosales J. et al.: ‘Modeling and simulation of equivalent circuits in description of biological systems – a fractional calculus approach’, J. Electr. Bioimpedance, 2012, 3, (1), pp. 2–11 [Google Scholar]
- 42. Hirschorn B., Orazem M.E., and Tribollet B. et al.: ‘Determination of effective capacitance and film thickness from constant‐phase‐element parameters’, Electrochim. Acta, 2010, 55, (21), pp. 6218–6227 [Google Scholar]
- 43. Kim M.S., Cho Y., and Seo S.‐T. et al.: ‘A new method for non‐invasive measurement of skin in the low frequency range’, Healthc. Inf. Res., 2010, 16, (3), pp. 143–148 [DOI] [PMC free article] [PubMed] [Google Scholar]
- 44. Dorf R., Dorf R.C., and Svoboda J.A.: ‘Circuitos eléctricos: introducción al análisis y diseño’ (Marcombo, Barcelona, Spain, 2000) [Google Scholar]
- 45. Rosell J., Colominas J., and Riu P. et al.: ‘Skin impedance from 1 Hz to 1 MHz’, IEEE Trans. Biomed. Eng., 1988, 35, (8), pp. 649–651 [DOI] [PubMed] [Google Scholar]
- 46. Prausnitz M.R.: ‘The effects of electric current applied to skin: a review for transdermal drug delivery’, Adv. Drug Deliv. Rev., 1996, 18, (3), pp. 395–425 [Google Scholar]
- 47. Zi Z.: ‘Sensitivity analysis approaches applied to systems biology models’, IET Syst. Biol., 2011, 5, (6), pp. 336–346 [DOI] [PubMed] [Google Scholar]
- 48. Nise N.S.: ‘Control system engineering’ (John Wiley & Sons, Inc., New York, 2011) [Google Scholar]
- 49. McAdams E., and Jossinet J.: ‘Problems in equivalent circuit modelling of the electrical properties of biological tissues’, Bioelectrochem. Bioenerg., 1996, 40, (2), pp. 147–152 [Google Scholar]


