

Abstract
The maintenance of the diverse cell types in a multicellular organism is one of the fundamental mysteries of biology. Modelling the dynamic regulatory relationships between the histone modifications and the gene expression across the diverse cell types is essential for the authors to understand the mechanisms of the epigenetic regulation. Here, the authors thoroughly assessed the histone modification enrichment profiles at the promoters and constructed quantitative models between the histone modification abundances and the gene expression in 12 human cell types. The author's results showed that the histone modifications at the promoters exhibited remarkably cell‐type‐dependent variability in the cell‐type‐specific (CTS) genes. They demonstrated that the variable profiles of the modifications are highly predictive for the dynamic changes of the gene expression across all the cell types. Their findings revealed the close relationship between the combinatorial patterns of the histone modifications and the CTS gene expression. They anticipate that the findings and the methods they used in this study could provide useful information for the future studies of the regulatory roles of the histone modifications in the CTS genes.
Inspec keywords: cellular biophysics, genetics, genomics, physiological models, proteins
Other keywords: CTS gene expression, variable profiles, cell‐type‐dependent variability, histone modification abundances, constructed quantitative models, promoters, histone modification enrichment profiles, dynamic regulatory relationship modelling, biology, multicellular organism, cell‐type‐specific genes, combinatorial patterns, human cell types, epigenetic regulation modelling
1 Introduction
The multicellular organisms are composed of diverse cell types with distinct functions. Evidence has shown that the cellular state is closely related to the modification state of chromatin [1–4]. Chromatin modifications, including modifications to the histones and the other proteins in the nucleosomes, can regulate the gene transcription by altering the local chromatin states of the cis‐regulatory DNA regions thus controlling the access of the DNA‐binding proteins such as the transcription factors [5, 6]. Despite the fact that many epigenetic modifications have been mapped in different mammalian cells and numerous chromatin states have been identified based on the recurrent and the spatially coherent combinations of the modifications [7–11], the dynamic regulatory modes of these chromatin marks across the multiple cell types and their associated biological functions remain largely unrevealed.
Early genome‐wide epigenetic studies mainly focused on the spatial distributions of the chromatin modifications, especially their colocalisation patterns [7, 9, 11, 12]. A genome‐wide mapping of the histone modifications in human CD4+ T cells revealed a common modification module consisting of 17 colocalised modifications at over 3200 promoters [9]. By using the same dataset, another study defined 51 distinct chromatin states based on the different combinatorial patterns of the histone modifications, and suggested that these states may be associated to specific biological functions [12]. Another sort of studies focused on assessing the quantitative relationships between the histone modifications and the gene expression [13–16]. On using the quantitative models, they found that the histone modification abundances at the promoters are highly predictive for the gene expression. These studies provided valuable information on the combinatorial distribution patterns of various epigenetic modifications as well as their relationship with the gene expression. However, because these researches were carried out in individual cell types, the differences of the enrichment patterns of the epigenetic marks across the different cell types were mostly ignored.
Recently, several studies in the multiple cell types [17–20] or species [21, 22] have showed that the histone modifications at the cis‐acting regulatory regions could change dramatically across the different cell types. A genome‐wide study examined the variety of the histone modifications at the cis‐regulatory regions across five human cell types, concluding that the histone modifications at the enhancers varied greatly across the diverse cell types and could reflect the expression of the cell‐type‐specific (CTS) genes. This study also showed that the histone modification states of the promoters showed considerable similarities across the multiple cell types, raising questions about the cell‐type specificities of the modifications at the promoters and their regulatory functions in the gene expression [19]. However, there is also evidence supporting the fact that the chromatin state at the promoters could change remarkably between the different cell types [17, 18, 20]. The most important evidence came from the studies of the chromatin modifications in the pluripotent and the lineage‐committed cells [17, 18]. They investigated the histone methylations at the highly conserved noncoding elements in mouse embryonic stem (ES) cells and identified a specific modification pattern, termed ‘bivalent’ domains, containing the broad regions of the H3K27 methylation harbouring the narrow peaks of the H3K4 methylation. They found that these domains frequently overlay the transcription start site (TSS) regions of some key developmental genes, which were kept poised in a repressed but activatable state [17]. A following genome‐wide mapping of the histone modifications in three mouse cell types revealed the dynamics of the bivalent domains. They found that a set of genes related to the cellular differentiation have bivalent promoters in the ES cells but are marked by H3K4me3 or H3K27me3 alone in the differentiated cells, indicating that the bivalent promoters can exhibit characteristic changes during cellular differentiation. Not only that, they also found that the changes of the bivalent state are closely related to the gene expression variation [18]. Another large‐scale study mapping nine histone modifications across nine human cell types confirmed the existence of different promoter states on the basis of the recurrent combinations of the marks. State switches were frequently observed across different cell types and were found related to particular CTS gene classes [20]. These studies suggested that a portion of the promoters could exhibit distinct profiles of the histone modifications across the diverse cell types accompanying the gene expression changes, and that the dynamics of the modification states may play important regulatory roles in the CTS genes and specific cellular functions. To elucidate the dynamics of the histone modifications at the promoters and their relationships with the gene expression, a genome‐wide profiling of the histone modifications at the promoters across a wide range of cell types is required, and the cell‐type specificities of the modification profiles in the global and the CTS genes need to be assessed. More importantly, the quantitative relationships between these profiles and the gene expression need to be comprehensively evaluated.
In this paper, we thoroughly investigated the enrichment profiles of seven histone modifications at the promoters across twelve cell types and their correlations with the gene expression. We focused on addressing three major questions: (i) Do the promoters of the global and the CTS genes exhibit the cell‐type specificities of the histone modifications? (ii) Are the histone modifications predictive for the dynamic changes of the gene expression across the diverse cell types? and (iii) How does each individual modification correlate with the expression profiles of the genes? To answer these questions, we obtained the enrichment profiles of seven histone modifications and the gene expression profiles across 12 human cell types by collecting a large set of multicell ChIP‐seq and RNA‐seq data. The cell‐type specificities of these profiles were carefully examined and quantitative models were used to assess the predictive powers of the histone modifications at the promoters for the gene expression changes across multiple cell types. We also investigated the multicell correlation patterns between the histone modifications and the gene expression in the CTS genes. We showed that despite the histone modifications at the promoters globally showing considerable similarities across the multiple cell types, they showed high diversities in the CTS genes. We also demonstrated that the histone modifications at the promoters are highly predictive for the dynamic expression profiles of the genes across all the cell types in the CTS genes. More interestingly, we found that the CTS genes are closely related to the combinatorial correlation patterns with the histone modifications. These findings suggested that the histone modifications play important regulatory roles in the exhibition of the complex expression patterns of the CTS genes across the diverse cell types.
2 Materials and methods
2.1 ChIP‐seq and RNA‐seq data source
The ChIP‐seq and the RNA‐seq data of 12 different human cell types were obtained from the published data of the UCSC ENCODE [23] and the NIH Roadmap Epigenomics project [24], as well as two individual studies on the human CD4+ T cells [9, 25]. These 12 human cell types consist of normal helper T cells (CD4+ T), B‐lymphoblastoid cells (GM12878), two embryonic stem cell lines (H1 and H9 ES), cervical carcinoma cells (Hela‐S3), hepatocellular carcinoma cells (HepG2), skeletal muscle myoblasts (HSMM), umbilical vein endothelial cells (HUVEC), normal foetal lung fibroblasts (IMR90), erythrocytic leukaemia cells (K562), normal epidermal keratinocytes (NHEK) and normal lung fibroblasts (NHLF). The ChIP‐seq dataset is composed of seven types of histone modifications, including H3K4me1, H3K4me2, H3K4me3, H3K9ac, H3K27ac, H3K27me3 and H4K20me1, respectively, as well as an Input control. The RNA‐seq data we downloaded were all unmapped raw format data, hence we can calculate the precise gene expression levels by using a standard RNA‐seq processing protocol [26], which considered the exon–intron gene structure (see the next section). The ChIP‐seq data were all mapped reads data using the reference human genomes UCSC hg18 (Human Build GRCh36) or hg19 (Human Build GRCh37). To calculate the gene expression and the histone modification enrichment levels robustly, most of our RNA‐seq and ChIP‐seq data consist of two biological duplicates (except for the CD4+ T cells). Overall, our dataset contains 207 RNA‐seq and ChIP‐seq samples, and the detailed Gene Expression Omnibus (GEO) accession numbers or the data source website addresses are provided in Supplementary Table 1.
2.2 Sequencing data mapping and processing
Reference human genome sequence (hg19, Feb 2009) and the corresponding annotation data of 21 954 human RefSeq genes, which provides the gene structure information and the positions of the TSS of the genes, were downloaded from the UCSC Genome Brower [27] website (http://www.genome.ucsc.edu/). All the raw data of the RNA‐seq were mapped to this reference genome by using the TopHat [28] software, which has been designed for mapping sequenced reads to the genome by considering the exon–exon junction information. Novel transcripts were removed from the analysis. The gene expression levels were reported in FPKM (fragments per kilobase of transcript per million fragments sequenced) by using the Cufflinks [29] software. The FPKM values of a gene in two duplicates were averaged to represent the expression level of this gene in one particular cell type. The genes that had zero FPKM in all the samples and that were labelled as ‘False’ or ‘LowData’ by Cufflinks in more than half the samples were all filtered out from the final gene list. Overall, we obtained the gene expression levels of 17 683 genes in 12 cell types. The mapped ChIP‐seq reads in the hg18 human genome coordinates were converted to the hg19 genome coordinates by using the liftOver software in the UCSC Genome Browser. The histone modifications densities within a 4000‐bp region surrounding (2000 bp up and downstream of) the TSS in all the genes were used to represent the modification enrichment levels at the promoters as described in the previous studies [13, 22, 30, 31]. These enrichment levels were normalised to the total number of the sequenced fragments of the corresponding libraries. Similar to the gene expression level, the normalised modification enrichment levels of a promoter in two duplicates were also averaged to represent the modification enrichment level of this promoter in one cell type.
2.3 Profiling the histone modification densities
To visualise the histone modification enrichment profiles around the TSS, we plot the modification densities in a 4000‐bp region around (2000 bp up and downstream of) the TSS. By using the ChIP‐seq data of the histone modifications, we calculated the coverage depth of each nucleotide (the number of reads that cover a nucleotide) in this region. The coverage depth of each nucleotide was then normalised to the total mapped bases (number of fragments × fragment length) of the corresponding library and to the number of genes. All the genes were rearranged in the same orientation (5′ to 3′), and then the normalised coverage depth at each position was averaged across all the promoters of a given gene set. For visualisation, the profiles were smoothed by a sliding window of 200 bp size across the whole region.
2.4 Identification of the histone modification domains at the promoters
To identify the histone modification domains at the promoters in a particular cell type, we used two independent methods to identify the different sizes of the modification domains: peaks and broad domains, within an interval of length 4 kb that we previously defined as a promoter region. In practice, we used the MACS software [32] (version 1.4.0) to find the ChIP peaks with a P ‐value cutoff of 1.0E‐5. Since the MACS was not designed for broad domain detection, we used the Poisson exact test method [14] to identify the broad ChIP domains. For each histone modification, the number of the reads within each promoter region was counted, and a Poisson exact test was used to obtain the P ‐value for each promoter being higher in the ChIP than the Input control. The P ‐values were adjusted by using the Benjamini Hochberg false discovery rate (FDR) correction for multiple testing and a log ‘fold‐change’ of the enrichment was calculated for each promoter. Any promoter with an FDR < 0.001 and a log2 fold‐change >1 (2‐fold) was defined to be marked by a broad domain. The union of the two types of domains was used to determine whether a promoter is marked by the given modification in a particular cell type. In this paper, the marked gene set consisted of genes with promoters that were marked by at least one histone modification in at least one cell type.
2.5 Calculation of the cell‐type specificity of the gene expression
We used the Shannon entropy [33] to measure the cell‐type specificity of the gene expression. According to the Shannon information theory, as the variation (cell‐type specificity) of a distribution increases, its entropy decreases. We calculated the Shannon entropy (Hg ) of each gene on the basis of their expression profiles across all the cell types to determine its degree of cell‐type specificity. Specifically, we first calculated the relative expression of a gene g in a cell type c as , then the entropy of a gene's expression profile is . Hg has units of bits and ranges from zero for the genes expressed in a single cell type to log2 (N) for the genes expressed uniformly in all the cell types (N is the total number of the cell types, in this study, N = 12). All the genes were ranked by their entropy scores, and the top 3000 genes were used to constitute the CTS gene set with a threshold score of 1.209 which roughly means that the CTS genes were expressed in at most about two cell types (21.209 ≃ 2.3). To identify the specific genes of each individual cell type, we calculated each gene's quantitative entropy Qg|c = Hg − log2 (pc|g ). Qg,c also has units of bits and has a minimal of zero when a gene g is relatively highly expressed in a small number of cell types including cell type c, and becomes higher as either the expression level of the gene in cell type c is lower, or as the number of the cell types expressing the gene becomes higher. We say a CTS gene is specifically expressed in cell type g’ if g’ minimises this gene's Qg,c in the 12 cell types. The number of the CTS genes associated with each cell type and their CTS expression profiles are displayed in Supplementary Figure 1.
Fig. 1.
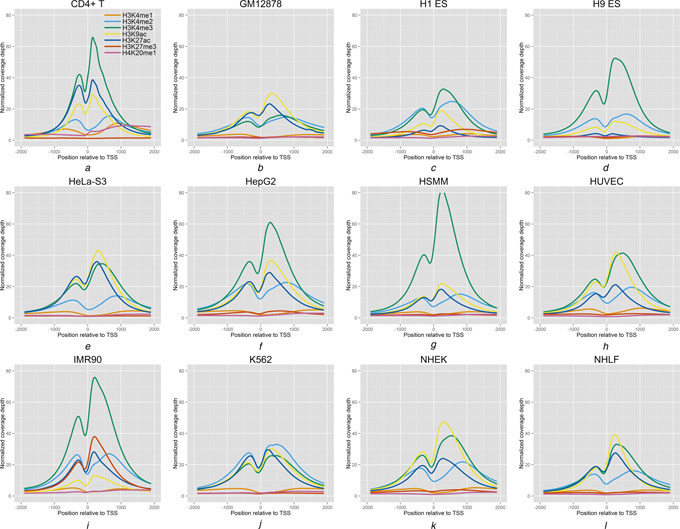
Global enrichment profiles of the seven histone modifications in a 4000‐bp region around (2000 bp up and downstream of) the TSS in the twelve cell types
The coverage depth of each nucleotide was then normalised to the total mapped bases (number of fragments × fragment length) of the corresponding library and to the number of the genes. The normalised coverage depth at each position was averaged across all the promoters. For visualisation, the profiles were smoothed by a sliding window of 200 bp size across the whole region.
2.6 Full histone modification models for predicting the gene expression across the multiple cell types
We used the Lasso regression [34] model to evaluate the predictive power of the histone modifications on the gene expression profiles across the 12 cell types. Different from the traditional regression model, the Lasso model imposes an L 1 norm constraint on the coefficients, which enables it to only include important variables in the model. Our previous work has demonstrated that the Lasso model performed outstandingly in identifying the functional gene regulators from the high‐throughput gene expression datasets [35]. In addition, the variable selection procedure in the Lasso model can reduce the number of the variables, which is very necessary when the sample size is relatively small.
Let yi index the expression level of the gene i, index the enrichment level of the histone modification h at the promoter of the gene I and H index the total number of the histone modifications, respectively. The Lasso model can be written as follows
| (1) |
The corresponding constrained L 1 norm is . In practice, we use the R programming language [36] and the ‘lars’ package [37] to implement the Lasso regression and the variable selection procedure. The basic procedure of the algorithms in this package is starting with all the coefficients equal to zero and adding a variable that can be correlated in a specific direction until all variables are in the model. To determine which subset of the variables should be chosen from the collection of the possibilities, a Cp ‐type statistic is derived to estimate the prediction error. Let represent the k ‐step estimator of y, represent the ordinary least squares estimate of the variance and N represent the sample size, respectively. The Cp statistics can be given as: . We then chose the subset of the variables with the non‐zero coefficients in the step that minimises Cp . For the convenience of comparison, we also implement the traditional multiple linear model on the same datasets. The goodness of the fits is measured by the coefficient of determination R 2, which represents the proportion of the variability in a dataset that is accounted for by the statistical model. The significance of a model was tested by the analysis of variance (ANOVA) with the F ‐test.
2.7 One‐modification models for assessing the correlations between the individual modification and the gene expression
The full histone modification models can be used for revealing the predictive power of the modifications at the promoters for the gene expression. However, because of the presence of ‘multicollinearity’ [38], it is hard for us to evaluate the relations between each individual modification and the gene expression. As a result, to robustly estimate the correlations between the histone modifications at the promoter and the gene expression, we used an alternative strategy by building one‐modification models from the multicell ChIP‐seq and RNA‐seq data. The bootstrapping method was used to estimate the prediction accuracy of the one‐modification models. Since the bootstrapping does not require distributional assumptions, it can provide more accurate inferences when the same size is small [39]. Specifically, for each gene and each histone modification, we built the one‐modification models between the gene expression profile and the modification enrichment profile across the N (equal size to the observed dataset, in this study, N = 12) cell types which were randomly resampled with replacement from all the cell lines. This process was repeated for 1000 times for each gene and each modification, and the degree of the correlation between the modification and the expression level of this gene was finally measured as the Pearson's correlation coefficient (PCC) between the predicted expression profile and the observed expression profile averaged from 1000 bootstrappings. The significances of the one‐modification models were tested by ANOVA with F ‐test.
2.8 k‐Means clustering
To investigate the expression patterns of the genes, we performed a k ‐means clustering method to divide the genes into different clusters on the basis of their expression profiles across all the cell types. We used the optimum average silhouette width criterion to determine the optimal number of the clusters (k), and we then performed the k ‐means clustering with the optimal k. Based on the results of the k ‐means clustering, all the genes were reordered by their cluster labels and the clusters were reordered by the gene numbers they contained. The clustering analysis was implemented in R and the optimal k estimation was performed by using the ‘fpc’ package.
3 Results
3.1 Histone modifications at the promoters show a global invariability across all the cell types
To obtain a global picture of the histone modifications enrichment profiles surrounding the TSSs in the 12 cell types (CD4+ T, GM12878, H1 ES, H9 ES, HeLa‐S3, HepG2, HSMM, HUVEC, IMR90, K562, NHEK and NHLF, respectively), we mapped the ChIP‐seq data of the seven histone modifications (H3K4me1, H3K4me2, H3K4me3, H3K9ac, H3K27ac, H3K27me3 and H4K20me1, respectively) across a 4 kb region around (2 kb up and downstream of) the TSS in each cell type. The coverage depth of each nucleotide was then normalised to the total mapped bases (number of fragments × fragment length) of the given library. The normalised coverage depth of each position was averaged over 17 476 marked promoters, and was then used to display the global enrichment profile of each histone modification around the TSS (see Section 2 for details).
Figs. 1 a −l show the global enrichment profiles of the seven histone modifications in the 12 cell types. We found that the histone modifications at the promoters are globally invariable across all the cell types. The seven modifications can be roughly divided into two classes based on their enrichment levels. Four histone modifications, including H3K4me2, H3K4me3, H3K9ac and H3K27ac, respectively, are highly enriched around the TSS in most cell types by exhibiting peaks, whereas the other three modifications: H3K4me1, H3K27me3 and H4K20me1, respectively, exhibit consistently low enrichment levels in most cell types. The histone modifications of all the two classes maintained consistent levels across most cell types on a global level. This is consistent with the observations in a previous study [19] that the histone modifications at the promoters are considerably similar across the multiple cell types. However, we found that there were also cell‐type‐dependent changes of the modification enrichment profiles. For example, the modification H3K27me3, which has low profiles in most cell types, has a distinctly high level in normal foetal lung fibroblasts (IMR90) cells. Another modification H3K27ac has high profiles in most cell types but has much lower profiles in the H1 and the H9 ES cells. These observations suggested that the histone modifications at the promoters can also change greatly between certain pairs of cell types. Overall, we found that the enrichment levels of most histone modifications at the promoters show a global invariability across the diverse cell types, however, the variance of a certain modification in certain cell type(s) is also notable. Since the enrichment levels of the histone modifications were calculated by averaging the enrichment signals across all the marked genes, it is hard for us to evaluate the histone modifications variances among these genes. In the next section, we will thoroughly assess the cell‐type specificity of the histone modification at each promoter, as well as the similarities of the modification enrichment profiles between each pair of cell types.
3.2 Histone modifications at the promoters show remarkable cell‐type specificities in the CTS genes
In this analysis, we investigated the correlations of the multicell profiles of the seven histone modifications at the promoters across two gene sets: marked genes and CTS genes. Theoretically, if the histone modifications at the promoters are CTS, the correlations of their profiles between the different cell types will be relatively low, and vice versa. The enrichment profiles of the histone modifications at the promoters and the gene expression profiles across the 12 cell types were calculated by using ChIP‐seq and RNA‐seq data (see Section 2 for details).
We first explored the correlation of the gene expression. For each pair of the cell types, we calculated the Spearman's rank correlation coefficient (rs ) of the gene expression (the FPKM values) across the marked gene set and the CTS gene set, respectively. Heatmaps were used to visualise the correlation patterns in two gene sets. As expected, the average rs of the CTS gene set (0.3052) is much lower than that of the marked gene set (0.7753) (Fig. 2 a). We then proceeded to investigate the degrees of the correlation patterns of the histone modifications. The enrichment profiles of each histone modification at the promoters were used to calculate the rs for each pair of cell types. Figs. 2 b –h show the correlation heatmaps of the seven histone modifications among the 12 cell types. In the marked gene set, we found that five modifications, including H3K4me1, H3K4me2, H3K4me3, H3K9ac and H3K27ac, respectively, have remarkably high degrees of correlation among all the cell types, with the average rs ranging from 0.5937 to 0.8384. This result is consistent with the observations in the previous section that the histone modifications at the promoter are globally invariable across the diverse cell types. However, we found that the corresponding rs of these modifications in the CTS gene set are significantly lower (P = 1.327E−89), ranging from 0.3517 to 0.4632, showing considerable variability across the diverse cell types. We also noted that the modifications H3K27me3 and H4K20me1 showed relatively low rs both in the marked and the CTS gene set, suggesting that they are variable across the multiple cell types in all the marked genes, not necessarily in the CTS genes. We concluded from these results that the histone modifications at the promoters of the CTS genes are much more variable than that of the other marked genes, showing obvious cell‐type specificities across all the cell types. Moreover, if the functional chromatin signatures instead of the biological noises produced the histone modification variability at the promoters, we could expect that the histone modifications are able to reflect the expression profiles of the CTS genes across the diverse cell types. To validate this hypothesis, we turned to the predictive models to assess the quantitative relationships between the histone modifications profiles at the promoters and the gene expression profiles across all the cell types.
Fig. 2.
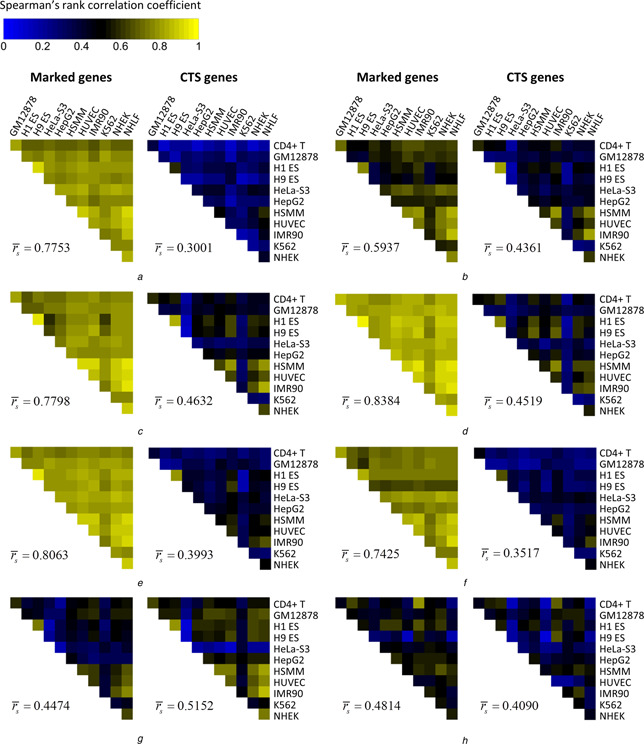
Correlation heatmaps of
a The gene expression and
the seven histone modifications
b H3K4me1
c H3K4me2
d H3K4me3
e H3K9ac
f H3K27ac
g H3K27me3 and
h H4K20me1 among the 12 cell types
For each figure in a−h, the left heatmap represented the correlations of the gene expression or the histone modification enrichment in the marked genes, and the right one represented the corresponding correlations in the CTS genes. The degrees of the correlations were calculated by Spearman's rank correlation coefficient (rs ), and the average rs of the gene expression or the histone modification enrichment among the 12 cell types were annotated under each heatmap.
3.3 Histone modifications at the promoters are highly predictive for the dynamic changes of the CTS gene expression across all the cell types
The genome‐wide quantitative relationships between the histone modifications at the promoters and the gene expression have been studied in the individual cell types before [13, 15]. These studies successfully constructed highly predictive quantitative models both in the general and the CTS genes, suggesting the important regulatory roles of the histone modifications in the gene expression. However, because these studies were all conducted in a single cell type, the capability of the histone modifications at the promoters to predict the gene expression across the diverse cell types has not been assessed. In this analysis, we set to derive single gene‐level quantitative relationships from the gene expression profiles and the histone modifications enrichment profiles across the 12 cell types with the aid of the traditional multiple linear regression models and the Lasso regression models (full models). Different from the genome‐wide regression model, these models can reflect the regulatory functions of the modifications in the dynamic expression changes of each single gene across the diverse cell types (which we refer to as ‘changes’ or ‘dynamics’ without implying any temporal relationship). Specifically, for each gene, we constructed a traditional multiple linear regression model and a Lasso regression model by using the gene expression profiles across the 12 cell types as response variables and the corresponding enrichment profiles of the seven histone modifications at the promoters as the predictor variables. We used the R 2 to exam the accuracies of the models (see Section 2 for details).
By comparing the traditional multiple linear regression models and the Lasso regression models, we found that the Lasso models performed significantly better than traditional regression models. Out of the 17 476 marked genes, ∼ 18.7% (3268/17 476) genes can be fitted by the significant models (P < 0.01, F ‐test and ANOVA) using traditional regression models, whereas this percentage increased to ∼ 45.9% (8017/17 476) when using the Lasso models. The distributions of the P ‐values (log‐transformed) of the model significance tests were shown in Fig. 3 a. Meanwhile, the Lasso models also improved the global average adjusted R 2 from 0.398 (traditional regression models) to 0.522. We performed a paired Wilcoxon rank sum test for the adjusted R 2 of the two different models of all the genes, and the result also shows that the Lasso outperformed the traditional model with a very high statistical significance (P ‐value < 4.94E−324, n = 17 476). These results show that the Lasso models could find more correlation relationships between the gene expression and the histone modifications from our datasets. We think that this result benefited from the L1 norm constrained feature selection procedure of the Lasso model, which can eliminate the unrelated parameters (the non‐functional histone modifications). More importantly, this result indicated that the histone modifications at the promoters are predictive for the dynamic expression changes of a significant portion of the marked genes. We compared our results with the former related studies conducted by other groups. Ouyang et al. [40] constructed a predictive model for the gene expression by using the binding data of 12 transcription factors (TFs), and they found that the TFs abundances around the TSSs could explain the 65% variation of the gene expression. Karlic et al. [13] next found that the abundances of 39 histone modifications/variants at the promoters can explain the 77% variation of the gene expression in the CD4+ T cells. Our results, on the other hand, indicated that not all the genes could be predicted with such high accuracies. Approximately 44.9% (7853/17 476) genes can be predicted by the Lasso models with the adjusted R 2 higher than 0.65, and this portion becomes ∼ 33.9% (5931/17 476) when the adjusted R 2 is higher than 0.77.
Fig. 3.
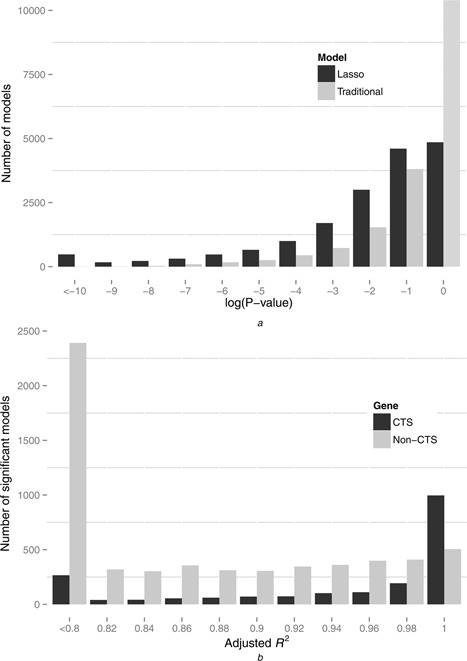
Distributions of the log‐transformed P‐values and the adjusted R2 of the full histone modification models
a Distributions of the log‐transformed P ‐values of the Lasso model and the traditional model.
b Distributions of the adjusted R 2 of the accuracy models (with the adjusted R 2 > 0.8) in the CTS genes (n = 3000) and the non‐CTS genes (n = 14 476)
To further assess the predictive powers of the Lasso models on the expression of the CTS genes, we divided the marked genes into two sets: the CTS genes (n = 3000) and the non‐CTS genes (n = 14 476). We then assessed the performances of the Lasso model on the CTS and the non‐CTS gene sets, respectively. We found that, in the non‐CTS gene set, ∼ 41.5% (6007/14 476) of the genes could be fitted with the significant models, whereas the percentage is considerably higher (∼67.0%, 2010/3000) in the CTS gene set. This percentage of the CTS gene set suggested that the majority of the CTS genes can be accurately predicted by the full histone modifications models. When we focused on the models with high predictive powers (adjusted R 2 > 0.8) in the two gene sets, we found that the Lasso models performed even better in the CTS gene set than in the non‐CTS gene set. As shown in Fig. 3 b, the CTS genes strongly tend to be fitted by more accurate models, whereas the tendency in the non‐CTS gene set is moderate. This suggested that the histone modifications at the promoters are highly predictive for the expression levels of the CTS genes and are well capable of reflecting the expression changes of the CTS genes across the diverse cell types. In addition, it also demonstrated that the functional features rather than the random noises produce the cell‐type specificities of the histone modifications at the promoters.
3.4 Modelling the dynamic correlations between the individual histone modification profile and the gene expression changes
The full histone modification models have shown that the histone modifications at the promoters are highly predictive for the dynamic gene expression changes across the diverse cell types, especially for the CTS genes. However, the relation between each individual modification and the gene expression profiles across the diverse cell types has not been assessed. Previous studies have shown that certain modifications are highly correlated across the genome, hence they may vary in a coordinated manner across the multiple cell types [7–9]. In the presence of such ‘multicollinearity’, it is easy for the contribution of one modification to be attributed to another modification with a correlated profile, and vice versa [40]. In this situation, it will be hard for us to evaluate the relationship between each individual modification and the gene expression. In this section, instead of the full modification model, we focused on the one‐modification model, which can avoid the adverse effects of ‘multicollinearity’ and more clearly reveal the dynamic correlations between each modification and the gene expression. The significances of the models (correlations) were tested by ANOVA with F ‐test, and the accuracies of the models were estimated by a 1000 times bootstrapping (see Section 2 for details). To further remove the false positive correlations, we only evaluated the correlation between a pair of the histone modification enrichment profile and the gene expression profile when the gene was marked by the corresponding modification in at least one cell type.
We identified ∼16 321 significant correlations (P < 0.01, PCC > 0.708, adjusted R 2 was not used because there was only one predictor in the model) on average between the modification and the gene expression in all the marked genes in the 1000 bootstrapping replicates. Fig. 4 a shows the number of the significant correlations for each modification. We found that the number of the correlations for the different histone modifications varied greatly from 986 to 3450, indicating that their capabilities of reflecting the gene expression changes across the diverse cell types are quite different. We also investigated the number of the positive and the negative correlations of each modification. For the modifications H3K4me1, H3K4me2, H3K4me3, H3K9ac, H3K27ac and H4K20me1, respectively, virtually all (98.86%) of their correlations with the gene expression are positive. This is consistent with the fact that these modifications generally served as activators in the dynamic gene transcription. H3K27me3 has a significant proportion (41.41%, 612/1478) of negative correlations, consistent with its negative regulatory role in gene transcription. The substantial proportion (58.59%, 866/1478) of the positive correlations indicated that the H3K27me3 at the promoters is also associated with active transcription, which has been demonstrated in a recent study focusing on the correlations between the H3K27me3 profiles and the transcriptional activity [14].
Fig. 4.
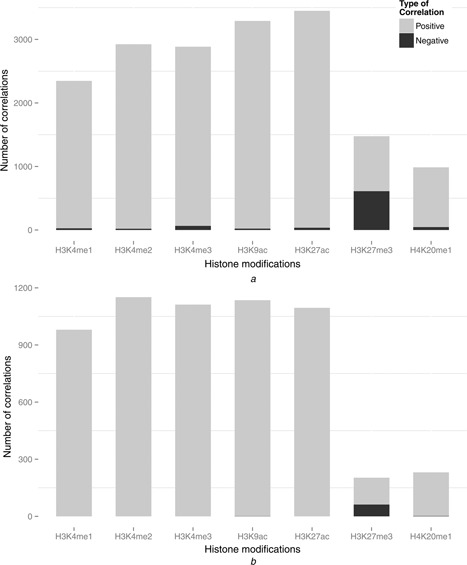
Number of the significant correlations for each modification
a Number of the significant correlations for each modification in all the marked genes
Number of the correlations for the different histone modifications varied greatly from 986 to 3450. For the modifications H3K4me1, H3K4me2, H3K4me3, H3K9ac, H3K27ac and H4K20me1, respectively, ∼ 98.86% of their correlations on average with the gene expression are positive. H3K27me3 has a significant proportion (41.41%, 612/1478) of negative correlations.
b Number of the significant correlations for each modification in the CTS genes
The profile of the correlation number and the proportion of the positive and the negative correlations in the seven modifications are quite similar with all the marked genes. However, the total correlation number is significantly higher than (more than 2‐fold of) (P < 1.0E−8, calculated by a 100 000 000 times random sampling) the expected correlation number (∼2801) on the basis of all the marked genes.
Fig. 4 b shows the number of the significant correlations for each modification in the CTS genes. There are on average ∼ 5799 correlations linked to the CTS genes in 1000 bootstrapping replicates. The profile of the correlation number and the proportions of the positive and the negative correlations in the seven modifications are quite similar with all the marked genes. However, we noted that the total correlation number is significantly higher than (more than 2‐fold of) (P < 1.0E−8, calculated by a 100 000 000 times random sampling) the expected correlation number (∼2801) on the basis of all the marked genes. This suggested that the CTS genes are dynamically correlated with more histone modifications across all the cell types than the other marked genes. This result led us to a reasonable assumption that the CTS genes are related to the combinatorial correlation patterns of the different histone modifications. In the next section, we will test this hypothesis by thoroughly investigating the combinatorial correlation patterns of the CTS genes.
3.5 CTS genes are closely related to the combinatorial correlation patterns of the histone modifications
Based on the correlations between the histone modifications and the gene expression that we identified in the previous section, we counted the number of the significant correlations related to each gene. We investigated the distributions of the number of the correlations per gene in the CTS (n = 3000) and the non‐CTS gene set (n = 14 476). As shown in Figs. 5 a and b, the CTS and the non‐CTS gene sets exhibited distinct distributions of the correlation number per gene (P = 1.799E−225, Mann‐Whitney U test). The majority (∼67.00%) of the CTS genes are correlated with the > = 3 histone modifications, whereas this proportion in the non‐CTS genes is much lower (∼33.48%). This result clearly showed that the CTS genes are prone to be correlated with a higher number of modifications when compared with the non‐CTS genes, indicating that they are related to the combinatorial correlation pattern of the histone modifications. It should be noted that the correlations we identified are dynamic, thus correlating with the multiple modifications does not require the gene to simultaneously exhibit peaks or broad domains of the multiple modifications in one cell type, but could in the different cell types.
Fig. 5.

The CTS genes are closely related to the combinatorial correlation pattern of the histone modifications
The distributions of the correlation number per gene in
a the Non‐CTS genes (n = 14 476)
b the CTS (n = 3000) and
The majority (∼67.00%) of the CTS genes are correlated with the >= 3 histone modifications, while this proportion in the non‐CTS genes is much lower (∼33.48%). The error bars represented the standard deviations calculated from a 1000 time bootstrapping.
c k ‐Means clustering showed the genes with the combinatorial correlation pattern of the histone modifications (correlated with the >= 3 modifications) exhibited distinct CTS expression patterns. Each cluster was only related to one specific cell type, unless two cell types are closely related (H1 and H9; IMR90 and NHLF). For visualisation, all the genes were reordered by their cluster labels and the clusters were reordered by the gene numbers they contained. The gene expression levels were normalised in the row direction.
d Top 10 overrepresented GO Biological Process terms in Cluster 1, where the genes are specifically expressed in two human ES cell types (H1 and H9). The enriched biological processes were closely related to the specific functions of the ES cells: cellular differentiation and pluripotent maintenance. The GO terms overrepresentation analyses were implemented by using BiNGO [43].
To further demonstrate this result, we investigated the expression patterns of the genes correlated with the >= 3 modifications (n = 2761). We used an unsupervised learning method, the k ‐means clustering algorithm, to de novo divide these genes into different clusters. The number of the clusters (k) was estimated by the optimum average silhouette width criterion [41], and the optimal k turned out to be 10. Accordingly, these genes were grouped into 10 clusters solely on the basis of their expression patterns across the different cell types. As shown in Fig. 5 c, we found that these genes exhibited distinct CTS expression patterns. Basically, each cluster was related to only one specific cell type where the genes in this cluster were specifically highly expressed, and their expression levels are much lower in the rest of the cell types. Only two clusters were related to more than one cell type: H1 and H9; IMR90 and NHLF, respectively, for these two pairs of cell types are very closely related. Calculation of the Shannon entropy also showed that the cell‐type specificities of the expression profiles of these genes (H avg,CTS = 1.471, n = 2761) are significantly higher (P < 1.0E−323, Mann‐Whitney U test) than that of all the marked genes (H avg,marked = 2.442, n = 17 476) (see Section 2 for the properties of Hg ). This result confirmed the conclusion that the combinatorial correlation patterns of the histone modifications and the CTS genes are closely related, strongly suggesting that the CTS genes tend to be subjected to a combinatorial regulation by the histone modifications.
The functional annotation analysis of these gene clusters by overrepresented Gene Ontology (GO) terms [42, 43] showed that the genes with the combinatorial correlation pattern of the histone modifications (correlated with the >= 3 modifications) are closely related to the specific cellular functions. Specifically, we found that the overrepresented GO terms for the genes in each cluster were all closely related to the cell‐specific biological processes of the corresponding cell type. The top 10 overrepresented GO Biological Process terms for the genes in the ten clusters are provided in Supplementary Table 2. A notable example is Cluster 1, in which the genes are specifically expressed in two human ES cell types (H1 and H9). Fig. 5 d shows the top 10 overrepresented GO Biological Process terms for the genes in Cluster 1. We found that the over represented biological processes were closely related to the specific functions of the ES cells: cellular differentiation and pluripotent maintenance. Actually, all the four key regulators of cellular pluripotency, including SOX2, SOX3, POU5F1 (OCT4) and NANOG [44, 45], respectively, were found in Cluster 1. This result demonstrated that the combinatorial correlation patterns of the histone modifications may also be very important for the execution of the specific cellular functions.
4 Discussion
Our data showed both the stable and the flexible aspects of the histone modification at the promoters [46]. Globally, we found that the enrichment profiles of the modifications at the promoters are largely similar across the diverse cell types. The global correlation analyses of the histone modifications among the 12 cell types also showed a relatively high degree of correlation. These results showed that the histone modifications at the promoters are globally stable across the diverse cell types. Notably, the degrees of correlation of the histone modifications are comparable with that of the gene expression between the different cell types, suggesting that the stability of the histone modifications at the promoter is important for the maintenance of certain expression levels of most of the genes in different cells. On the other hand, our data showed that the histone modifications at the promoters of the CTS genes exhibited remarkable cell‐type‐dependent variability. We further proved that the variable profiles of the modifications are highly predictive for the dynamic gene changes across all the cell types. These results indicate that the histone modifications at the promoters play important regulatory roles in the CTS gene expression and are important driving forces of the CTS patterns of the gene expression.
The specific relationship between the CTS genes and the combinatorial patterns of the histone modifications has been mentioned in a previous study in the CD4+ T cells [47]. Another epigenetic study in two human cell types revealed that the combination of the H3K27me3 and the DNA methylation is a marker for the CTS genes [48]. Our findings not only confirmed their relationship, but also generalised this discovery in the 12 human cell types. In this paper, the dynamic changes of the histone modifications at the promoters across the 12 cell types were evaluated and their relationships with the gene expression were assessed. Our data showed that the dynamic expression changes of the CTS genes are correlated with the enrichment changes of the significantly more histone modifications. This result suggested that the CTS patterns of the gene expression require dynamic regulation by multiple histone modifications, emphasising the regulatory roles of the combinatorial patterns of the histone modifications in the CTS gene expression. This is reasonable because, generally, the complex expression pattern of the CTS gene across the diverse cell types requires a number of particular regulators that exert distinct roles in the different cell types.
Our paper provided an effective strategy for evaluating the dynamic changes of the histone modifications and their relationships with the gene expression. The Lasso regression models we used in this paper successfully established the quantitative relationships between the histone modifications enrichment and the gene expression profiles across the diverse cell types. Compared with the traditional regression models, the Lasso models could find more correlation relationships between the gene expression and the histone modifications from our datasets, suggesting that the Lasso models are a good choice when dealing with similar kinds of datasets. Wang et al. have constructed an epigenetic regulatory network by using the similar ChIP‐seq data in the 12 cell types. They used statistical tests including Wilcoxon test and Kruskal−Wallis test to identify the regulatory relationships between the histone modifications and the gene expression. The Lasso model provided a more quantitative and predictive way to find the regulatory relationships and construct an informative epigenetic regulatory network. In addition, our paper also provided a new method for investigating the combinatorial patterns of the histone modifications by using multicell ChIP‐seq and RNA‐seq data. Since we mainly focused on the dynamic correlations of the histone modification and the gene expression, correlating with the multiple modifications does not mean that the gene will simultaneously exhibit peaks or broad domains of the multiple modifications in one cell type, but could in the different cell types. Compared with the colocalisation method, this is more consistent with the dynamic patterns where the histone modifications behave across the diverse cell types. We anticipate that, with the rapid progress of the ENCODE project, the NIH Roadmap Epigenomics project and the other related studies, the number of the available cell types will soon increase to a considerable amount, and more powerful statistical methods can be used to systemically uncover the complex patterns of the histone modification [49].
In summary, our paper showed that the histone modifications at the promoters are globally stable across the diverse cell types but exhibited remarkable cell‐type‐dependent variability in the CTS genes. We demonstrated that the variable profiles of the modifications are highly predictive for the dynamic gene changes across all the cell types. Our findings revealed the close relationship between the combinatorial patterns of the histone modifications at the promoters and the CTS gene expression. We anticipate that the findings and the methods that we used in this study can provide useful information for the future studies of the histone modification and the CTS genes.
5 Acknowledgment
The authors wish to thank the ENCODE Project Consortium and the NIH Roadmap Epigenomics Mapping Consortium for making their data publicly available. Specifically, the authors thank the ENCODE Caltech RNA‐seq group, Broad Institute histone modifications group and the NIH Roadmap Epigenomics UCSD group for providing the RNA‐seq and the ChIP‐seq data of the twelve cell types. The authors also thank Keji Zhao et al. in the two studies [9, 25] for publishing their RNA‐seq and ChIP‐seq data of the CD4+ T cells.
Fundings: This work was supported by the National Basic Research Project (973 program) (2012CB518200), the General Program (30900862, 30973107, 81070741 and 81172770) of the National Natural Science Foundation of China, the State Key Laboratory of Proteomics of China (SKLP‐O201104, SKLP‐K201004 and SKLP‐Y201303), and the Special Key Programs for Science and Technology of China (2012ZX09102301–016).
6 References
- 1. Maston G.A. Evans S.K., and Green M.R.: ‘Transcriptional regulatory elements in the human genome’, Annu. Rev. Genomics Hum. Genet., 2006, 7, pp. 29–59 (doi: 10.1146/annurev.genom.7.080505.115623) [DOI] [PubMed] [Google Scholar]
- 2. Bernstein B.E. Meissner A., and Lander E.S.: ‘The mammalian epigenome’, Cell, 2007, 128, pp. 669–681 (doi: 10.1016/j.cell.2007.01.033) [DOI] [PubMed] [Google Scholar]
- 3. Kouzarides T.: ‘Chromatin modifications and their function’, Cell, 2007, 128, pp. 693–705 (doi: 10.1016/j.cell.2007.02.005) [DOI] [PubMed] [Google Scholar]
- 4. Surani M.A. Hayashi K., and Hajkova P.: ‘Genetic and epigenetic regulators of pluripotency’, Cell, 2007, 128, pp. 747–762 (doi: 10.1016/j.cell.2007.02.010) [DOI] [PubMed] [Google Scholar]
- 5. Li B. Carey M., and Workman J.L.: ‘The role of chromatin during transcription’, Cell, 2007, 128, pp. 707–719 (doi: 10.1016/j.cell.2007.01.015) [DOI] [PubMed] [Google Scholar]
- 6. Bannister A.J., and Kouzarides T.: ‘Regulation of chromatin by histone modifications’, Cell Res., 2011, 21, pp. 381–395 (doi: 10.1038/cr.2011.22) [DOI] [PMC free article] [PubMed] [Google Scholar]
- 7. Roh T.Y. Cuddapah S. Cui K., and Zhao K.: ‘The genomic landscape of histone modifications in human T cells’, Proc. Natl. Acad. Sci., 2006, 103, pp. 15782–15787 (doi: 10.1073/pnas.0607617103) [DOI] [PMC free article] [PubMed] [Google Scholar]
- 8. Barski A. Cuddapah S. Cui K. Roh T.Y., and Schones D.E. et al.: ‘High‐resolution profiling of histone methylations in the human genome’, Cell, 2007, 129, pp. 823–837 (doi: 10.1016/j.cell.2007.05.009) [DOI] [PubMed] [Google Scholar]
- 9. Wang Z. Zang C. Rosenfeld J.A. Schones D.E., and Barski A. et al.: ‘Combinatorial patterns of histone acetylations and methylations in the human genome’, Nat. Genet., 2008, 40, pp. 897–903 (doi: 10.1038/ng.154) [DOI] [PMC free article] [PubMed] [Google Scholar]
- 10. Koch C.M. Andrews R.M. Flicek P. Dillon S.C., and Karaoz U. et al.: ‘The landscape of histone modifications across 1% of the human genome in five human cell lines’, Genome Res., 2007, 17, pp. 691–707 (doi: 10.1101/gr.5704207) [DOI] [PMC free article] [PubMed] [Google Scholar]
- 11. Ucar D. Hu Q., and Tan K.: ‘Combinatorial chromatin modification patterns in the human genome revealed by subspace clustering’, Nucleic Acids Res., 2011, 39, pp. 4063–4075 (doi: 10.1093/nar/gkr016) [DOI] [PMC free article] [PubMed] [Google Scholar]
- 12. Ernst J., and Kellis M.: ‘Discovery and characterization of chromatin states for systematic annotation of the human genome’, Nat. Biotechnol., 2010, 28, pp. 817–825 (doi: 10.1038/nbt.1662) [DOI] [PMC free article] [PubMed] [Google Scholar]
- 13. Karlic R. Chung H.R. Lasserre J. Vlahovicek K., and Vingron M.: ‘Histone modification levels are predictive for gene expression’, Proc. Natl. Acad. Sci., 2010, 107, pp. 2926–2931 (doi: 10.1073/pnas.0909344107) [DOI] [PMC free article] [PubMed] [Google Scholar]
- 14. Young M.D. Willson T.A. Wakefield M.J. Trounson E., and Hilton D.J. et al.: ‘ChIP‐seq analysis reveals distinct H3K27me3 profiles that correlate with transcriptional activity’, Nucleic Acids Res., 2011, 39, pp. 7415–7427 (doi: 10.1093/nar/gkr416) [DOI] [PMC free article] [PubMed] [Google Scholar]
- 15. Zhang Z., and Zhang M.Q.: ‘Histone modification profiles are predictive for tissue/cell‐type specific expression of both protein‐coding and microRNA genes’, BMC Bioinfor., 2011, 12, p. 155 (doi: 10.1186/1471-2105-12-155) [DOI] [PMC free article] [PubMed] [Google Scholar]
- 16. Cheng C., and Gerstein M.: ‘Modeling the relative relationship of transcription factor binding and histone modifications to gene expression levels in mouse embryonic stem cells’, Nucleic Acids Res., 2012, 40, pp. 553–568 (doi: 10.1093/nar/gkr752) [DOI] [PMC free article] [PubMed] [Google Scholar]
- 17. Bernstein B.E. Mikkelsen T.S. Xie X. Kamal M., and Huebert D.J. et al.: ‘A bivalent chromatin structure marks key developmental genes in embryonic stem cells’, Cell, 2006, 125, pp. 315–326 (doi: 10.1016/j.cell.2006.02.041) [DOI] [PubMed] [Google Scholar]
- 18. Mikkelsen T.S. Ku M. Jaffe D.B. Issac B., and Lieberman E. et al.: ‘Genome‐wide maps of chromatin state in pluripotent and lineage‐committed cells’, Nature, 2007, 448, pp. 553–560 (doi: 10.1038/nature06008) [DOI] [PMC free article] [PubMed] [Google Scholar]
- 19. Heintzman N.D. Hon G.C. Hawkins R.D. Kheradpour P., and Stark A. et al.: ‘Histone modifications at human enhancers reflect global cell‐type‐specific gene expression’, Nature, 2009, 459, pp. 108–112 (doi: 10.1038/nature07829) [DOI] [PMC free article] [PubMed] [Google Scholar]
- 20. Ernst J. Kheradpour P. Mikkelsen T.S. Shoresh N., and Ward L.D. et al.: ‘Mapping and analysis of chromatin state dynamics in nine human cell types’, Nature, 2011, 473, pp. 43–49 (doi: 10.1038/nature09906) [DOI] [PMC free article] [PubMed] [Google Scholar]
- 21. Choi J.K., and Kim Y.J.: ‘Epigenetic regulation and the variability of gene expression’, Nat. Genet., 2008, 40, pp. 141–147 (doi: 10.1038/ng.2007.58) [DOI] [PubMed] [Google Scholar]
- 22. Ha M. Ng D.W. Li W.H., and Chen Z.J.: ‘Coordinated histone modifications are associated with gene expression variation within and between species’, Genome Res., 2011, 21, pp. 590–598 (doi: 10.1101/gr.116467.110) [DOI] [PMC free article] [PubMed] [Google Scholar]
- 23.‘A user's guide to the encyclopedia of DNA elements (ENCODE)’, PLoS Biol., 2011, 9, p. e1001046 (doi: 10.1371/journal.pbio.1001046) [DOI] [PMC free article] [PubMed] [Google Scholar]
- 24. Bernstein B.E. Stamatoyannopoulos J.A. Costello J.F. Ren B., and Milosavljevic A. et al.: ‘The NIH Roadmap Epigenomics Mapping Consortium’, Nat. Biotechnol., 2010, 28, pp. 1045–1048 (doi: 10.1038/nbt1010-1045) [DOI] [PMC free article] [PubMed] [Google Scholar]
- 25. Chepelev I. Wei G. Tang Q., and Zhao K.: ‘Detection of single nucleotide variations in expressed exons of the human genome using RNA‐Seq’, Nucleic Acids Res., 2009, 37, p. e106 (doi: 10.1093/nar/gkp507) [DOI] [PMC free article] [PubMed] [Google Scholar]
- 26. Trapnell C. Roberts A. Goff L. Pertea G., and Kim D. et al.: ‘Differential gene and transcript expression analysis of RNA‐seq experiments with TopHat and Cufflinks’, Nat. Protocols, 2012, 7, pp. 562–578 (doi: 10.1038/nprot.2012.016) [DOI] [PMC free article] [PubMed] [Google Scholar]
- 27. Fujita P.A. Rhead B. Zweig A.S. Hinrichs A.S., and Karolchik D. et al.: ‘The UCSC genome browser database: update 2011’, Nucleic Acids Res., 2011, 39, pp. D876–D882 (doi: 10.1093/nar/gkq963) [DOI] [PMC free article] [PubMed] [Google Scholar]
- 28. Trapnell C. Pachter L., and Salzberg S.L.: ‘TopHat: discovering splice junctions with RNA‐Seq’, Bioinformatics, 2009, 25, pp. 1105–1111 (doi: 10.1093/bioinformatics/btp120) [DOI] [PMC free article] [PubMed] [Google Scholar]
- 29. Roberts A. Pimentel H. Trapnell C., and Pachter L.: ‘Identification of novel transcripts in annotated genomes using RNA‐Seq’, Bioinformatics, 2011, 27, pp. 2325–2329 (doi: 10.1093/bioinformatics/btr355) [DOI] [PubMed] [Google Scholar]
- 30. Saxonov S. Berg P., and Brutlag D.L.: ‘A genome‐wide analysis of CpG dinucleotides in the human genome distinguishes two distinct classes of promoters’, Proc. Natl. Acad. Sci., 2006, 103, pp. 1412–1417 (doi: 10.1073/pnas.0510310103) [DOI] [PMC free article] [PubMed] [Google Scholar]
- 31. Roy S. Ernst J. Kharchenko P.V. Kheradpour P., and Negre N. et al.: ‘Identification of functional elements and regulatory circuits by Drosophila modENCODE’, Science, 2010, 330, pp. 1787–1797 (doi: 10.1126/science.1198374) [DOI] [PMC free article] [PubMed] [Google Scholar]
- 32. Zhang Y. Liu T. Meyer C.A. Eeckhoute J., and Johnson D.S. et al.: ‘Model‐based analysis of ChIP‐Seq (MACS)’, Genome Biol., 2008, 9, p. R137 (doi: 10.1186/gb-2008-9-9-r137) [DOI] [PMC free article] [PubMed] [Google Scholar]
- 33. Schug J. Schuller W.P. Kappen C. Salbaum J.M., and Bucan M. et al.: ‘Promoter features related to tissue specificity as measured by Shannon entropy’, Genome Biol., 2005, 6, p. R33 (doi: 10.1186/gb-2005-6-4-r33) [DOI] [PMC free article] [PubMed] [Google Scholar]
- 34. Tibshirani R.: ‘Regression shrinkage and selection via the lasso’, J. R. Stat. Soc. B, Methodol., 1996, 58, pp. 267–288 [Google Scholar]
- 35. Lu Y. Zhou Y. Qu W. Deng M., and Zhang C.: ‘A Lasso regression model for the construction of microRNA‐target regulatory networks’, Bioinformatics, 2011, 27, pp. 2406–2413 (doi: 10.1093/bioinformatics/btr410) [DOI] [PubMed] [Google Scholar]
- 36. Ihaka R., and Gentleman R.: ‘R: a language for data analysis and graphics’, J. Comput. Graph. Stat., 1996, 5, pp. 299–314 [Google Scholar]
- 37. Efron B. Hastie T. Johnstone I., and Tibshirani R.: ‘Least angle regression’, Ann. Stat., 2004, 32, pp. 407–499 (doi: 10.1214/009053604000000067) [DOI] [Google Scholar]
- 38. Farrar D.E., and Glauber R.R.: ‘Multicollinearity in regression analysis: the problem revisited’, Rev. Econ. Stat., 1967, 49, pp. 92–107 (doi: 10.2307/1937887) [DOI] [Google Scholar]
- 39. Efron B., and Tibshirani R.: ‘An introduction to the bootstrap’ (Chapman & Hall/CRC, 1993) [Google Scholar]
- 40. Ouyang Z. Zhou Q., and Wong W.H.: ‘ChIP‐Seq of transcription factors predicts absolute and differential gene expression in embryonic stem cells’, Proc. Natl. Acad. Sci., 2009, 106, pp. 21521–21526 (doi: 10.1073/pnas.0904863106) [DOI] [PMC free article] [PubMed] [Google Scholar]
- 41. Rousseeuw P.J.: ‘Silhouettes: a graphical aid to the interpretation and validation of cluster analysis’, J. Comput. Appl. Math., 1987, 20, pp. 53–65 (doi: 10.1016/0377-0427(87)90125-7) [DOI] [Google Scholar]
- 42. Ashburner M. Ball C.A. Blake J.A. Botstein D., and Butler H. et al.: ‘Gene ontology: tool for the unification of biology’, Gene Ontology Consortium’, Nat. Genet., 2000, 25, pp. 25–29 [DOI] [PMC free article] [PubMed] [Google Scholar]
- 43. Maere S. Heymans K., and Kuiper M.: ‘BiNGO: a cytoscape plugin to assess overrepresentation of gene ontology categories in biological networks’, Bioinformatics, 2005, 21, pp. 3448–3449 (doi: 10.1093/bioinformatics/bti551) [DOI] [PubMed] [Google Scholar]
- 44. Loh Y.H. Wu Q. Chew J.L. Vega V.B., and Zhang W. et al.: ‘The Oct4 and Nanog transcription network regulates pluripotency in mouse embryonic stem cells’, Nat. Genet., 2006, 38, pp. 431–440 (doi: 10.1038/ng1760) [DOI] [PubMed] [Google Scholar]
- 45. Boyer L.A. Lee T.I. Cole M.F. Johnstone S.E., and Levine S.S. et al.: ‘Core transcriptional regulatory circuitry in human embryonic stem cells’, Cell, 2005, 122, pp. 947–956 (doi: 10.1016/j.cell.2005.08.020) [DOI] [PMC free article] [PubMed] [Google Scholar]
- 46. Reik W.: ‘Stability and flexibility of epigenetic gene regulation in mammalian development’, Nature, 2007, 447, pp. 425–432 (doi: 10.1038/nature05918) [DOI] [PubMed] [Google Scholar]
- 47. Yu H. Zhu S.S. Zhou B. Xue H.L., and Han J.D.J.: ‘Inferring causal relationships among different histone modifications and gene expression (vol, pg 1314, 2008)’, Genome Res., 2008, 18, pp. 1544–1544 [DOI] [PMC free article] [PubMed] [Google Scholar]
- 48. Maruyama R. Choudhury S. Kowalczyk A. Bessarabova M., and Beresford‐Smith B. et al.: ‘Epigenetic regulation of cell type‐specific expression patterns in the human mammary epithelium’, PLoS Genet., 2011, 7, p. e1001369 (doi: 10.1371/journal.pgen.1001369) [DOI] [PMC free article] [PubMed] [Google Scholar]
- 49. Berger S.L.: ‘The complex language of chromatin regulation during transcription’, Nature, 2007, 447, pp. 407–412 (doi: 10.1038/nature05915) [DOI] [PubMed] [Google Scholar]