

Abstract
Gene‐expression data is being widely used for various clinical research. It represents expression levels of thousands of genes across the various experimental conditions simultaneously. Mining conditions specific hub genes from gene‐expression data is a challenging task. Conditions specific hub genes signify the functional behaviour of bicluster across the subset of conditions and can act as prognostic or diagnostic markers of the diseases. In this study, the authors have introduced a new approach for identifying conditions specific hub genes from the RNA‐Seq data using a biclustering algorithm. In the proposed approach, efficient ‘runibic’ biclustering algorithm, the concept of gene co‐expression network and concept of protein–protein interaction network have been used for getting better performance. The result shows that the proposed approach extracts biologically significant conditions specific hub genes which play an important role in various biological processes and pathways. These conditions specific hub genes can be used as prognostic or diagnostic biomarkers. Conditions specific hub genes will be helpful to reduce the analysis time and increase the accuracy of further research. Also, they summarised application of the proposed approach to the drug discovery process.
Inspec keywords: proteins, data mining, cellular biophysics, drugs, genetics, diseases, RNA, medical computing, biology computing, molecular biophysics
Other keywords: experimental conditions, mining conditions specific hub genes, identifying conditions specific hub genes, RNA‐Seq data, gene co‐expression network, significant conditions specific hub genes, RNA‐Seq gene‐expression data
1 Introduction
Biological data are publically available with increasing speed due to the advancement of the technology. Analysis and understanding of enormous biological data is a challenging task. Biological data, particularly transcriptomic data are publically available in various forms such as microarray gene‐expression data [1, 2], RNA‐Seq data [3], DNA‐Seq data [4] and other [5]. Several researchers are extensively using these data for the various categories of research [6, 7, 8].
Gene‐expression data is one of the increasingly used biological data in biomedical research [9]. The behavioural function of thousands of genes and the disease mechanisms can be extracted by analysing the gene‐expression data. Proper analysis of gene‐expression data always plays a vital role in finding a solution to the various biological problems. Microarray is the famous technology used for representing the gene expression but it has some drawbacks [10]. RNA‐Seq is another high‐throughput emerging technology for representing the gene expression [11]. RNA‐Seq data has some advantages over the microarray data. Today, the cost of RNA‐Seq is slowly decreasing. The RNA‐Seq technique allows identifying both known and novel genes. Owing to the reducing cost and other comparatively important features, researchers are more focusing on the analysis of RNA‐Seq data.
Numerous studies have been applied to the gene‐expression data for mining co‐expressed gene modules and hub genes associated with the modules [12, 13]. However, no studies have focused on mining conditions specific hub genes from the co‐expressed gene modules. Identification of hub genes is one of the important clinical applications, where potential genes among the co‐expressed genes can be identified [14]. Hub gene is the highly connected gene of the network, which has the tendency to co‐ordinate the other co‐expressed genes and represent the overall behaviour of the bicluster. Gene co‐expression network (GCN) is a popular method used for finding the hub genes [15]. The GCN can be used for many purposes such as gene prioritisation [16], pathway analysis [17, 18], gene function identification [19] etc. Most GCN have been constructed via clustering approach [20]. However, clustering‐based GCN does not produce the results specific to conditions, it always considered all experimental conditions. Weighted correlation gene network analysis (WCGNA) is one of the rapidly used tools for the identification of hub genes from the co‐expressed genes [20]. The WCGNA is based on the clustering approach. Clustering of gene‐expression data [21] has many drawbacks [22]. So, the key genes which play an important role only in specific situations cannot be identified using the concept of WCGNA. For overcoming the drawbacks of the WCGNA‐based approach, biclustering‐based approach plays an important role. Biclustering [22] produces the subset of highly co‐expressed genes across the subset of conditions. By constructing the GCN of the bicluster, the interconnection between the co‐expressed genes can be visualised and can understand the gene functions more effectively.
In biclustering [23, 24, 25, 26, 27], simultaneous clustering performed on both the dimensions, i.e. on gene side as well as on sample or conditions side. From the clustering, we will get the genes which are correlated across all the conditions of the data. Therefore, the biclustering technique is more effective to find more biologically significant patterns as compared with clustering techniques from the gene‐expression data [22]. Biclusters are used in many biological applications for extracting unfolds significant information [28, 29, 30]. For the further analysis of clustering‐based hub genes, we have to consider all conditions and for future research based on conditions specific (biclustering based) hub genes, we have to do analysis across the specific conditions only. By using the conditions specific hub genes, time for the analysis across the unnecessary conditions will reduce and increase the accuracy.
In this paper, we have proposed a new approach for identifying conditions specific hub genes by using the biclustering algorithm from the RNA‐Seq gene‐expression data. For finding the biclusters, ‘runibic’ biclustering algorithm has been used. Set of biclusters obtained from the biclustering algorithms have been validated for biological significance by using the online Generic Gene Ontology (GO) Term Finder tool [31]. All the significant biclusters are further considered for extracting the hub genes using the concept of the GCN. For each significant bicluster, GCN has been constructed. From each GCN, hub genes are identified. Also, we have constructed the protein–protein interaction network (PPIN) for each significant biclusters, and from the constructed PPIN hub genes are identified. Finally, from the subset of hub genes of GCN and PPIN of the specific bicluster, common hub genes are identified. These identified common hub genes are the robust conditions specific hub genes for the specific biclusters. There might be more than one hub genes present in the single bicluster. In this way, hub genes for each and every significant bicluster have been identified. With the help of an example, we have demonstrated the entire approach and done the rigorous analysis and validations. These hub genes can be used as a prognostic and diagnostic marker of the respective diseases in many clinical applications after the rigorous analysis by the clinicians. Our major contributions are summarised as follows:
Proposed a novel method for mining the conditions specific hub genes from the RNA‐Seq gene‐expression data via biclustering algorithm.
Presented computational analysis of biclustering algorithm on various datasets and validated the results by verifying the biological significance of biclusters.
Chosen an efficient biclustering algorithm and extracted biologically significant biclusters from the large‐scale RNA‐Seq gene‐expression datasets.
Constructed the GCN for each significant bicluster with the help of difference matrix and gene correlation matrix concept.
Identified hub genes from each constructed GCN. Also, identified the hub genes from each constructed PPIN using STRING software tool. Finally, validated the results.
Presented comparative analysis with WCGNA‐based approach.
Summarised the role of conditions specific hub genes in the drug discovery process.
This paper is divided into the followed sections. Section 2 describes some important terminologies related to the proposed approach and illustrated the proposed approach in detail with the help of the flow diagram. Section 3 presents the results of an experimental analysis on various synthetic as well as real datasets followed by a discussion on the same. Section 4 focused on the application of the proposed approach to drug discovery. Section 5 is about the conclusions of our experimental analysis.
2 Materials and methods
In this section, some important terminologies related to the proposed approach are described along with the definitions and methodology used in the proposed approach. The proposed approach is further illustrated with the help of a flow diagram.
2.1 Preliminaries and definitions
2.1.1 Bicluster
Bicluster of gene‐expression data is a subset of consistent behaving genes across the subset of conditions and vice versa. The process of extracting biclusters is known as biclustering [32].
2.1.2 Co‐expressed genes
Co‐expressed genes are consistent behaving genes across the subset of conditions. Generally, genes in the bicluster are considered as co‐expressed genes. Co‐expressed genes can use as a prognostic or diagnostic measure in many clinical as well as biological applications [33].
2.1.3 Gene co‐expression network
GCN is a popular tool for understanding the diseases and its development across various stages at the gene level. GCN is defined as un‐directed gene network, in which nodes represent the co‐expressed genes and edges indicate the correlation between the nodes [33].
2.1.4 Hub gene
The highly connected node in the GCN is called as a hub gene. All nodes of the GCN of bicluster are co‐expressed genes. The node which is having the highest degree of connectivity is considered as a hub gene of that co‐expression network. In a single GCN, more than one node might have the same highest degree. Hence, multiple hub genes can be present in a single GCN. The identified hub genes can be considered as diagnostic and prognostic markers for the diseases [34].
2.2 Proposed approach
Hub genes extraction from the large gene‐expression dataset is an arduous task. In recent years, many methods for finding the hub genes have been introduced. For achieving more accurate biologically significant condition‐specific hub genes, we have used the concept of biclustering. Fig. 1 shows the process diagram of the proposed approach.
Fig. 1.
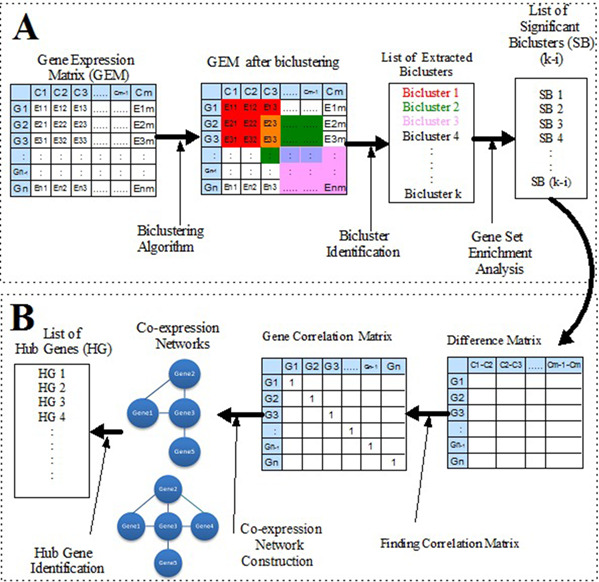
Workflow of hub gene identification via biclustering algorithm
The proposed approach is divided into two phases. The first phase is labelled as ‘A’ and other is labelled as ‘B’. In the phase ‘A’, pre‐processed RNA‐Seq data has been used as an input to the runibic biclustering algorithm. The set of biclusters have been extracted from the gene‐expression data using the runibic biclustering algorithm. From the set of extracted biclusters, biologically significant biclusters have been identified with the help of online Generic GO Term Finder tool. In the phase ‘B’, difference matrix with respect to the conditions has been computed for each significant bicluster. Furthermore, a difference matrix has been used for computing the correlation matrix with respect to the genes. Then, the GCN has been constructed based on the correlation matrix. The nodes with the highest degree of connectivity in the network are identified. The identified nodes are called as hub genes. Phase ‘B’ is repeated for all the significant biclusters. In this way, the list of conditions specific hub genes can be identified for the particular dataset. Details about each and every step involved in the process of the proposed approach are given below.
2.2.1 Pre‐processing of gene‐expression data
RNA‐Seq data analysis includes several steps for obtaining the expressions. The steps include obtaining sequenced reads, normalisation and quality control. Various tools are available for obtaining the expression counts from RNA‐Seq data. The input to the biclustering algorithm is an RNA‐Seq data in the form of fragments per kilobase of transcript per million mapped reads (FPKM) and reads per kilobase of transcript per million mapped reads (RPKM). The FPKM/RPKM RNA‐Seq data is available in a matrix format, where rows represent the genes and columns represent the conditions or samples.
2.2.2 Applying biclustering algorithm
Several approaches for identification of hub genes are based on the concept of clustering but clustering on gene‐expression data has many pitfalls. By applying the biclustering to gene‐expression data, we will get all possible groups of co‐expressed genes across the subset of conditions called biclusters. Hence, hub genes identified from all extracted significant biclusters will be more biologically significant as compared with the hub genes identified from the clustering technique. In biology, all genes are not expressed consistently across all conditions and not always active in all conditions. Therefore, it is more significant to focus on the only subset of conditions and not on all the conditions for the analysis in the clinical research. Hence, we have used the concept of biclustering for the identification of hub genes from the gene‐expression data.
Most biclustering algorithms are bound to specific features and not work properly on all aspects. Hence, the selection of proper biclustering algorithm for the specific clinical application is a challenging task. After doing the experimental analysis of some state‐of‐the‐art biclustering algorithm, it is found that the algorithm ‘runibic’ is efficient and performs effectively on most of the aspects [35]. In this paper, we have used the ‘runibic’ biclustering algorithm for extracting the biologically significant biclusters from the RNA‐Seq gene‐expression data. The first time, runibic biclustering algorithm is applied to the RNA‐Seq data. The runibic algorithm is the parallel form of unibic biclustering algorithm [29]. Several existing biclustering algorithms failed to perform efficiently on large‐scale datasets but runibic algorithm performs efficiently on large‐scale datasets. Another reason behind selecting the runibic algorithm is it performs well on all important aspects related to biclustering problems such as overlapping, noise, stable output, bicluster size, biological significance, comprehensive search etc. The runibic biclustering algorithm majorly extracts trend preserving biclusters but it is also able to extract all the remaining types of biclusters [22, 34]. Overall the runibic algorithm is the better algorithm for the bicluster extraction from the gene‐expression data. It also performs effectively on RNA‐Seq data. Very few biclustering algorithms produce better results on RNA‐Seq datasets because most of the biclustering algorithms are proposed for the microarray datasets.
2.2.3 Gene set enrichment analyses
Gene set enrichment analysis is used for identifying the biological significance of the biclusters. Online Generic GO Term Finder tool has used for the gene set enrichment analysis. The biological significance of the biclusters is validated with the help of p ‐value. p‐Value is the probability of seeing at least a particular number of genes out of the total genes in the list which are annotated to GO term. The value signifies that how well a group of genes match with different GO categories. The bicluster which satisfies the criteria of p ‐value <0.01 is biologically significant bicluster. Bicluster with lesser p ‐value will be more significant. Hence, we have used the various p ‐values such as 0.01 and 0.001 for getting more significant biclusters. In this way, set of biologically significant biclusters have been identified.
Genes in the biologically significant biclusters are actively involved in many biological processes. Therefore, the set of significant biclusters are used for the construction of GCN and insignificant biclusters have not used for the further process.
2.2.4 Construction of GCN
GCN plays a vital role in understanding the functionality of the co‐expressed genes. Construction of conditions specific GCN involves three steps. The first step is computing the difference matrix of the biclusters with respect to the conditions. The runibic algorithm extracts the coherent evolution biclusters. In the proposed approach, we are using the coherent evolution biclusters which are extracted by the ‘runibic’ algorithm. We have calculated the difference matrix of the biclusters with respect to the conditions. If we use the correlation matrix directly for the construction of the GCN without using the difference matrix, then we will get the irrelevant results, and hence GCN cannot be constructed properly. Therefore, accurate key genes cannot be extracted and results may get affected. If we use the correlation matrix after the difference matrix, then we will get the relevant results to the behaviour of the genes. Therefore, the difference matrix increases the correlation between the genes and gives better results. For improving the accuracy of the results, we have first computed the difference matrix. The second step is of finding the gene correlation matrix of the difference matrix using Pearson's correlation measure. An equation for Pearson's correlation is represented by the equation below:
| (1) |
where r is the correlation, N is the number of samples, and a and b are the expression levels of genes in the gene pair. The third step is the construction of un‐directed graph from the obtained gene correlation matrix. This un‐directed graph is referred to as a GCN. Here, a co‐expression network is constructed from each and every significant bicluster. While constructing the GCN, correlation threshold has been considered for getting a more accurate result. In the network, a node represents the gene and an edge represents the correlation between genes. In the proposed approach, the GCN is further used for identifying the hub genes. The same procedure is applied to all the significant biclusters for GCN construction.
2.2.5 Hub genes identification
Hub gene is the highly connected gene of the network. Hub gene explains the functional behaviour of a bicluster. From each constructed network of the biclusters, hub genes are identified by computing the degree of the node. There might be chances that similar hub genes can be extracted from more than one bicluster because of the overlapping property of the biclusters. The hub genes can be used in many clinical applications such as the prognostic and diagnostic marker for the diseases, pathway analysis, regulatory elements etc. Here, two types of networks GCN and PPIN are constructed for the hub gene identification.
Hub genes identification using GCN: The GCN is the GCN of the bicluster. For each significant bicluster, GCN is constructed. From each constructed GCN, hub genes are identified. Hub genes are more relevant to the functionality of the co‐expression network than the other genes in the GCN. For extracting hub genes, after the various experimental analysis, we have decided the threshold for the minimum number of connected genes which is more than five in the GCN. The same procedure has been applied to all GCNs for extracting the hub genes.
Hub genes identification using PPIN: For getting the more robust hub gene for the specific biclusters, we have also constructed the PPIN using online STRING software tool [36]. Highly connected genes of the PPIN are called as the hub genes of the PPIN. For extracting hub genes, after the experimental analysis, we have decided the threshold for the minimum number of connected genes which is more than five in the PPIN. In some literature, it is more than eight [37]. Hub genes obtained from the PPIN give more robustness about the biological significance.
After identification of the hub genes using both the networks GCN and PPIN, we have extracted the common hub genes from the GCN and PPIN of each bicluster. These common hub genes are the robust conditions specific hub genes for the specific bicluster. In this way, conditions specific hub genes are identified for each significant biclusters.
3 Results and discussion
The aim of the proposed approach is to extract the conditions of specific hub genes from the gene‐expression data. The ‘runibic’ biclustering algorithm has been used in the proposed approach. To validate the results of the biclustering algorithm, we performed experiments on both synthetic data and real data. We have compared the results with state‐of‐the‐art biclustering algorithms with respect to various performance measuring issues. For finding the hub genes, RNA‐Seq real datasets have been used. The results have been compared with the WCGNA‐based approach. Also, we have performed the validation of the results using various performance measuring aspects. For the experiments, high‐performance computing workstation running a Linux system has been used.
3.1 Results on synthetic data
Experiments have been performed on the synthetic dataset for validating the performance of the ‘runibic’ biclustering algorithm. Synthetic data matrix of size 1000 × 50 has been created randomly. In the synthetic dataset, various biclusters along with noise and overlapping biclusters have been implanted. Then, the ‘runibic’ biclustering algorithm is applied to the synthetic data. For performance evaluation of the algorithms, various important issues such as overlapping biclusters, noisy biclusters, bicluster accuracy and output nature have been used. The performance of ‘runibic’ algorithm has been compared with four state‐of‐the‐art biclustering algorithms such as SAMBA [26], OPSM [38], xMotif [39] and Bimax [27]. Table 1 shows the experimental results. From the experimental results, the ‘runibic’ algorithm performs effectively on most of the issues as compared with other state‐of‐the‐art biclustering algorithms.
Table 1.
Biclustering algorithms with results on synthetic data with respect to performance evaluating issues
| Algorithm | Accuracy of extracted overlapping bicluster, % | Accuracy of extracted noisy bicluster, % | Accuracy of extracted bicluster, % | Stable output nature, % |
|---|---|---|---|---|
| SAMBA | 72 | 80 | 80 | 100 |
| OPSM | 52 | 50 | 60 | 100 |
| xMotif | 0 | 27 | 40 | 20 |
| Bimax | 56 | 76 | 80 | 10 |
| runibic | 81 | 81 | 85 | 100 |
3.2 Results on real data
High‐throughput gene‐expression data are being rapidly used for clinical research [40]. Very few biclustering algorithms have applied to the RNA‐Seq data. The runibic algorithm was not previously applied to RNA‐Seq data. The first time, the runibic algorithm we have applied to the RNA‐Seq data. For the experiment, we have used the normalised datasets in the forms of FPKM and RPKM values. Experimental evaluation of various RNA‐Seq datasets has been performed by applying the runibic biclustering algorithm. The RNA‐Seq datasets used for the experiment are described in Table 2. For the experiments, R‐package of biclustering algorithm ‘runibic’ has been used. Important issues related to the biclustering problems and hub genes have been chosen for the performance evaluation of biclustering algorithm. The targeted issues are biologically significant biclusters, biologically involved processes, important hub genes and hub gene involvement in biological processes.
Table 2.
Details of used RNA‐Seq datasets
3.2.1 Biologically significant biclusters
Biologically significant biclusters are very useful in various biological predictions. We have identified biologically significant biclusters by using the online GO Term Finder tool. For the further process in stage ‘B’, only the significant biclusters have been used and ignored the insignificant biclusters. Significance of the bicluster is measured with the help of p ‐values. Lesser the p ‐value of the bicluster, the significance of the bicluster is more. Table 3 shows the results of gene set enrichment analysis for the runibic biclustering algorithms on RNA‐Seq datasets GSE49712 and GSE40419. The results include the number of biclusters extracted and the number of biologically significant biclusters enriched with GO terms with p ‐values <0.01 and 0.001. Lower the p ‐values, the biological significance of the biclusters is more. Genes in the biclusters are co‐expressed across the subset of conditions. Hence, genes in the biclusters are condition‐specific co‐expressed genes.
Table 3.
Fig. 2 represents the percentages of extracted significant biclusters are far more than the extracted insignificant biclusters. The runibic biclustering algorithm has extracted the set of biclusters at the various p ‐values. At the p ‐value <0.01, the significant biclusters obtained 74 and 55% on datasets GSE49712 and GSE40419, respectively. Similarly, at the p ‐value <0.001, the significant biclusters obtained 53 and 41% on datasets GSE49712 and GSE40419, respectively. The result shows that runibic algorithm has extracted the most significant biclusters on both the datasets as compared with the WCGNA. Hence, the runibic biclustering algorithm is an efficient and more perfect algorithm for extracting the biologically significant biclusters. Furthermore, significant biclusters have been used for identifying the hub genes.
Fig. 2.
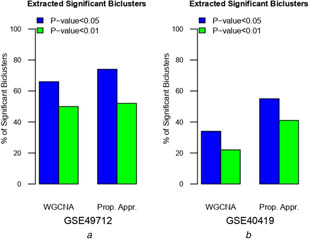
Extracted significant biclusters with respect to various p‐values from
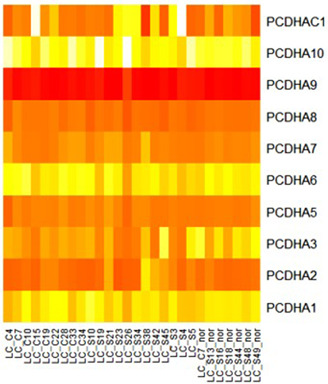
For a demonstration of the proposed approach, we have presented the example of the process for finding the hub genes from the extracted bicluster ‘Bic295’. Fig. 3 shows the heatmap of extracted biologically significant bicluster Bic295 from the dataset GSE40419. In which, the vertical axis represents the genes and the horizontal axis represents the experimental conditions. Bic295 contains total of 10 genes which are behaving co‐expressively across the 28 conditions. These 10 genes are co‐expressed across 28 conditions only, not across all 164 conditions.
Genes are always involved in various biological processes. It is not necessary that all the co‐expressed genes should be involved in the same process. There might be chances that the same gene can be involved in more than one biological process. Fig. 4 shows the genes of Bic295 involved in the several biological processes at the p ‐value <0.01. Genes PCDHA1, PCDHA2, PCDHA3, PCDHA5, PCDHA6, PCDHA7, PCDHA8, PCDHA9, PCDHA10 and PCDHAC1 are involved in the biological adhesion process and genes PCDHA1, PCDHA2, PCDHA3, PCDHA5, PCDHA6, PCDHA7, PCDHA8, PCDHA10 and PCDHAC1 are involved in the developmental process and multicellular organismal process. These relationships between the genes and the biological processes play a key role in extracting the biologically significant insights.
Fig. 4.
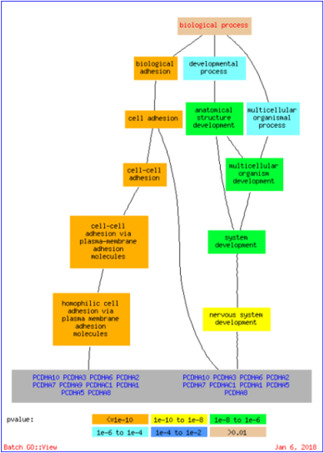
Genes of Bic295 involved in the biological processes
3.2.2 GCN construction
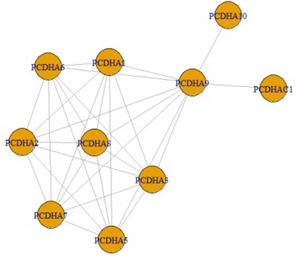
GCN has been constructed by considering the gene correlation matrix. Fig. 5 represents the corplot of the gene correlation matrix of the Bic295. The corplot represents the correlation between the genes. Dark blue colour shows the strong correlation between the genes indicated by value as 1 and dark red colour shows the negative correlation between the genes and indicated by the value −1. The figure shows the genes in the Bic295 biclusters are strongly correlated across the 28 conditions and all are showing the dark blue colour, i.e. strong correlation. Fig. 6 shows the GCN for the Bic295. We have constructed the GCN with the correlation threshold for getting more accurate results. In the entire approach, we have considered the correlation threshold for getting more accurate results. For the Bic295, all genes are satisfying the criteria of the correlation threshold . Here, we have removed the edges which are pointing to the same parent node.
Fig. 5.
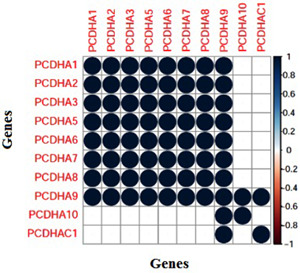
Corplot of the correlation matrix of the extracted bicluster
With the same manner, the co‐expression networks have been constructed for all significant biclusters. All these constructed GCNs are used for the identification of hub genes.
3.2.3 Hub gene identification using GCN
Hub genes from all the biologically significant biclusters have been identified by considering the highest degree of connectivity in the GCN. These hub genes are conditions specific because biclusters include only a subset of conditions, not all the conditions. From Fig. 6, we have calculated the degree of each gene of the network which is shown in Table 4. The degree of gene PCDHA9 is 9 which is the highest among all other genes with a correlation threshold . Hence, the hub gene of the Bic295 is PCDHA9.
Table 4.
Gene with its degree in the co‐expression network of Bic295 of 40,419 datasets
| Gene | Degree |
|---|---|
| PCDHA1 | 7 |
| PCDHA2 | 7 |
| PCDHA3 | 7 |
| PCDHA5 | 7 |
| PCDHA6 | 7 |
| PCDHA7 | 7 |
| PCDHA8 | 7 |
| PCDHA9 | 9 |
| PCDHA10 | 1 |
| PCDHAC1 | 1 |
Table 5 shows the WCGNA‐based extracted clusters, identified hub genes and a number of conditions across which genes of the clusters are co‐expressed for the dataset GSE49712. WCGNA has extracted only five clusters from GSE49712 dataset. Here, all clusters show a number of conditions equal to ten which is the total number of experimental conditions of the GSE49712 dataset. Since WCGNA extracts gene cluster across all experimental conditions. The identified hub genes from the clusters are KIAA0415, ZNF638, BHLHA9, GDF6 and ADAM30. All these hub genes represent all the experimental conditions.
Table 5.
Top significant cluster with hub genes and number of conditions on GSE49712 dataset using WCGNA approach
| Cluster number | Hub genes | Number of conditions |
|---|---|---|
| clust1 | KIAA0415 | 10 |
| clust2 | ZNF638 | 10 |
| clust3 | BHLHA9 | 10 |
| clust4 | GDF6 | 10 |
| clust5 | ADAM30 | 10 |
Table 6 shows the bicluster with the maximum five identified hub genes of the top significant biclusters on dataset GSE49712 using the proposed approach. These biclusters have been ranked using the p ‐values. Along with the hub genes, the third column shows the number of conditions across which the genes in the biclusters are co‐expressed. Hence, we can say that the identified hub genes are more specific to the mentioned conditions. GSE49712 dataset consists of ten conditions but obtained hub genes are specific to the <10 conditions.
Table 6.
Top significant biclusters with hub genes and the number of conditions of GSE49712 dataset using the proposed approach
| Bicluster number | Hub genes | Number of conditions |
|---|---|---|
| Bic22 | SLC6A15, PRKAR1A | 7 |
| Bic50 | APPL2, C17ORF42, CBX5 | 7 |
| Bic51 | LIMS2, RGS12, TNK2, BAG3, OAS2, STK4 | 10 |
| Bic52 | AADACL2, ACTRT1 | 9 |
| Bic53 | ADAM33, ANKRD20A2, ARHGAP5, ARL6 | 6 |
Table 7 shows the WCGNA‐based extracted clusters, identified hub genes and a number of conditions across which genes of the clusters are co‐expressed for the dataset GSE40419. WCGNA has extracted a total of 87 clusters from GSE40419 dataset. Here, we have chosen top ten clusters only. All clusters show a number of conditions equal to 164 which is the total number of experimental conditions of the GSE40419 dataset. Since WCGNA extracts gene cluster across all experimental conditions. The identified hub genes from the clusters are FCGBP, KANK2, SAMD7, ANKS3 and ZFP14. All these hub genes represent all the experimental conditions.
Table 7.
Top significant cluster with hub genes and number of conditions on GSE40419 dataset using WCGNA approach
| Cluster number | Hub genes | Number of conditions |
|---|---|---|
| clust1 | FCGBP | 164 |
| clust2 | KANK2 | 164 |
| clust3 | SAMD7 | 164 |
| clust4 | ANKS3 | 164 |
| clust5 | ZFP14 | 164 |
Table 8 shows the bicluster with maximum of five identified hub genes of the top significant biclusters on dataset GSE40419 with the correlation threshold . Along with the hub genes, the third column shows the number of conditions across which the genes in the biclusters are co‐expressed. GSE49712 datasets consist of 164 conditions but obtained hub genes are specific to the <164 conditions.
Table 8.
Top significant biclusters with hub genes and number of conditions on GSE40419 dataset
| Bicluster number | Hub genes | Number of conditions |
|---|---|---|
| Bic34 | LRRC18, CASC1,C3ORF25, STK33 | 7 |
| Bic69 | CCDC151, C5orf49, DNAI2 | 8 |
| Bic90 | CCDC74A, PACRG, LRRC10B | 7 |
| Bic100 | CCT5, VRK1, EPR1 | 8 |
| Bic295 | PCDHA1, PCDHA2, PCDHA5, PCDHA8, PCDHA9 | 28 |
| Bic319 | TEKT2, CCT7 | 9 |
From Tables 5, 6, 7, 8, the hub genes identified by the proposed approach are conditions specific and hub genes identified by the WCGNA approach are not conditions specific. WCGNA‐based hub genes are based on the clustering concept and the proposed approach‐based hub genes are based on the biclustering approach. Hence, the proposed approach‐based hub genes are conditions specific.
From the experimental results, it is found that the proposed approach produces the conditions specific hub genes from the gene‐expression data which plays a vital role in various clinical applications. Hence, we can say that the identified hub genes are more specific to the mentioned conditions. These hub genes can be used as the diagnostic and prognostic markers for the disease after the exhaustive analysis and testing by the researchers. In this manner, hub genes for all the significant biclusters have been identified.
If we compare the proposed approach with the WCGNA‐based approach, it is found that the identified hub genes using WCGNA were based on all conditions of the gene‐expression data, since the WCGNA‐based approach uses the clustering concept, whereas the proposed approach identifies the conditions of specific hub genes with the help of biclustering concept. Owing to the conditions specific hub genes, researchers will concentrate on the only specific conditions for further analysis and not on all conditions. Therefore, the extra time for the unnecessary analysis will be saved and the accuracy of the result will increase. In this way, the proposed approach will be helpful to the researchers who want to work on the hub gene applications by saving time and increasing the accuracy.
3.2.4 Hub genes identification using PPI network
For getting the more robust results of the proposed approach, we have integrated the proposed approach with PPIN. Here, we have identified the hub genes from the PPIN of the respective biclusters using the STRING software tool (http://www.networkanalyst.ca) with confidence score more than 400. We have constructed the PPIN of each significant biclusters and identified the highly connected genes from the PPIN. These highly connected genes are the hub genes for the specific set of genes across the subset of conditions. Fig. 7 shows the PPIN for the bicluster Bic295, in which gene PCDHA2 is the highly connected genes represented by red colour. Hence, we have considered it as hub gene.
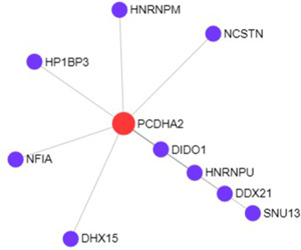
Table 9 shows the hub genes identified using PPIN for the top significant biclusters on the datasets GSE49712 with confidence score more than 400.
Table 9.
Top significant biclusters with hub genes and number of conditions of GSE49712 dataset using PPIN
| Bicluster number | Hub genes | Number of conditions |
|---|---|---|
| Bic22 | PRKAR1A, PRKAR2B | 7 |
| Bic50 | CDK1, CCNB1, CBX5 | 7 |
| Bic51 | FBXL19, APTG2, PPARG, OAS2, STK4 | 10 |
| Bic52 | ACTRT1, CAPN13 | 9 |
| Bic53 | ACTR10, ARHGAP5, ARL6, CLTC | 6 |
Table 10 shows the hub genes identified using PPIN for the top significant biclusters on GSE40419 dataset with confidence score more than 400.
Table 10.
Top significant biclusters with hub genes and number of conditions on GSE40419 dataset using PPINk
| Bicluster number | Hub genes | Number of conditions |
|---|---|---|
| Bic34 | MAP3K19, EFCAB6, LRRC18, WRD38, STK33 | 7 |
| Bic69 | MAP3K19, CFAP52, DNAI2 | 8 |
| Bic90 | PACRG, WRD38, LRRC10B, RSPH14 | 7 |
| Bic100 | CDK1, BRCA1, CCT5 | 8 |
| Bic295 | PCDHA2 | 28 |
| Bic319 | TTC16, RFX2, CCT7 | 9 |
3.2.5 Common hub genes
We have identified the conditions of specific hub genes using the GCN and PPIN for the top significant biclusters of both the datasets. Fig. 8 shows a Venn diagram for the intersection of identified hub genes from both the networks (GCN PPIN) for the bicluster ‘Bic295’. The genes PCDHA1, PCDHA2, PCDHA5, PCDHA8 and PCDHA9 are the top highly connected genes of the GCN for the bicluster ‘Bic295’ and gene PCDHA2 is the only identified hub gene of the PPIN for the bicluster ‘Bic295’. After the intersection of both the subsets of the network of genes, PCDHA2 is the only common gene obtained as a highly connected gene in both networks for the bicluster ‘Bic295’. Hence, PCDHA2 is the robust hub gene for the bicluster ‘Bic295’. In this way, we have identified the robust conditions specific hub genes for the significant biclusters.
Fig. 8.
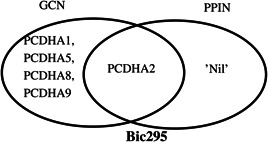
Identified conditions specific hub gene of GCN and PPIN for Bic295 of GSE40419 dataset
For the top significant biclusters of dataset GSE49712, Table 6 shows the conditions of specific hub genes using GCN and Table 9 shows the conditions of specific hub genes using the PPIN. From Tables 6 and 9, some of the hub genes are common to both GCN and PPIN networks for the respective biclusters. The results are illustrated in Fig. 9. Here, we have done the intersection of the identified hub genes from both the networks (GCN PPIN) for the same bicluster shown in the Venn diagram.
Fig. 9.
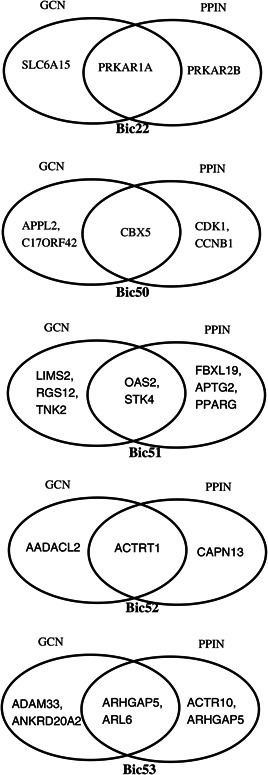
Common hub genes of GCN and PPIN on GSE49712 dataset for top significant biclusters
From the results, PRKAR1A is the obtained hub gene for the bicluster Bic22; CBX5 is the obtained hub gene for the bicluster Bic50; OAS2 and STK4 are the obtained hub genes for the bicluster Bic51; ACTRT1 is the obtained hub gene for the bicluster Bic52; and ARHGAP5 and ARL6 are the obtained hub genes for the bicluster Bic53. All these are the robust conditions specific hub genes for the respective biclusters because all are identified using the GCN and PPIN.
For the top significant biclusters of dataset GSE40419, Table 8 shows the conditions of specific hub genes using GCN and Table 10 shows the conditions of specific hub genes using the PPIN. From Tables 8 and 10, some of the hub genes are common to both GCN and PPIN networks for the respective biclusters. The results are illustrated in Fig. 10. Here, we have done the intersection of the identified hub genes from both the networks (GCN PPIN) for the same bicluster shown in the Venn diagram.
Fig. 10.
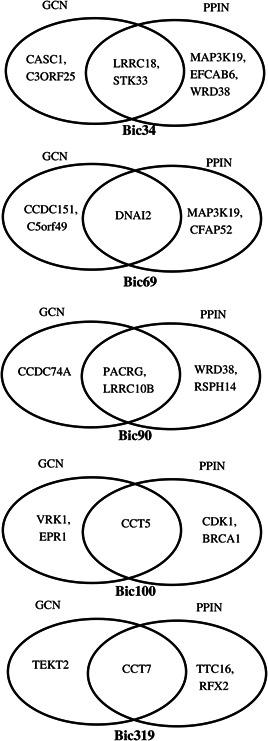
Common hub genes for top significant biclusters using GCN and PPIN on GSE40419 dataset
From the results, LRRC18 and STK33 are the obtained hub gene for the bicluster Bic34; DNAI2 is the obtained hub gene for the bicluster Bic69; PACRG and LRRC10B are the obtained hub genes for the bicluster Bic90; CCT5 is the obtained hub gene for the bicluster Bic100; and CCT7 is the obtained hub gene for the bicluster Bic319. All these are the robust conditions specific hub genes for the respective biclusters because all are identified using the GCN and PPIN.
4 Application to drug discovery
New medications are discovered by using the process of drug discovery. Drug target identification is the first step in the process of drug discovery. Abnormal changes in the expression levels of genes lead to diseases. Drug target can be identified by examining the expression profiles of the genes in specific conditions. Nowadays, gene‐expression data is available in very large size. Gene‐expression data is one of the widely used biological data in clinical research. The function of thousands of genes and the mechanisms underlying diseases can be identified by analysing the gene‐expression data. Proper analysis of gene‐expression data will help to find the solution for the many biological problems. To find out target genes from the large‐scale gene‐expression data related to the specific disease is a challenging task.
The proposed approach plays an important role in the process of drug discovery. We are identifying conditions specific hub genes from the gene‐expression data of specific diseases. These hub genes are specific to the subset of conditions not specific to all conditions of the dataset. Therefore, the pharmacist can concentrate on the hub genes of their interest. These hub genes can be condition specific. Hence, the researcher can focus on their analysis on the subset of conditions, not on all conditions. Owing to the conditions specific hub genes, exhaustive analysis can be reduced to the specific conditions. Hence, these conditions specific hub genes will help to make the process more efficient and more accurate. Conditions specific hub genes can give more accurate results and predictions. These hub genes can act as a drug target to particular diseases after the rigorous validations and testing. In this way, the proposed approach can contribute to the process of drug discovery.
5 Conclusions
In this paper, we had proposed a new approach for mining conditions specific hub genes using the biclustering algorithm and summarised the role of hub genes in the drug discovery process. High‐throughput RNA‐Seq gene‐expression data had been used as an input to the biclustering algorithm. The runibic biclustering algorithm had extracted the biologically significant biclusters efficiently. At the p ‐value <0.01, 74 and 55% of biclusters were obtained enriched with GO terms on gene‐expression datasets GSE49712 and GSE40419, respectively. Similarly, at the p ‐value <0.001, 53 and 41% of biclusters were obtained enriched with GO terms on gene‐expression datasets GSE49712 and GSE40419, respectively. The results show that runibic biclustering algorithm performed effectively on the various performance measuring issues such as overlapping, noise, stable output and accuracy on the synthetic dataset, and on real datasets at the very lesser p ‐value biclusters show the biological significance. Those significant biclusters had been used subsequently for the construction of GCN and PPIN. The first time, the GCN had been constructed using difference matrix and gene correlation matrix of the significant bicluster. Hub genes had been extracted from each GCN and PPIN with the help of connectivity degree. Finally, common hub genes from the GCN and PPIN‐based hub genes have been identified. These common genes are considered as more robust conditions specific hub genes to the respective biclusters. In this manner, conditions specific hub genes had been extracted from all the significant biclusters. The extracted hub genes were more relevant to the specific subset of conditions as compared with the hub genes identified from the clustering concept. The identified hub genes can be used in many clinical applications as prognostic and diagnostic markers.
On the basis of the observations, it is found that runibic algorithm performed effectively and efficiently on RNA‐Seq data. Identified hub genes represent the functionality of the biclusters and have been involved in various biological processes and pathways. The conditions specific hub genes will be very helpful to further research for saving the time of exhaustive analysis and increasing the accuracy. In the future, the observed findings can be used for the various biomedical applications such as drug discovery, disease diagnosis, regulatory gene identification, pathway analysis, biomarker identification etc. Therefore, the proposed approach can be useful for identifying the conditions of specific hub genes related to any diseases efficiently and accurately.
6 Acknowledgments
The authors are thankful to the Department of Computer Science and Engineering, VNIT, Nagpur(MS), India, for providing the resources and support during the course of this research. The authors also are very thankful to the Ministry of Electronics and Information Technology (MeitY), Government of India, for financial assistance.
7 References
- 1. Baldi P. Wesley Hatfield G.: ‘DNA microarrays and gene expression: from experiments to data analysis and modeling ’ (Cambridge University Press, UK, 2002) [Google Scholar]
- 2. Maind A. Raut S.: ‘Comparative analysis and evaluation of biclustering algorithms for microarray data ’, in Perez Gregorio Martinez Mishra Krishn K. Tiwari Shailesh (Eds.): ‘Networking communication and data knowledge engineering ’ (Springer, Singapore, 2018), pp. 159–171 [Google Scholar]
- 3. Ozsolak F. Milos P.M.: ‘RNA sequencing: advances, challenges and opportunities ’, Nat. Rev. Genet., 2011, 12, (2), pp. 87–98 [DOI] [PMC free article] [PubMed] [Google Scholar]
- 4. Behjati S. Tarpey P.S.: ‘What is next generation sequencing? ’, Arch. Dis. Child. Educ. Pract., 2013, 98, (6), pp. 236–238 [DOI] [PMC free article] [PubMed] [Google Scholar]
- 5. Nicolas S Julien R. Pierre G. et al.: ‘Bioinformatics for precision medicine in oncology: principles and application to the SHIVA clinical trial ’, Front. Genet., 2014, 5, p. 152 [DOI] [PMC free article] [PubMed] [Google Scholar]
- 6. Tzanis G. Berberidis C. Vlahavas I.P.: ‘Biological data mining ’, 2005.
- 7. Jake L. Min W. Deepika G. et al.: ‘Big data application in biomedical research and health care: a literature review ’, Biomed. Inf. Insights, 2016, 8, p. BII‐S31559 [DOI] [PMC free article] [PubMed] [Google Scholar]
- 8. Li X. Ng S.K. Wang J.T.: ‘Biological data mining and its applications in healthcare ’ (World Scientific Publishing Co., Inc., Singapore, 2013) [Google Scholar]
- 9. Xiao G. Pan W.: ‘Gene function prediction by a combined analysis of gene expression data and protein–protein interaction data ’, J. Bioinf. Comput. Biol., 2005, 3, (6), pp. 1371–1389 [DOI] [PubMed] [Google Scholar]
- 10. Wang Z. Gerstein M. Snyder M.: ‘RNA‐Seq: a revolutionary tool for transcriptomics ’, Nat. Rev. Genet., 2009, 10, (1), pp. 57–63 [DOI] [PMC free article] [PubMed] [Google Scholar]
- 11. Conesa A. Madrigal P. Tarazona S. et al.: ‘A survey of best practices for RNA‐Seq data analysis ’, Genome Biol., 2016, 17, (1), p. 13 [DOI] [PMC free article] [PubMed] [Google Scholar]
- 12. Liu Z.P. Wang Y. Zhang X.S. et al.: ‘Network‐based analysis of complex diseases ’, IET Syst. Biol., 2012, 6, (1), pp. 22–33 [DOI] [PubMed] [Google Scholar]
- 13. Bing Z.T. Yang G.H. Xiong J. et al.: ‘Identify signature regulatory network for glioblastoma prognosis by integrative mRNA and miRNA co‐expression analysis ’, IET Syst. Biol., 2016, 10, (6), pp. 244–251 [DOI] [PMC free article] [PubMed] [Google Scholar]
- 14. Szklarczyk R. Megchelenbrink W Cizek P. et al.: ‘WeGET: predicting new genes for molecular systems by weighted co‐expression ’, Nucleic Acids Res., 2016, 44, (D1), pp. D567–D573 [DOI] [PMC free article] [PubMed] [Google Scholar]
- 15. Liu W. Ye H.: ‘Co‐expression network analysis identifies transcriptional modules in the mouse liver ’, Mol. Genet. Genomics, 2014, 289, (5), pp. 847–853 [DOI] [PubMed] [Google Scholar]
- 16. Garcia K. Chasman D. Roy S. et al.: ‘Physiological responses and gene co‐expression network of mycorrhizal roots under K + deprivation ’, Plant Physiol., 2017, 173, (3), p. 01959 [DOI] [PMC free article] [PubMed] [Google Scholar]
- 17. Pflieger L.T. Dansithong W. Paul S. et al.: ‘Gene co‐expression network analysis for identifying modules and functionally enriched pathways in SCA2 ’, Hum. Mol. Genet., 2017, 26, (16), p. ddx191 [DOI] [PMC free article] [PubMed] [Google Scholar]
- 18. Wang X. Qian H. Zhang S.: ‘Discovery of significant pathways in breast cancer metastasis via module extraction and comparison ’, IET Syst. Biol., 2014, 8, (2), pp. 47–55 [DOI] [PMC free article] [PubMed] [Google Scholar]
- 19. Schaefer R.J. Michno J.M. Myers C.L.: ‘Unraveling gene function in agricultural species using gene co‐expression networks ’, Biochim. Biophys. Acta (BBA)‐Gene Regul. Mech., 2017, 1860, (1), pp. 53–63 [DOI] [PubMed] [Google Scholar]
- 20. Langfelder P. Langfelder M.P. Rcpp L.: ‘Package WGCNA ’, 2017.
- 21. Wani M.A. Riyaz R.: ‘A novel point density based validity index for clustering gene expression datasets ’, Int. J. Data Mining Bioinf., 2017, 17, (1), pp. 66–84 [Google Scholar]
- 22. Madeira S.C. Oliveira A.L.: ‘Biclustering algorithms for biological data analysis: a survey ’, IEEE/ACM Trans. Comput. Biol. Bioinf., 2004, 1, (1), pp. 24–45 [DOI] [PubMed] [Google Scholar]
- 23. Hartigan J.A.: ‘Direct clustering of a data matrix ’, J. Am. Stat. Assoc., 1972, 67, (337), pp. 123–129 [Google Scholar]
- 24. Cheng Y. Church G.M.: ‘Biclustering of expression data ’. ISMB, 2000, vol. 8, pp. 93–103 [PubMed] [Google Scholar]
- 25. Lazzeroni L. Owen A.: ‘Plaid models for gene expression data ’, Stat. Sin., 2002, 12, (2002), pp. 61–86 [Google Scholar]
- 26. Tanay A. Sharan R. Shamir R.: ‘Discovering statistically significant biclusters in gene expression data ’, Bioinformatics, 2002, 18, (suppl1), pp. S136–S144 [DOI] [PubMed] [Google Scholar]
- 27. Prelic A. Bleuler S. Zimmermann P. et al.: ‘A systematic comparison and evaluation of biclustering methods for gene expression data ’, Bioinformatics, 2006, 22, (9), pp. 1122–1129 [DOI] [PubMed] [Google Scholar]
- 28. Hochreiter S. Bodenhofer U. Heusel M. et al.: ‘FABIA: factor analysis for bicluster acquisition ’, Bioinformatics, 2010, 26, (12), pp. 1520–1527 [DOI] [PMC free article] [PubMed] [Google Scholar]
- 29. Zhenjia W. Guojun L. Robert R. et al.: ‘Unibic: sequential row‐based biclustering algorithm for analysis of gene expression data ’, Sci. Rep., 2016, 6, p. 23466 [DOI] [PMC free article] [PubMed] [Google Scholar]
- 30. Gao S. Karakira I. Afra S. et al.: ‘Evaluating predictive performance of network biomarkers with network structures ’, J. Bioinf. Comput. Biol., 2014, 12, (5), p. 1450025 [DOI] [PubMed] [Google Scholar]
- 31. Boyle E. Weng S. Gollub J. et al.: ‘GO: Term Finder open source software for accessing gene ontology information and finding significantly enriched gene ontology terms associated with a list of genes ’, Bioinformatics, 2004, 20, (18), pp. 3710–3715 [DOI] [PMC free article] [PubMed] [Google Scholar]
- 32. Chen L.C. Yu P.S. Tseng V.S.: ‘WF‐MSB: a weighted fuzzy‐based biclustering method for gene expression data ’, Int. J. Data Mining Bioinf., 2011, 5, (1), pp. 89–109 [DOI] [PubMed] [Google Scholar]
- 33. Zhang B. Horvath S.: ‘A general framework for weighted gene co‐expression network’ [DOI] [PubMed]
- 34. Fang E. Zhang X. Shao K.: ‘Identification of breast cancer hub genes and analysis of prognostic values using integrated bioinformatics analysis ’, Cancer Biomarkers, (Preprint), 2018, 21, (2), pp. 373–381 [DOI] [PubMed] [Google Scholar]
- 35. Orzechowski P. PaAszczyk A. Huang X. et al.: ‘Runibic: a bioconductor package for parallel row‐based biclustering of gene expression data ’, Bioinformatics, 2018, 34, (24), pp. 4302–4304 [DOI] [PMC free article] [PubMed] [Google Scholar]
- 36. Xia J. Gill E. Hancock R.E.W.: ‘Network analyst for statistical, visual and network‐based approaches for meta‐analysis of expression data ’, Nat. Protocols, 2015, 10, pp. 823–844 [DOI] [PubMed] [Google Scholar]
- 37. Yuan L. Chen L. Qian K. et al.: ‘Co‐expression network analysis identified six hub genes in association with progression and prognosis in human clear cell renal cell carcinoma (ccRCC) ’, Genomic Data, 2017, 14, pp. 132–140 [DOI] [PMC free article] [PubMed] [Google Scholar]
- 38. Ben‐Dor A. Chor B. Karp R. et al.: ‘Discovering local structure in gene expression data: the order‐preserving submatrix problem ’, J. Comput. Biol., 2003, 10, (3–4), pp. 373–384 [DOI] [PubMed] [Google Scholar]
- 39. Murali T.M. Kasif S.: ‘Extracting conserved gene expression motifs from gene expression data ’, Pac. Symp. Biocomput., 2003, 8, pp. 77–88 [PubMed] [Google Scholar]
- 40. Maind A. Raut S.: ‘Computational analysis of biclustering algorithms for identification of co‐expressed genes ’, Int. J. Data Mining Bioinf., 2017, 19, (3), pp. 243–269 [Google Scholar]