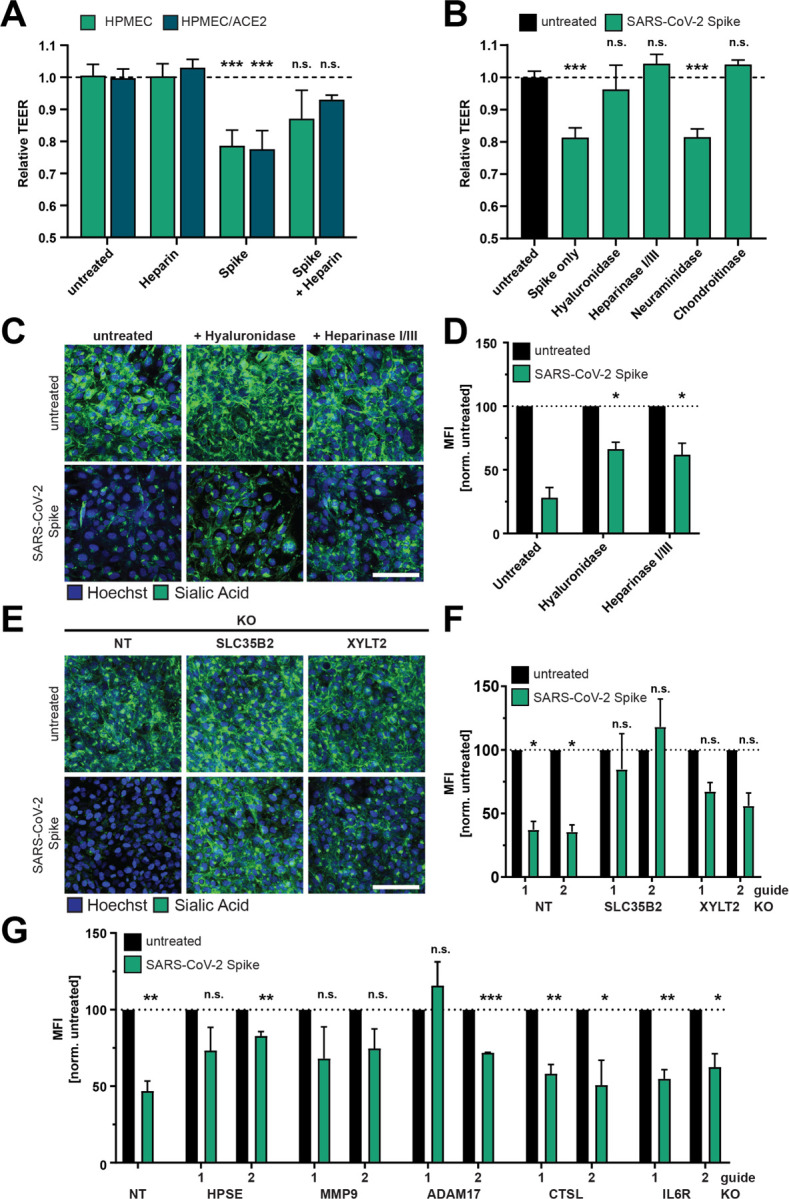
Figure 4. Glycosaminoglycans and EGL modulating enzymes are required for SARS-CoV-2 S-mediated barrier dysfunction.

(A) TEER inhibition assay on monolayers of HPMEC or HPMEC/ACE2 treated with heparin (10 μg/mL), S (10 μg/mL), or both simultaneously. TEER readings were taken 24 hpt. Data are from n=2 biological replicates. (B) A TEER inhibition assay where monolayers of HPMEC were treated with recombinant hyaluronidase (10 μg/mL), heparin lyases I and III (5 mU/mL each), neuraminidase (1 U/mL), or chondroitinase (25 mU/mL) simultaneously with S (10 μg/mL) treatment. TEER readings were taken 24 hpt. Data are from n=2 biological replicates. (C) EGL inhibition assay on HPMEC treated with hyaluronidase (10 μg/mL) or heparin lyases I and III (5 mU/mL each) and simultaneously treated with S (10 μg/mL) and fixed 24 hpt. (D) Quantification of C from n=2 biological replicates. Statistics are comparisons of indicated conditions to the S-only control condition. (E) Representative images from an EGL disruption assay of HPMEC transduced with lentiviruses encoding the indicated gene-targeting guide RNA. Cells were treated with 10 μg/mL S, and sialic acid was visualized by IFA 24 hpt. (F) Quantification of E from n=3 biological replicates. Control guide data from this panel are from the same experiment as Figure S1G. (G) Same as E and F but using the indicated guide RNAs. Non-target (NT) data are pooled from two cell line replicates. Control guide data from this panel are from the same experiments as Figure 7G. For all panels, sialic acid is stained with Wheat Germ Agglutinin in green and nuclei are stained with Hoechst in blue with scale bars at 100 μm. MFI is mean fluorescence intensity. Dotted lines are the normalized untreated control conditions. All data are plotted as mean +/− SD (TEER) or SEM (EGL) with *p<0.05, **p<0.01, ***p<0.001, and n.s. p>0.05 by ANOVA with multiple comparisons.
