

Abstract
Background:
Predicting Parkinson’s disease (PD) progression may enable better adaptive and targeted treatment planning.
Objectives:
Develop a prognostic model using multiple, easily acquired longitudinal measures to predict temporal clinical progression from Hoehn and Yahr (H&Y) Stage 1 or 2 to Stage 3 in early PD.
Methods:
Predictive longitudinal measures of PD progression were identified by the joint modeling method. Measures were extracted by multivariate functional principal component analysis methods and used as covariates in Cox proportional hazards models. The optimal model was developed from the Parkinson’s Progression Marker Initiative (PPMI) dataset and confirmed with external validation from the Longitudinal and Biomarker Study in PD (LABS-PD) study.
Results:
The proposed prognostic model with longitudinal information of selected clinical measures showed significant advantages in predicting PD temporal progression in comparison to a model with only baseline information (iAUC=0.812 vs 0.743). The modeling results allowed the development of a prognostic index for categorizing PD patients into low, mid, and high risk of progression to HY 3 that is offered to facilitate physician-patient discussion on prognosis.
Conclusions:
Incorporating longitudinal information of multiple clinical measures significantly enhances predictive performance of prognostic models. Furthermore, the proposed prognostic index enables clinicians to classify patients into different risk groups, which could be adaptively updated as new longitudinal information becomes available. Modeling of this type allows clinicians to utilize observational datasets that inform on disease natural history and specifically, for precision medicine, allows insertion of a patient’s clinical data to calculate prognostic estimates at the individual case level.
Keywords: Functional data analysis, Joint modeling, Personalized medicine, PPMI, Prediction
Introduction
Parkinson’s disease (PD) is a progressive, neurodegenerative disease with motor and non-motor manifestations. Without curative treatments, it is critical to identify significant, well-validated measures predictive of PD progression.1 While previous literature studied a broad range of PD-related symptoms,2–4 the heterogeneity of signs and symptoms has led to difficulty in predicting disease progression. Further, symptomatic treatment by dopaminergic therapies positively impacts function in PD, but obscures issues of natural disease progression.
Several endpoints can define PD severity and categorize subjects. Among them, the Hoehn and Yahr (H&Y) scale is one of the most commonly used categoric measures to assess overall PD dysfunction.5 Schrag et al.6 examined the responsiveness of various PD progression measures and suggested that the H&Y stage was the most practical and clinically pertinent index of disease severity. Hence, the H&Y scale has served as a validated endpoint to measure PD progression in many published studies. Goetz et al.7 found significant differences in 4-year clinical impairment progression between PD patients at H&Y stage 2 vs. stage 3, indicating a clinical distinction in disease progression trajectory before and after patients reached H&Y 3 with balance deficits. Although H&Y 3 transition has since been widely used as the index of disease progression,8–11 only baseline variables have traditionally been included in projection calculations. To the best of our knowledge, no previous research focused on predicting time to H&Y 3 transition using multiple longitudinally assessed measures in early PD.
METHODS
Overview
To develop a prognostic model for risk calculation at any time for disease progression defined as the H&Y transitioning to stage 3, we chose an approach that incorporates clinical information via the multivariate functional principal component analysis (MFPCA) method. This approach extracts features of multiple longitudinal PD measures and includes the feature scores in a prognostic model. We developed the proposed model using the Parkinson’s Progression Marker Initiative (PPMI) study data, which collected a broad range of clinical longitudinal measures evaluated frequently in initially untreated PD patients. For external validation, we used the Longitudinal and Biomarker Study in PD (LABS-PD) PostCEPT cohort to assess the predictive performance of our prognostic model in an independent sample. Moreover, we estimated a set of prognostic indices to calculate the subject-level risk scores which can be dynamically updated over time as new measurements become available. Based on the latest risk scores, PD patients can be categorized into low, mid, and high risk of disease progression, in order to facilitate targeted treatments and recommendations. The proposed approach enables clinicians and patients to make clinical decisions based on prognostic estimates developed from patient-specific information.
Study Population
PPMI is a multicenter study of early PD subjects studied longitudinally (https://www.ppmi-info.org). PPMI recruited 423 newly diagnoses PD subjects (421 enrolled at H&Y stages 1 and 2) who were treatment-naive at baseline. Clinical measurements, imaging data, and biological samples were collected over a period of 6 years. PD patients were scheduled to visit sites every 3 months from baseline during their first year, with follow-up visits conducted every 6 months thereafter. The maximum follow up time was 9 years. The LABS-PD study (ClinicalTrials.gov: NCT00605163) enrolled a total of 537 PD subjects from the PRECEPT trial (463 enrolled at H&Y stages 1 and 2).12 Multiple motor and non-motor measures were evaluated annually during the study follow-up period.
Our research goal was to enhance predictive estimates of PD progression by incorporating multiple longitudinal risk factors in our models. We defined disease progression as the change from baseline H&Y stages 1 or 2 to Stage 3, meaning that unilateral (1) or bilateral (2) PD without balance compromise evolved to include balance deficits (3). Following Müller’s definition,9 we defined time to PD progression (primary outcome) as the time from study enrollment to patients reaching H&Y stage 3 for the first time. Subsequent observations were not included in our analysis and model building and we did not consider the issue of reverting back to H&Y stage 2 in our study. The following candidate longitudinal measures were selected based on their availability in the PPMI study and their association with PD progression described in previous literature:13 Movement Disorder Society Unified Parkinson’s Disease Rating Scale (MDS-UPDRS) Parts 1, 2, and 3, Montreal Cognitive Assessment (MoCA), Total Scale for Outcomes in Parkinson’s – autonomic questionnaire (SCOPA-AUT), Modified Schwab and England Activities of Daily Living Scale (SEADL), Symbol Digit Modalities Test (SDMT), Geriatric Depression Scale (GDS), Letter Number Sequencing (LNS), Semantic Verbal Fluency (SFT), and Questionnaire for Impulsive-Compulsive Disorders in Parkinson’s Disease (QUIP). The predictive model controlled for patient age, gender, years of PD diagnosis. Two patients from the PPMI study who had already reached H&Y stage 3 at baseline were excluded from the analysis. Descriptive statistics for these key baseline variables in PPMI and LABS-PD are presented in Table 1.
Table 1:
Baseline demographic and disease characteristics of PPMI and LABS-PD participants.
| Progressed to H&Y stage 3* | Not progressed to H&Y stage 3* | Combined | |
|---|---|---|---|
| PPMI Study | |||
| Total | 114 | 309 | 423 |
| Age (years) | 65.54 (8.94) | 60.28 (9.62) | 61.70 (9.72) |
| Education (years) | 15.50 (2.75) | 15.58 (3.05) | 15.56 (2.97) |
| Male | 68 (59.65%) | 209 (67.64%) | 277 (65.48%) |
| White | 108 (94.74%) | 293 (94.82%) | 401 (94.80%) |
| Right handed | 102 (89.47%) | 273 (88.35%) | 375 (88.65%) |
| Years of PD diagnosis (years) | 0.61 (0.59) | 0.52 (0.52) | 0.55 (0.54) |
| MDS-UPDRS Part 1 | 7.49 (4.84) | 4.85 (3.49) | 5.56 (4.06) |
| MDS-UPDRS Part 2 | 7.88 (4.64) | 5.16 (3.76) | 5.89 (4.19) |
| MDS-UPDRS Part 3 | 23.42 (8.66) | 19.96 (8.76) | 20.89 (8.85) |
| MoCA | 26.82 (2.45) | 27.25 (2.26) | 27.14 (2.32) |
| SDMT | 37.52 (9.31) | 42.54 (9.54) | 41.18 (9.73) |
| SEADL | 91.67 (6.23) | 93.69 (5.67) | 93.14 (5.89) |
| QUIP | 0.36 (0.74) | 0.34 (0.90) | 0.34 (0.86) |
| SCOPA-AUT | 10.48 (5.77) | 7.66 (5.20) | 8.42 (5.50) |
| LNS | 10.06 (2.54) | 10.78 (2.68) | 10.59 (2.66) |
| GDS | 2.81 (2.63) | 2.15 (2.35) | 2.32 (2.44) |
| SFT | 47.47 (12.34) | 49.11 (11.35) | 48.67 (11.63) |
| LABS-PD Study | |||
| Total | 191 | 352 | 543 |
| Age (years) | 66.4 (9.54) | 61.7 (9.50) | 63.4 (9.76) |
| Education (years) | 5.16 (1.73) | 5.42 (1.63) | 5.33 (1.67) |
| Male | 122 (63.9%) | 234 (66.5%) | 356 (65.6%) |
| White | 183 (95.8%) | 346 (98.3%) | 529 (97.4%) |
| Right handed | 173 (90.6%) | 304 (86.4%) | 477 (87.8%) |
| Years of PD diagnosis (years) | 4.73 (1.81) | 4.56 (1.23) | 4.62 (1.46) |
| UPDRS Part 1 | 2.03 (2.23) | 1.15 (1.25) | 1.47 (1.72) |
| UPDRS Part 2 | 9.99 (5.84) | 6.76 (3.89) | 7.91 (4.92) |
| UPDRS Part 3 | 19.9 (9.14) | 13.6 (6.99) | 15.8 (8.37) |
| MoCA | 25.4 (3.27) | 26.9 (2.46) | 26.3 (2.86) |
| SDMT | Not Available | Not Available | Not Available |
| SEADL | 85.2 (12.4) | 91.5 (7.51) | 89.3 (9.99) |
| QUIP | Not Available | Not Available | Not Available |
| SCOPA-AUT | Not Available | Not Available | Not Available |
| LNS | Not Available | Not Available | Not Available |
| GDS | 5.73 (1.72) | 5.08 (1.16) | 5.31 (1.42) |
| SFT | Not Available | Not Available | Not Available |
PD = Parkinson Disease; MDS-UPDRS = Movement Disorder Society Unified Parkinson’s Disease Rating Scale; MoCA = Montreal Cognitive Assessment; SCOPA-AUT = total Scale for Outcomes in Parkinson’s - autonomic questionnaire; SEADL = Modified Schwab and England Activities of Daily Living Scale; SDMT = Symbol Digit Modalities Test; GDS = Geriatric Depression Scale; LNS = Letter Number Sequencing; SFT = Semantic verbal fluency; QUIP = Questionnaire for Impulsive-Compulsive Disorders in Parkinson’s Disease.
Progressed to H&Y stage 3 is defined as ever reached H&Y stage 3 during patient’s follow up time, up to 9 years from baseline. If patients never reached H&Y stage 3 during follow up period, they were considered as censoring at the last observed visit.
Statistical Analysis
To model the contribution of multiple longitudinal measures in predicting PD progression time to H&Y 3, we used a novel approach to extract features of the longitudinal trajectories, which were then included in a Cox proportional hazards model. By assuming that a latent process existed for each observed longitudinal measure, the functional principal component analysis (FPCA) approach can be employed to extract subject-specific features of the longitudinal process as a set of scores.14 There are two distinct advantages of utilizing FPC scores to capture subjects’ longitudinal features. First, FPCA methods do not assume a parametric model for underlying longitudinal trajectories, thus they are more robust in modelling longitudinal data compared to other parametric models which may deviate from the truth. Secondly, only observed values are used for extracting longitudinal measurement features, so that missing visits are allowed without need for imputation when calculating FPC scores. One limitation of using FPCA on multiple measures separately is the possibility of significant correlation among measures, leading to multicollinearity in subsequent analysis. To address this problem, we adopted the multivariate functional principal component analysis (MFPCA) method proposed by Happ et al.15 MFPCA adequately captures the joint variation of measures and accounts for the potential correlation directly while estimating the covariance matrices. To model the survival outcome, the MFPC scores, representing the features of the longitudinal trajectories, were used as additional risk factors in a Cox model. Further details are in Section S1.
The univariate joint model of each candidate longitudinal measure was fitted to investigate strength of association with time to reaching H&Y stage 3 (Section S2). Based on Z-score of the association parameters, SEADL, MDS-UPDRS Part 2, MDS-UPDRS Part 3, LNS, and SFT were selected to be included in the prognostic model. The first ten extracted MFPC scores, accounting for at least 99% of the total variation, were included in the Cox model in addition to the selected baseline variables including age and sex. This model was referred to as MFPCA-based Cox model (Model 1). For comparison purpose, another Cox model was built using only subjects’ baseline information, including those selected baseline variables and baseline values of these five candidate longitudinal measures. We referred to this model as baseline Cox model (Model 2). The Schoenfeld residuals were used to check proportional hazards assumption. The individual and global tests for nonrandom pattern of the residuals were not significant, suggesting the proportional hazards assumption was reasonably satisfied. The technical details of Models 1 and 2 are presented in Section S3. Comparing these two models allowed us to assess the gain in predictive performance from incorporating longitudinal information. To ensure that each longitudinal measure had sufficient observations to calculate the MFPC scores, we excluded subjects who did not have a minimum of at least three valid measurements for any of the five longitudinal measures or had missing data in baseline variables, resulting in a sample size of 384.
The predictive performance of Models 1 and 2 was assessed from two aspects: discrimination (the ability to discriminate between individuals with and without an event) and calibration (how well the model predicts the observed data). The discrimination was assessed by the integrated time-dependent AUC (iAUC) on the interval from time 0 to the maximum follow-up time.16 The calibration was measured by the integrated Brier score (iBS) on the same time interval.17 The iBS is a measure of the agreement between the predicted and true risks. Higher iAUC and lower iBS usually indicate a better predictive performance. To compare the time-dependent AUC between Models 1 and 2, we adopted the Blanche et. al.18 approach to compute the confidence regions of the weighted time-dependent AUC’s and tested for differences between two models. Ten-fold internal cross-validation (CV) was repeated 100 times on the PPMI dataset. The iAUC and iBS were calculated for each repetition and averaged to assess the improvement in prediction by incorporating the longitudinal information.
External validation was conducted using the data from the LABS-PD study. Because LNS, SFT, and MDS-UPDRS measures were not collected in the LABS-PD study, measures to be included in the prognostic model were re-selected among commonly available longitudinal data. Based on Z-score of joint model association parameters, we selected the top 5 measures (SEADL, UPDRS Part 2, UPDRS Part 3, GDS, and UPDRS Part 1) to be included in the external validation prognostic models for the LABS-PD study. The MFPCA-based Cox model and baseline Cox model for external validation were referred as Model 1a and Model 2a, respectively. MDS-UPDRS measures were used in Model 1a and Model 2a for PPMI study due to data availability. The forms of the prognostic models for external validation were similar to the models for internal validation, with the only difference being in the set of five longitudinal measures. In Model 1a and Model 2a, after excluding subjects with less than three observations for any of the measures or those who had any missing baseline variables, we obtained 400 subjects in the PPMI study and 458 subjects in the LABS-PD study. To evaluate the predictive performance of the proposed models within and across studies, internal validation was first conducted in the PPMI and LABS-PD studies separately, external validation was then conducted by applying the fitted models using the PPMI data on the LABS-PD data.
It is often desirable to make prognosis in the context of dynamic prediction, i.e., the conditional probability of an event, given the information leading up to the time of prediction. In this study, we developed a MFPCA-based prognostic index (PI), which allows for dynamic prediction of patients’ risk of progression. The prognostic index was computed from the inference results of Model 1 using the PPMI data. The formula of calculating the PI is presented in Section S4. As patients come in for additional visits, the PI can be recalculated by updating MFPCA scores using patients’ most recent longitudinal observations. Therefore, the prognostic index is reflective of the progression of patients’ disease profile and it makes full use of the collected data in a sequential manner. Based on the PI’s quartiles, we categorized subjects into 3 risk groups (< 50%: low risk, 50% – 75%: mid risk, > 75%: high risk) in regards of risk of transitioning to H&Y stage 3. For comparison, we also calculated PI using only baseline information (based on Model 2) and compared performance between these two approaches. With the calculated PI, we could estimate the survival probability for different risk groups based on the Kaplan-Meier estimates. Subject-specific survival risk of time to H&Y stage reaching 3 can also be calculated with the approximated baseline risk function (e.g., using piece-wise constant functions or splines).
Results (Table 2)
Table 2:
Comparison of prognostic models in both internal validation and external validation.
| Model 1 | Model 2 | Model 1a | Model 2a | |||
|---|---|---|---|---|---|---|
| Study | iAUC INT | iAUC INT | iAUC INT | iAUC EXT | iAUC INT | iAUC EXT |
| 0.812 | 0.743 | 0.794 | - | 0.756 | - | |
| - | - | 0.798 | 0.728 | 0.719 | 0.709 | |
| iBS INT | iBS INT | iBS INT | iBS EXT | iBS INT | iBS EXT | |
| PPMI | ||||||
| 0.110 | 0.128 | 0.112 | - | 0.123 | - | |
| - | - | 0.114 | 0.146 | 0.131 | 0.145 |
iAUC = integrated time-dependent AUC; iBS = integrated Brier score; INT = internal validation; EXT = external validation. MDS-UPDRS = Movement Disorder Society Unified Parkinson’s Disease Rating Scale; SEADL = Modified Schwab and England Activities of Daily Living Scale; GDS = Geriatric Depression Scale; LNS = Letter Number Sequencing; SFT = Semantic verbal fluency;
In PPMI study, measures included in Model 1 and Model 2 are: SEADL, MDS-UPDRS Part 2, MDS-UPDRS Part 3, LNS, and SFT; measures included in Model 1a and Model 2a are: SEADL, MDS-UPDRS Part 2, MDS-UPDRS Part 3, GDS, and MDS-UPDRS Part 1.
In LABS-PD study, measures included in Model 1a and Model 2a are: SEADL, UPDRS Part 2, UPDRS Part 3, GDS, and UPDRS Part 1.
There were 111 H&Y 3 conversion events out of 384 PPMI subjects. The internal prediction performance index (iAUCINT) was significantly higher in Model 1 by incorporating longitudinal information (0.812 vs. 0.743) than Model 2. To illustrate, at Month 70, ROC curves of Model 1 and Model 2 (Figure S1) showed that Model 1 performed better than Model 2. For a given specificity, the sensitivity from Model 1 is markedly higher than Model 2, e.g., given 90% specificity, Models 1 and 2 have 59% vs. 41% in sensitivity, while given 80% specificity, Models 1 and 2 have 76% vs. 52% in sensitivity. Similarly, the internal Brier Score (iBSINT) indicated a smaller bias in Model 1 in comparison to Model 2 (0.110 vs. 0.128). This difference along with 95% confidence bands is illustrated graphically in Figure S2. The AUC of Model 1 is significantly higher than Model 2 after month 40 (e.g., multiplicity adjusted p-value = 0.001 at month 50).
We selected Model 1 to compute the prognostic index (PI) due to its higher iAUC and lower iBS. Based on the regression coefficients estimated from Model 1, we calculated the PI for each subject in the PPMI study and categorized them into low, mid, and high risk groups using PI quartiles. A similar prognostic risk score based on Model 2 was also calculated for comparison purpose. Figure 1 displays the Kaplan-Meier (K-M) curves categorized into risk groups by the two prognostic models. Comparing the Kaplan-Meier curves of the 3 risk groups based on Model 1 (left panel) and Model 2 (right panel), we found that the PI calculated from Model 1 distinguished the risk groups more clearly, whereas the risk groups derived from Model 2 overlapped in their survival probability confidence bands, especially in later follow-up times. The findings from Figures 1 and S2 suggest that Model 1 performed better than Model 2 in discrimination, especially after month 40.
Figure 1:
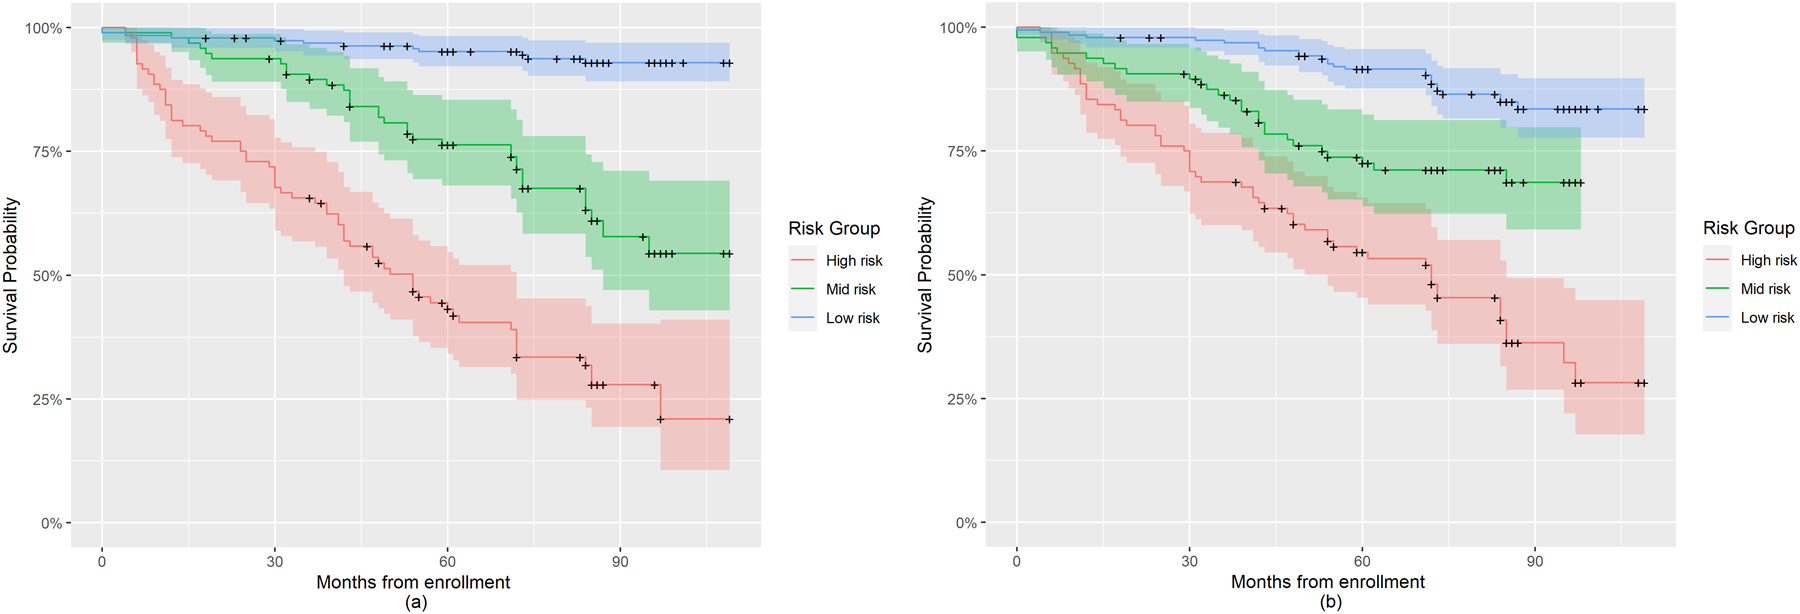
Kaplan-Meier plot for risk groups of PD progression to H&Y stage 3 in the PPMI study based on Prognostic Index derived using Model 1 and Model 2. (a) Risk groups categorized based on Model 1; (b) Risk groups categorized based on Model 2.
Table 2 shows the external validation under Model 1a (MFPCA-based Cox regression) and Model 2a (baseline Cox regression). First, 10-fold internal cross validation was performed for each combination of models (Model 1a, Model 2a) and study data (PPMI, LABS-PD). Then external validation was performed using models built with the PPMI study and validated on the LABS-PD study. For Model 1a and Model 2a, there are 114 H&Y 3 conversion events out of 400 PPMI subjects, while for LABS-PD study, there are total 151 events out of 458 subjects. Although the five newly chosen longitudinal measures in Model 1a and Model 2a were not optimal due to data availability, they still allowed Model 1a and Model 2a to perform well relative to the iAUCs in Model 1 and Model 2. We continued to observe in both the internal and external validation that the model containing longitudinal information outperforms the model with only baseline covariates. These findings suggested that the improved prognostic ability derived from including longitudinal clinical assessments is consistent even across studies. Figure 2 shows the Kaplan-Meier plot for the low, mid, and high risk groups of PD progression in the PPMI study (left panel) and the LABS-PD study (right panel), respectively, based on Model 1a. The pattern of risk curves for the LABS-PD study was similar to that in the PPMI study, where low risk group identified based on PPMI-derived PI had the highest progression free survival probability, high risk group had the lowest survival probability. The plots suggest that the PI formula derived from Model 1a using the PPMI study data can be applied to LABS-PD to classify subjects with different levels of progression risk. Moreover, the low risk subject group in the LABS-PD study progressed faster than the same risk group in PPMI, indicating a potential more severe underlying disease severity.
Figure 2:
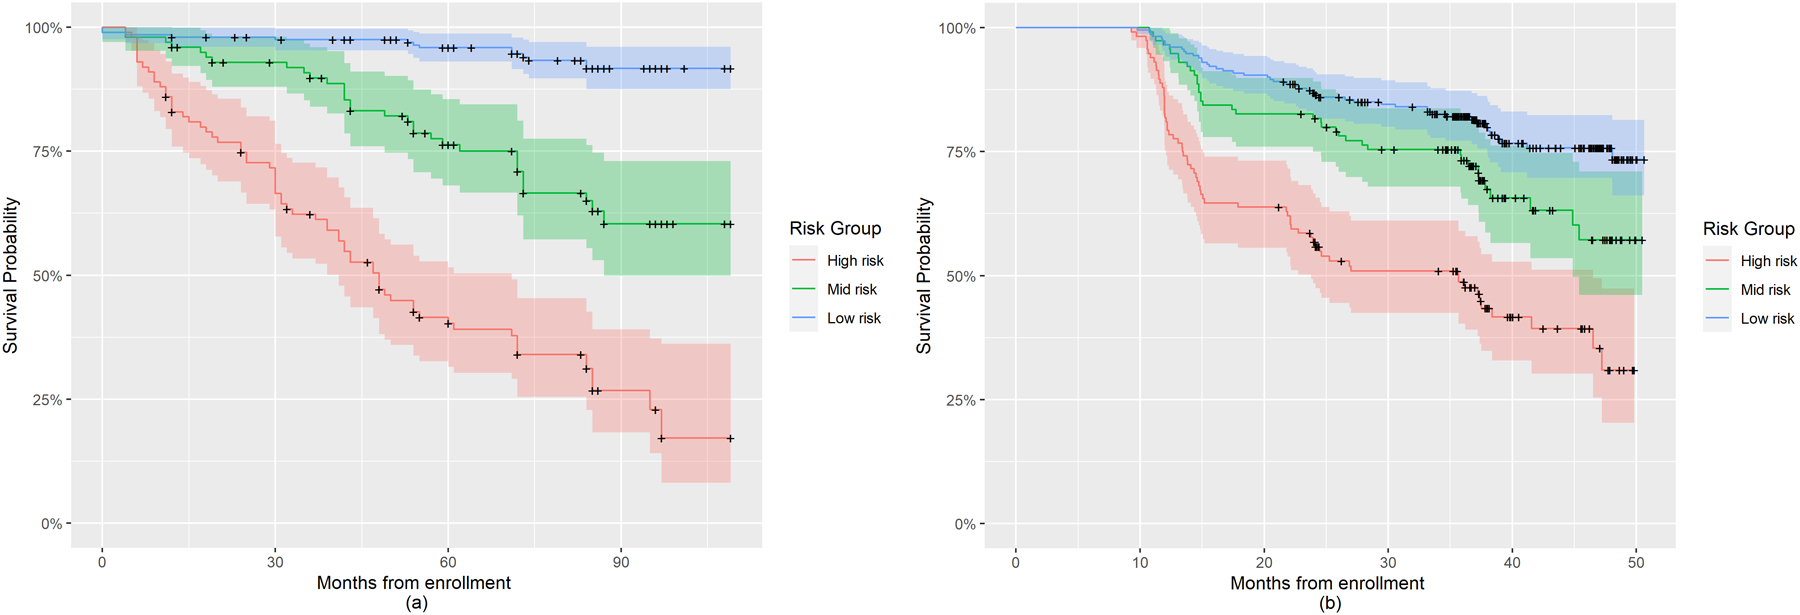
Kaplan-Meier plot for risk groups of PD progression to H&Y stage 3 in the PPMI and LABS-PD studies based on Prognostic Index derived using Model 1a. (a) Kaplan-Meier plot for subjects in PPMI; (b) Kaplan-Meier plot for subjects in LABS-PD.
Clinical Examples
To illustrate how PI scores can be dynamically updated when additional longitudinal information becomes available, we selected one target PPMI patient with his clinical measures over time (Table 3.1). The PI scores based on available longitudinal measures up to each time point are presented in Table 3.2, along with dynamically updated MFPCA scores. At baseline, the PI of this patient was 2.03, which categorized him into the low conversion risk group. When post-baseline longitudinal information became available, the PI score was updated and increased to 2.89 at year 1, which categorized him into the mid risk group. Moreover, using the first four years of longitudinal information, we updated his PI score to 3.31 at year 4, which categorized him into the high risk group. This indicates that the risk of transitioning to H&Y 3 continued to increase for this patient and clinical intervention may be necessary. Further investigation of how the PI performs among different risk groups is presented in Section S5 and Figure S3. This dynamically updated PI may help clinicians make informed decision and provide targeted patient counseling, especially for those who are at increased risk. To facilitate the clinical use of this complex model, we have developed a web-based interactive calculator https://xuehan-ren.shinyapps.io/shinyppmi2/, which takes as input an individual’s baseline characteristics and the longitudinal measurements up to the present time. It will produce the prognostic index and the risk group classification. Figure S4 suggests that the proportional hazards assumption was reasonable.
Table 3.1.
Baseline characters and longitudinal measures of the target PPMI participant.
| Baseline Characters | Baseline |
|---|---|
| Age in Years | 59 |
| Gender | Male |
| Longitudinal measures | Baseline | Year 1 | Year 2 | Year 3 | Year 4 | Year 5 |
|---|---|---|---|---|---|---|
| SEADL | 90 | 90 | 80 | 90 | 80 | 70 |
| MDS-UPDRS 2 | 15 | 9 | 15 | 15 | 18 | 17 |
| MDS-UPDRS 3 | 27 | 41 | 36 | 38 | 36 | 44 |
| LNS | 12 | 11 | 8 | 11 | 7 | 8 |
| SFT | 51 | 39 | 38 | 35 | 40 | 36 |
PD = Parkinson Disease; MDS-UPDRS = Movement Disorder Society Unified Parkinson’s Disease Rating Scale; SEADL = Modified Schwab and England Activities of Daily Living Scale; LNS = Letter Number Sequencing; SFT = Semantic verbal fluency.
Table 3.2.
Dynamic updating of MFPC scores and prognostic index.
| Longitudinal measures | Baseline | Year 1 | Year 2 | Year 3 | Year 4 | Year 5 |
|---|---|---|---|---|---|---|
| MFPCscores 1 | −5.43 | −66.38 | −66.12 | −104.11 | −106.39 | −110.81 |
| MFPCscores 2 | −31.51 | −24.82 | −24.69 | −18.48 | −33.49 | −38.49 |
| MFPCscores 3 | −21.36 | 17.43 | 16.06 | 23.34 | 12.36 | 9.96 |
| MFPCscores 4 | 38.6 | −20.92 | −29.22 | −38.14 | −28.14 | −22.15 |
| MFPCscores 5 | −11.81 | −5.76 | −6.85 | −11.12 | −6.58 | −2.35 |
| MFPCscores 6 | 1.48 | −3.26 | 1.80 | 8.46 | −9.14 | −8.40 |
| MFPCscores 7 | −2.96 | −13.40 | −13.15 | −20.16 | −9.85 | −8.65 |
| MFPCscores 8 | −2.08 | 2.99 | −2.93 | 2.16 | 7.86 | 11.89 |
| MFPCscores 9 | −1.12 | 0.31 | −0.50 | 3.96 | 3.22 | 4.89 |
| MFPCscores 10 | 5.40 | 6.84 | 6.76 | −0.94 | 2.75 | 7.59 |
| Prognostic Index | 2.03 | 2.89 | 2.95 | 2.86 | 3.31 | 3.36 |
| Risk Group | Low | Mid | Mid | Mid | High | High |
MFPCscores = Multivariate Functional Principal Component scores.
The MFPCA scores represent the feature extracted from longitudinal trajectories of multiple clinical measures, it can be thought as a set of feature scores describing subject-specific changing pattern in clinical measures of interest
Discussion
PD progression is of clinical interest, and the H&Y scale has been shown to be a valid endpoint for assessing disease severity.6 Goetz et al.7 showed a significant difference in motor impairment progression between H&Y 2 and 3 patients. In stage 2, parkinsonian impairment could be stabilized over 4 years with dopaminergic drugs at the expense of dyskinesia, while in stage 3, impairment progressed regardless of treatment intervention. Therefore, predicting the time to transition from H&Y 2 to 3 is clinically meaningful, and identifying markers that track progression rate can help clinicians monitor the conversion risk to H&Y 3.
The existing prognostic models to predict PD progression are either simple logistic regression or Cox regression models that only account include baseline information,19, 20 or univariate longitudinal models predicting rates of change in longitudinal scores rather than time to disease progression.13 Relatively few studies accounted for longitudinally derived measurements when modeling PD progression, while no previous study utilized multiple measures and their longitudinal patterns of progression to predict H&Y transition. He and Luo21 proposed a joint model of multilevel item response theory sub-model and Cox sub-model to assess the effect of tocopherol on slowing PD progression. Iddi et al.22 applied a joint mixed-effects model on PD diagnostic category and found specific binding ratio on striatum and total UPDRS scores best provided discrimination among disease stages. However, the predictive performance of these models in regards of PD progression was not assessed.
We propose a novel prognostic model of time to H&Y 3 based on from longitudinally derived measures using the Multivariate Principal Component Analysis (MFPCA) method. While Generalized Estimating Equation (GEE) is widely used to model effects of time and time-varying measures, it is a marginal model which focuses on population mean and not capable of predicting subject-specific event risk. In contrast, our proposed model predicts each individual’s PD progression risk based on longitudinal information, and the risk prediction can be dynamically updated to reflect the latest disease profile.
Based on absolute Z-scores from joint models, five longitudinal PPMI measurements of were found most predictive of time to H&Y 3 conversion. Including selected measures, an optimal MFPCA-based Cox model was constructed and validated. When benchmarked against the conventional Cox model with baseline information only, our proposed model demonstrated better predictive performance, i.e., higher iAUC and lower iBS. Results indicated that the improvement by using MFPCA-based Cox model was significant in later prediction times, suggesting that with more available observations, we were able to make better prediction of PD progression risk. The comparison results remained consistent in external validation using LABS-PD data, indicating a generalization of our findings in other PD studies. The lower iAUC of the external validation comparing to internal validation in LABS-PD from both Model 1a and Model 2a may be due to patient population differences between two studies, i.e., while the PPMI cohort consists of only de novo PD patients, LABS-PD PostCEPT cohort has mixed population with treated PD patients. While the LABS-PD study adopted the original UPDRS scores, the PPMI study uses the revised MDS-UPDRS. The use of different rating scales may further affect the iAUC when comparing across studies. Moreover, model overfitting may be present in Model 1a used in the PPMI study, because it included twelve covariates (ten extracted MFPC scores, plus age, and sex) with fewer than ten survival events per covariate (111 events in final PPMI analysis set). Reducing the number of MFPC score variables could address this issue, leading to a more robust model. This possibility warrants further investigation.
Our analytic approach is also innovative in offering a prognostic index incorporating longitudinal measures and dynamically classifying patients into one of three risk groups for H&Y 3 conversion. If validated in wide clinical settings, this approach would allow patients and caregivers to understand the current prognosis in a data-driven way while making it simple to understand in the context of one’s own past and present information. The prognosis is anchored in data from all patients with PD, but is individualized with the patient’s own evolving data set of disability and impairment measurement. The approach is highly flexible and allows ongoing data collection to refine the model and new markers of interest to be added.
Study limitations include the requirement for subjects to have at least three observations for each of the selected longitudinal measures to ensure estimation accuracy. In the case of small sample sizes, excluding subjects without sufficient longitudinal observations may lead to a model that is inapplicable to a more heterogeneous PD population. Because visits were scheduled every 6 months, the exact H&Y stage transition time cannot be directly dated. We will consider this form of interval censoring in future works. Expanding the number of data assessments has the potential to enhance predictive precision as well as to protect against problems of missing values, since systematically collected longitudinal data allows applications of such refined strategies as multidimensional latent linear mixed modelling, allowing a patient’s prior and future data to impute a missing value with enhanced accuracy.23 We chose five specific tests in our model, due to their availability across the multiple datasets. We do not purport that these scales are the decisive prognosis elements, but their longitudinal changes accurately determine H&Y prognosis.
Lastly, we only evaluated clinical measures. Recent studies suggest potential associations between imaging and biological measures from non-clinical domains) and neurological diseases.24, 25 Assessing PD progression using measures from such domains may amplify prognostic estimates and warrants further investigation. In the absence of curative treatments for PD, our study proposes an efficient monitoring method based on multivariate longitudinal observations to identify patients with different progression risks, allowing clinicians to provide prognostic information and personalized treatments based on disease progression estimates.
Supplementary Material
Acknowledgments
Data used in the preparation of this article were obtained from the Parkinson’s Progression Markers Initiative (PPMI) database (https://www.ppmi-info.org/data). For up-to-date information on the study, visit https://www.ppmi-info.org. PPMI – a public-private partnership – is funded by the Michael J. Fox Foundation for Parkinson’s Research and funding partners, including Abbvie, Allergan, Amathus, Avid, Biogen, Biolegend, Bristol-Myers-Squibb, Celgene, Denali, GE Healthcare, Genentech, Glaxo-Smith-Kline, Golub Capital, Handl therapeutics, Insitro, Janssen Neuroscience, Lilly, Lundbeck, Merck, MesoScale Discovery, Pfizer, Piramal, Prevail, Roche, Sanofi Genzyme, Servier, Takeda, Teva, UCB, Verily, Voyager therapeutics. Drs. Goetz and Stebbins work at Rush University where the Parkinson’s Disease Program is supported as a Clinical Center of Excellence by the Parkinson’s Foundation.
Funding sources for study:
The research of Sheng Luo was supported by National Institute on Aging (grant number: R01AG064803). The Rush Parkinson’s Disease and Movement Disorders Program is a designated Clinical Center of Excellent supported by the Parkinson’s Foundation.
Financial Disclosures of all authors (for the preceding 12 months)
XR: Salary: Gilead Sciences
JL: Salary: Duke University
CGG: Consulting or Advisory Board Membership with honoraria: none
Grants/Research: Funding to Rush University Medical Center from NIH, Department of Defense, and Michael J. Fox Foundation for research conducted by Dr. Goetz.
Honoraria: Presidential stipend from the International Parkinson and Movement Disorder Society paid to Rush University Medical Center as part of Dr. Goetz’s salary. Faculty stipends from the American Academy of Neurology. Guest professorship honorarium provided by University of Chicago and NorthShore University Health System.
Intellectual Property Rights: None
Ownership Interests: None
Royalties: Elsevier Publishers, Wolters Kluwer Publishers
Salary: Rush University Medical Center
GTS: Consulting and Advisory Board Membership with honoraria: Acadia, Pharmaceuticals, Adamas Pharmaceuticals, Inc., Biogen, Inc., Ceregene, Inc., CHDI Management, Inc., Cleveland Clinic Foundation, Ingenix Pharmaceutical Services (i3 Research), MedGenesis Therapeutix, Inc., Neurocrine Biosciences, Inc., Pfizer, Inc., Tools-4-Patients, Ultragenyx, Inc., Sunshine Care Foundation.
Grants and Research: National Institutes of Health, Department of Defense, Michael J. Fox Foundation for Parkinson’s Research, Dystonia Coalition, CHDI, Cleveland Clinic Foundation, International Parkinson and Movement Disorder Society, CBD Solutions.
Honoraria: International Parkinson and Movement Disorder Society, American Academy of Neurology, Michael J. Fox Foundation for Parkinson’s Research, Food and Drug Administration, National Institutes of Health, Alzheimer’s Association.
Intellectual Property Rights: None
Ownership interests: None
Royalties: None
Expert Testimony: None
Salary: Rush University Medical Center
SL: Consulting and Advisory Board Membership with honoraria: National Institutes of Health, CHDI Management, Inc.
Grants and Research: National Institutes of Health, CHDI, International Parkinson and Movement Disorder Society, Parkinson’s Foundation.
Honoraria: St. Jude Children’s Hospital.
Intellectual Property Rights: None
Ownership Interests: None
Royalties: None
Expert Testimony: None
Salary: Duke University
Footnotes
Financial Disclosure/Conflict of Interest: None
References
- 1.Marek K, Chowdhury S, Siderowf A, et al. The Parkinson’s Progression Markers Initiative (PPMI)–establishing a PD biomarker cohort. Annals of Clinical and Translational Neurology 2018;5:1460–1477. [DOI] [PMC free article] [PubMed] [Google Scholar]
- 2.Antonini A, Barone P, Marconi R, et al. The progression of non-motor symptoms in Parkinson’s disease and their contribution to motor disability and quality of life. Journal of Neurology 2012;259:2621–2631. [DOI] [PubMed] [Google Scholar]
- 3.Barone P, Antonini A, Colosimo C, et al. The PRIAMO study: a multicenter assessment of nonmotor symptoms and their impact on quality of life in Parkinson’s disease. Movement Disorders: Official Journal of the Movement Disorder Society 2009;24:1641–1649. [DOI] [PubMed] [Google Scholar]
- 4.Cooper JA, Sagar HJ, Jordan N, Harvey NS, Sullivan EV. Cognitive impairment in early, untreated Parkinson’s disease and its relationship to motor disability. Brain 1991;114:2095–2122. [DOI] [PubMed] [Google Scholar]
- 5.Hoehn MM, Yahr MD. Parkinsonism: onset, progression, and mortality. Neurology 1998;50:318–318. [DOI] [PubMed] [Google Scholar]
- 6.Schrag A, Spottke A, Quinn NP, Dodel R. Comparative responsiveness of Parkinson’s disease scales to change over time. Movement Disorders: Official Journal of the Movement Disorder Society 2009;24:813–818. [DOI] [PubMed] [Google Scholar]
- 7.Goetz CG, Stebbins GT, Blasucci LM. Differential progression of motor impairment in levodopa‐treated Parkinson’s disease. Movement Disorders: Official Journal of the Movement Disorder Society 2000;15:479–484. [DOI] [PubMed] [Google Scholar]
- 8.Djaldetti R, Rigbi A, Greenbaum L, Reiner J, Lorberboym M. Can early dopamine transporter imaging serve as a predictor of Parkinson’s disease progression and late motor complications? Journal of the Neurological Sciences 2018;390:255–260. [DOI] [PubMed] [Google Scholar]
- 9.Müller J, Wenning G, Jellinger K, McKee A, Poewe W, Litvan I. Progression of Hoehn and Yahr stages in Parkinsonian disorders: a clinicopathologic study. Neurology 2000;55:888–891. [DOI] [PubMed] [Google Scholar]
- 10.Sato K, Hatano T, Yamashiro K, et al. Prognosis of Parkinson’s disease: time to stage III, IV, V, and to motor fluctuations. Movement Disorders: Official Journal of the Movement Disorder Society 2006;21:1384–1395. [DOI] [PubMed] [Google Scholar]
- 11.Zhao YJ, Wee HL, Chan YH, et al. Progression of Parkinson’s disease as evaluated by Hoehn and Yahr stage transition times. Movement Disorders 2010;25:710–716. [DOI] [PubMed] [Google Scholar]
- 12.Ravina B, Tanner C, DiEuliis D, et al. A longitudinal program for biomarker development in Parkinson’s disease: a feasibility study. Movement Disorders: Official Journal of the Movement Disorder Society 2009;24:2081–2090. [DOI] [PubMed] [Google Scholar]
- 13.Latourelle JC, Beste MT, Hadzi TC, et al. Large-scale identification of clinical and genetic predictors of motor progression in patients with newly diagnosed Parkinson’s disease: a longitudinal cohort study and validation. The Lancet Neurology 2017;16:908–916. [DOI] [PMC free article] [PubMed] [Google Scholar]
- 14.Yao F, Müller H-G, Wang J-L. Functional data analysis for sparse longitudinal data. Journal of the American Statistical Association 2005;100:577–590. [Google Scholar]
- 15.Happ C, Greven S. Multivariate functional principal component analysis for data observed on different (dimensional) domains. Journal of the American Statistical Association 2018;113:649–659. [Google Scholar]
- 16.Uno H, Cai T, Tian L, Wei L-J. Evaluating prediction rules for t-year survivors with censored regression models. Journal of the American Statistical Association 2007;102:527–537. [Google Scholar]
- 17.Gerds TA, Schumacher M. Consistent estimation of the expected Brier score in general survival models with right‐censored event times. Biometrical Journal 2006;48:1029–1040. [DOI] [PubMed] [Google Scholar]
- 18.Blanche P, Dartigues JF, Jacqmin‐Gadda H. Estimating and comparing time‐dependent areas under receiver operating characteristic curves for censored event times with competing risks. Statistics in Medicine 2013;32:5381–5397. [DOI] [PubMed] [Google Scholar]
- 19.Macleod AD, Dalen I, Tysnes OB, Larsen JP, Counsell CE. Development and validation of prognostic survival models in newly diagnosed Parkinson’s disease. Movement Disorders 2018;33:108–116. [DOI] [PMC free article] [PubMed] [Google Scholar]
- 20.Velseboer DC, de Bie RM, Wieske L, et al. Development and external validation of a prognostic model in newly diagnosed Parkinson disease. Neurology 2016;86:986–993. [DOI] [PMC free article] [PubMed] [Google Scholar]
- 21.He B, Luo S. Joint modeling of multivariate longitudinal measurements and survival data with applications to Parkinson’s disease. Statistical Methods in Medical Research 2016;25:1346–1358. [DOI] [PMC free article] [PubMed] [Google Scholar]
- 22.Iddi S, Li D, Aisen PS, et al. Estimating the evolution of disease in the Parkinson’s Progression Markers Initiative. Neurodegenerative Diseases 2018;18:173–190. [DOI] [PMC free article] [PubMed] [Google Scholar]
- 23.Luo S, Lawson AB, He B, Elm JJ, Tilley BC. Bayesian multiple imputation for missing multivariate longitudinal data from a Parkinson’s disease clinical trial. Statistical methods in medical research 2016;25:821–837. [DOI] [PMC free article] [PubMed] [Google Scholar]
- 24.Li K, O’Brien R, Lutz M, Luo S, Initiative AsDN. A prognostic model of Alzheimer’s disease relying on multiple longitudinal measures and time-to-event data. Alzheimer’s & Dementia 2018;14:644–651. [DOI] [PMC free article] [PubMed] [Google Scholar]
- 25.Paulsen JS, Long JD, Ross CA, et al. Prediction of manifest Huntington’s disease with clinical and imaging measures: a prospective observational study. The Lancet Neurology 2014;13:1193–1201. [DOI] [PMC free article] [PubMed] [Google Scholar]
Associated Data
This section collects any data citations, data availability statements, or supplementary materials included in this article.