Abstract
Objective:
Tissue-engineered tracheal grafts(TETG) offer a potential solution for repair of long-segment airway defects. However, pre-clinical and clinical TETGs have been associated with chronic inflammation and macrophage infiltration. Macrophages express great phenotypic heterogeneity (generally characterized as classically-activated(M1) vs. alternatively-activated(M2)) and can influence tracheal repair and regeneration. We quantified and characterized infiltrating host macrophages using mouse microsurgical tracheal replacement models.
Methods:
We assessed macrophage infiltration and phenotype in animals implanted with syngeneic tracheal grafts, synthetic TETGs or partially decellularized tracheal scaffolds(DTS).
Results:
Macrophage infiltration was observed following tracheal replacement with syngeneic trachea. Both M1 and M2 macrophages were present in native trachea and increased during early tracheal repair(p=0.014), with an M1/M2 ratio of 0.48±0.15. In contrast, orthotopic implantation of synthetic TETG resulted in a shift to M1 predominant macrophage phenotype with an increased M1/M2 ratio of 1.35±0.41 by 6 weeks following implant(p=0.035). Modulation of the synthetic scaffold with the addition of polyglycolic acid(PGA) resulted in a reduction of M1/M2 ratio due to an increase in M2 macrophages(p=0.006). Using systemic macrophage depletion, M1/M2 ratio reverted to native values in synthetic TETG recipients and was associated with an increase in graft epithelialization. Macrophage ratio seen in DTS were similar to native values.
Conclusions:
M1 and M2 macrophages are present during tracheal repair. Poor epithelialization with synthetic TETG is associated with an elevation of the M1/M2 ratio. Macrophage phenotype can be altered with scaffold composition and host-directed systemic therapies. DTS exhibit M1/M2 ratios similar to those seen in native trachea and syngeneic tracheal replacement.
Level of Evidence:
N/A
Keywords: tracheal transplant, tracheal replacement, regenerative medicine, macrophages
1. Introduction
Tissue engineered tracheal grafts (TETG) have the potential to create a tracheal substitute that is comparable to native tissue. However, the search for the ideal tracheal replacement remains elusive due to delayed epithelialization, collapse, and chronic inflammation of the graft 1–5. Notably, chronic inflammation seen in TETG has been attributed to macrophage infiltration and foreign body response 5.
Beyond their impact in wound repair and remodeling, macrophages play an important role in regenerative medicine 6–8. Macrophages have been found to orchestrate critical processes of repair including granulation tissue formation, extracellular matrix remodeling, and angiogenesis. However, macrophage dysregulation is implicated in the pathologies of conditions including laryngotracheal stenosis, acute lung injury, and atherosclerosis 6,9–13. As a result, there is growing interest in macrophage-based therapies to modulate both macrophage infiltration and their phenotype 11. The trachea is populated with interstitial macrophages, which have recently been identified as distinct from their alveolar counterpart 14. These interstitial macrophages infiltrate the epithelial submucosa in response to injury; specifically, alternatively-activated M2 macrophages are upregulated and play an important role in epithelial repair 15–17.
Macrophage phenotypes exist on a spectrum, with M1 and M2 representing the two predominant subtypes 18–20. Macrophage polarization has implications in disease prognosis and can be influenced by the local microenvironment 12,21–25. Macrophage phenotype within a given microenvironment is often articulated in the form of a ratio of M1 and M2 subtypes 26–28. The M1/M2 ratio serves as an indicator for the influence of macrophages within a microenvironment on inflammation, tissue regeneration and repair 29. Recent studies have explored directed therapies to modulate the M1/M2 ratio to effect outcomes in tissue-engineered constructs 20.
Many factors can influence macrophage phenotype in tissue engineering, including biomaterial selection, host-mediated inflammation, and foreign body response 30. In this study, we use a mouse model of orthotopic tracheal replacement and quantify macrophage infiltration and phenotypes during the repair of long-segment tracheal defects. Characterizing macrophage infiltration in conditions of normal repair, we first assess macrophage infiltration and phenotype under “ideal” conditions using syngeneic tracheal grafts. To explore the potential role of macrophages on outcomes seen in preclinical models of TETG regeneration, we then quantify the effect of scaffold selection on macrophage phenotype in a mouse model of tracheal replacement in synthetic and decellularized grafts. Understanding that macrophage overabundance could be contributing to outcomes, we then assess graft regeneration in the setting of macrophage depletion.
2. Materials and Methods
2.1. Animal care and ethics statement
The Institutional Animal Care and Use Committee of the Abigail Wexner Research Institute at Nationwide Children’s Hospital (Columbus, OH) reviewed and approved the protocol (AR15–00090). Representatives of the animal care staff monitored the research animals during all phases of the project. All animals received humane treatment following standards published by the Public Health Service, National Institutes of Health (Bethesda, MD) in the Care and Use of Laboratory Animals (2011), and US Department of Agriculture (USDA) regulations outlined in the Animal Welfare Act.
2.2. Scaffold fabrication
2.2.1. Syngeneic trachea graft (STG) harvest
Six to eight-week-old female C57BL/6J mice were euthanized pharmacologically and mechanically with bilateral pneumothoraces. A midline incision was made and the trachea was exposed. A 3~4 mm tracheal segment was excised and placed in chilled phosphate buffered saline (PBS).
2.2.2. Synthetic tracheal scaffold fabrication
Tracheal scaffolds made from electrospun polyethylene terephthalate (PET) / polyurethane (PU) and co-electrospun PET/PU with polyglycolic acid (PGA) (300 μm wall thickness) were manufactured as previously described (Nanofiber Solutions, Columbus, OH, USA) 4. Scaffolds were then plasma treated, packaged, and sterilized by UV illumination at 35 J/cm2.
2.2.3. Decellularized tracheal scaffold (DTS) fabrication
Tracheal segments were collected in a manner similar to the STG harvest (section 2.2.1) (3~4 mm length). Decellularized tracheal scaffolds (DTS) were fabricated based on published methods 31. Grafts were subjected to a graded sodium dodecyl sulfate (SDS) treatment before immersion in 1% TritonX-100 for 30 min at room temperature and 0.9% NaCl solution wash overnight at 4°C. Decellularized tracheal scaffolds (DTS) were stored in PBS (−20°C) until implantation.
2.3. Orthotopic tracheal graft implantations
To assess macrophage infiltration during “normal” tracheal repair, animals (n=20) were randomly assigned to 1 week, 2 weeks, 1 month, 6 months and 1 year time points following tracheal replacement with STG (n = 4 / time point). This was designed to account for early drop out from an overall survival rate of >80%4. Slides were inspected for quality, and three grafts were randomly selected from each group. A mouse model of patch tracheoplasty was used to evaluate synthetic grafts. Animals were randomly assigned to time points of 1, 2 and >6 weeks (n = 7 / scaffold type / time point). From this cohort, 36 / 42 animals survived to planned endpoint.
Segmental tracheal replacement with DTS was performed on animals with the endpoints of 1 month (n=12) and 3 months (n=15). Overall survival to planned endpoint was 44%. Histologic sections were assessed for quality and four animals per time point were randomly selected for characterization.
Procedures were performed in 6–8 week old, female C57BL/6J mice as previously described4. All procedures were done under general anesthesia with aseptic technique. During orthotopic replacements with STG and DTS, a 3–4 mm long segment of the host trachea was excised and replaced with the graft of interest. For synthetic TETG recipients, a 1×2 mm portion of the anterior tracheal wall was excised and replaced by a size-matched patch of electrospun PET/PU or PET/PU:PGA.
Post-operative care
Animals were administered an analgesic post-operatively (buprenorphine, 0.03 mg/kg, SC) and placed in a recovery cage on a heating pad until ambulatory. The animals were given ibuprofen (30 mg/ kg) for 48 hours in drinking water. They were observed for signs of respiratory distress, poor grooming, or weight loss. Unresolved respiratory distress or weight loss >20% were criteria for early euthanasia.
2.4. Euthanasia and sample collection
At endpoint (either experimental or humane), animals were administered an intraperitoneal overdose of ketamine/xylazine cocktail (200mg/kg ketamine, 20 mg/kg xylazine, 10 mg/kg ketoprofen). Following euthanasia, grafts were harvested and fixed in 10% neutral buffered formalin for at least 48 hours at room temperature before histological processing.
2.5. Host macrophage depletion
Clodronate (CCL) liposomes (5mg/mL) (n=3) and PBS liposomes (n=3) were injected intraperitoneally in animals at 2-day intervals beginning 3 days pre-implantation through endpoint (post-operative days 4 and 14). Systemic macrophage depletion was confirmed using flow cytometry. In brief, bone marrow was extracted from mice femur and long bones. Extracted cells were treated with RBC lysis buffer (Thermo Fisher, MA, USA). Cells were blocked with Fc-block and stained with Live/Dead-NIR (Thermo Fisher), CD45-BV510 (Biolegend, San Diego, CA, USA), Ly6C-PE (Biolegend), and F4/80-BV421 (Biolegend), fixed with 4% paraformaldehyde, then sorted using BD LSRFortessa. Data analysis was performed using the FloJo software (FlowJo LLC, Ashland, Oregon).
2.6. Histological analysis
To assess the graft-host interface, segmental grafts (STG and DTS) were sectioned longitudinally and the patch grafts (synthetic TETG) were sectioned axially (4 μm) with 3 sequential sections per slide. Immunofluorescence staining was performed to identify basal progenitor cells (K5+) and ciliated epithelial cells (ACT+)4.
Immunohistochemical staining was performed to identify macrophages and macrophage phenotypes using adjacent sections on the same slide32. Primary antibodies were diluted in Dako Antibody Diluent (Agilent). Secondary antibody binding was achieved with incubating a 1:1500 dilution of goat anti-rabbit IgG biotinylated antibodies (Vector) for 30 minutes before binding of horseradish peroxidase conjugated with streptavidin (Vector). Sections were developed with 3,3-diaminobenzidine (DAB) and counterstained with Gill’s hematoxylin.
Macrophage density (cells/mm2) over the graft or patch and the host tracheal section was calculated using ImageJ software. M1/M2 ratio was measured by dividing the density of M1 macrophages (iNOS+) by the density of M2 macrophages (CD206+) in adjacent sections.
2.6.1. CD68 immunohistochemistry
For immunohistochemical analysis of CD68+ macrophages, the tissue sections were stained with Goat Anti-Rabbit CD68 (1:2000 dilution, Abcam #ab125212, Abcam, Cambridge, MA) as the primary antibody and the DAB incubation time was 1 minute.
2.6.2. iNOS immunohistochemistry
For immunohistochemical analysis of iNOS+ macrophages, tissue sections were stained with Goat Anti-Rabbit iNOS (1:1000 dilution ratio, Abcam #ab3521) as the primary antibody with DAB incubation for 1 minute. M1 macrophages were identified as CD68+ and iNOS+.
2.6.3. CD206 immunohistochemistry
For immunohistochemical analysis of CD206+ macrophages, the sections were stained with Goat Anti-Rabbit CD206 (1:16000 dilution ratio, Abcam #ab64693) as the primary antibody and DAB incubation for 30 seconds. M2 macrophages were identified as CD68+ CD206+.
2.6.4. Keratin 5 (K5) and acetylated tubulin (ACT) immunofluorescence and quantification
The primary antibody used for K5 immunofluorescence staining was Rabbit Anti-K5 (1:1000 dilution ratio, AF-138, Biolegend). Immunofluorescence was detected using Alexa Fluor 594 donkey anti-rabbit IgG (1:500 dilution ratio, A21207, Invitrogen, Carlsbad, California, USA). The primary antibody used for ACT staining was Mouse Anti-ACT (1:8000 dilution ratio, Invitrogen) and the secondary antibody used was Alexa Fluor 488 goat anti-mouse IgG H&L (1:500 dilution ratio, Invitrogen). K5 and ACT coverage (% width) was calculated for each zone using ImageJ software and mean ± standard deviation was obtained for each patch.
2.7. Statistical analysis
Data normality was evaluated by the Shapiro-Wilk test (S-W). Data with normal distribution were analyzed with ordinary one-way ANOVA and Tukey’s multiple comparisons tests. Data without normal distribution were analyzed with Kruskal-Wallis and Mann-Whitney t-test. All analyses were performed with GraphPad Prism 8.0 (GraphPad Software Inc., CA. USA). Quantified immunofluorescence data were expressed as mean ± standard deviation (SD). A comparison was considered significantly different when p<0.05 (two-tailed). 95% confidence intervals (CI) were included with the figures33.
3. Results
Syngeneic tracheal transplantation results in graft infiltration of macrophages
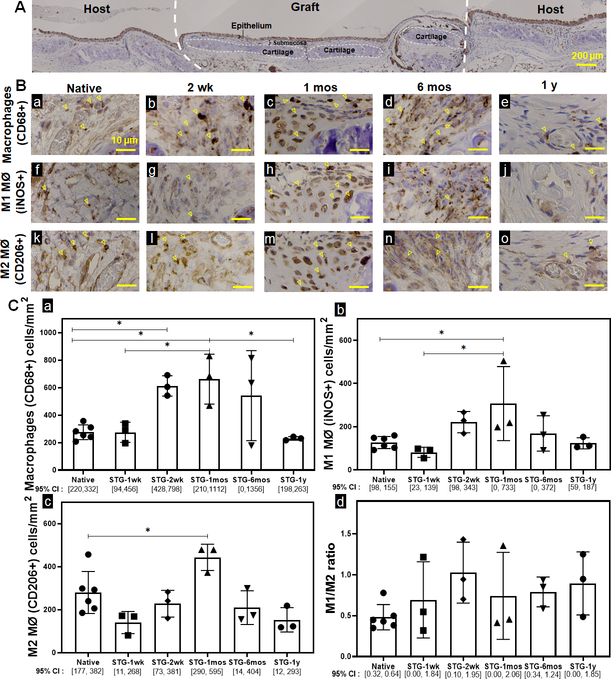
We quantified infiltrating macrophages within the epithelial submucosa of STG at 1 week (1 wk), 2 weeks (2 wk), 1 month (1 mos), 6 months (6 mos) and 1 year (1 y) (Fig 1.A). Following syngeneic tracheal replacement, tracheal macrophages (CD68+) increased at 2 wk by 122% (p=0.032) and 1 mos by 139% (p=0.014) before returning to quantities similar to native at 6 mos (Fig 1.B.a). Compared to native controls, both classically-activated M1 macrophages (iNOS+) and alternatively-activated M2 macrophages (CD206+) were elevated at 1 mos (Fig 1.B.b-c). This resulted in an M1/M2 ratio of 0.83±0.13 during syngeneic tracheal graft incorporation, equivalent to the M1/M2 ratio of 0.48±0.15 seen in native controls (p=0.87).
Figure 1. Macrophage quantification and phenotype of native and syngeneic tracheal grafts.
A. Representative IHC image of an orthotopically implanted syngeneic tracheal graft (STG) and adjacent host trachea. B. Immunohistochemistry against CD68 (a~e), iNOS (f~j), and CD206 (k~o) cells in native control and STG at post-op 1wk, 2wk, 1 mos, 6 mos and 1 y were performed on serial sections to characterize macrophages, M1 macrophages and M2 macrophages, respectively. Representative positive staining of macrophages is highlighted by arrowheads. Scale bar=10 μm. C. Data was represented as CD68+ (a), iNOS+ (b), CD206+ (c) macrophages per mm2 of the graft and the ratio of macrophage phenotype M1 (iNOS+)/ M2 (CD206+) (d) in the graft. (n=3; ANOVA with Tukey’s test; * p<0.05; Error bars represents the standard deviation)
Macrophage phenotype can be altered with modulation of synthetic scaffold composition
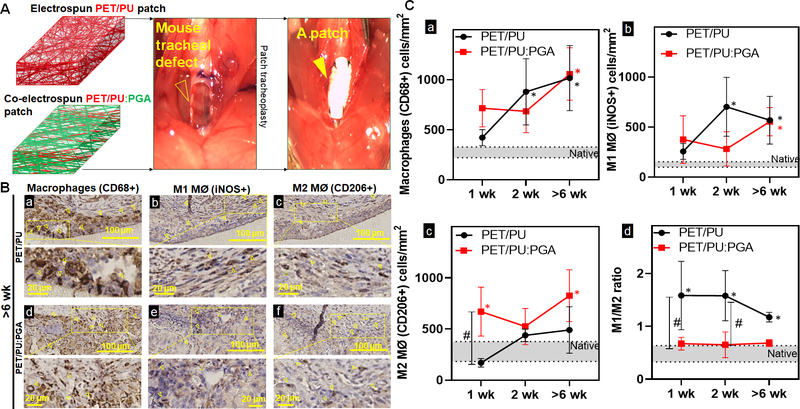
To study the influence of biomaterial selection on macrophage phenotype, we implanted synthetic TETG composed of electrospun PET/PU and PET/PU with PGA (PET/PU:PGA) (Figure 2A). Implants of both graft types resulted in an elevated macrophage infiltrate in the epithelial submucosa compared to native which did not differ between PET/PU and PET/PU:PGA grafts (Figure 2.B.–2.C.a.).
Figure 2. Macrophage quantification and phenotype in synthetic tracheal scaffolds.
A. Repair of an anterior tracheal defect (empty arrow head) with a synthetic patch (arrow head) made of either electrospun PET/PU or co-electrospun PET/PU:PGA B. Immunohistochemistry against macrophages (CD68+) (a, d), M1 macrophages (MØ) (iNOS+) (b, e), and M2 MØ (CD206+) (c, f) cells to indicate macrophage infiltrates in the submucosa over PET/PU and PET/PU:PGA patches were performed on serial axial sections. Representative images of implants >6weeks post-surgery shown. (1wk and 2wk sections not shown). Positive staining of macrophages is highlighted by the arrowheads. Scale bar=100 μm. C. Data was represented as macrophages (CD68+) (a), M1 MØ (iNOS+) (b), M2 MØ (CD206+) (c) macrophages per mm2 of the graft and the ratio of macrophage phenotype M1 (iNOS+)/ M2 (CD206+) (d) in the patch. Macrophage counts in native phenotypes are indicated by the grey bars. (n=4; ANOVA with Tukey’s test; * p<0.05 compared to native; # p<0.05 between PET/PU and PET/PU:PGA; Error bars represents the standard deviation)
However, macrophage dysregulation was observed in PET/PU grafts; represented by an increase of the M1/M2 ratio (1.44±0.23) (Figure 2C.d.). Graft modification with the addition of co-electrospun PGA led to a shift of M1/M2 ratio to 0.67±0.01, equivalent to the macrophage ratio of native trachea (Figure 2.C.d). This suggests that that the addition of PGA shifted the composition of macrophages towards the M2 phenotype.
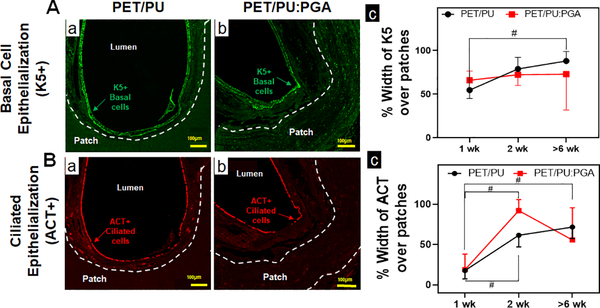
Graft epithelization was quantified for basal (K5+) and ciliated epithelial (ACT+) cells. Both grafts were found to support a similar extent of epithelialization (Figure 3).
Figure 3. Epithelialization of synthetic PET/PU and PET/PU:PGA grafts.
A. Immunofluorescent staining for K5 to identify basal epithelial progenitor cells over synthetic patches were performed. Representative immunofluorescent images of K5+ basal cells over implanted PET/PU (a) and PET/PU:PGA (b) are shown. (c) Quantification of K5+ basal cell-coverage luminal to the patches were performed. (n=5; Kruskal-Wallis test; # p<0.05; Error bars represent standard deviation). B. Immunofluorescent staining against ACT antibodies to identify ciliated epithelial cells over synthetic patches were performed. Representative immunofluorescent images of ACT+ epithelial cells over implanted PET/PU (a) and PET/PU:PGA (b) are shown. (c) Quantification of ciliated epithelial cells (ACT+) luminal to the patches were performed. (n=5; ANOVA with Tukey’s test;; # p<0.05; Error bars represents the standard deviation)
Systemic macrophage depletion can alter macrophage phenotype ratio and graft epithelialization
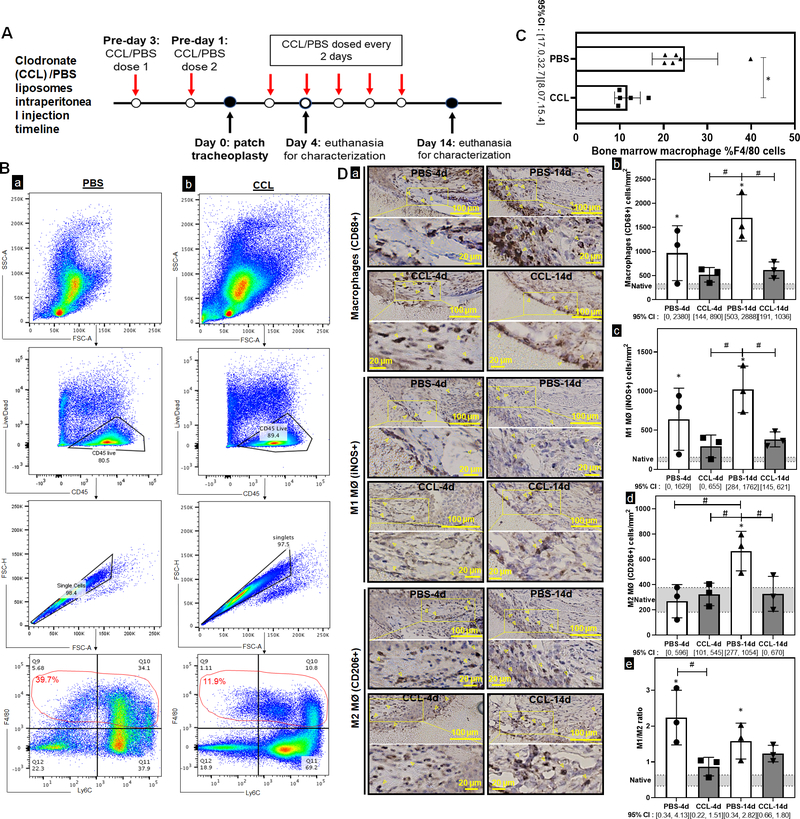
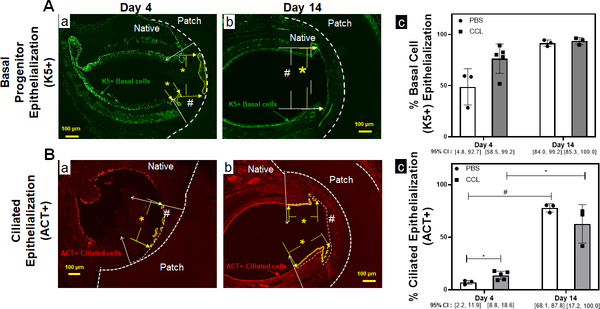
We assessed the impact of systemic host macrophage depletion on graft epithelialization and macrophage phenotype. Our dosing strategy resulted in systemic depletion of macrophages at implantation and throughout the study (Figure 4A). Systemic macrophage depletion of bone marrow CD45+/F480+ macrophages was observed at the time of graft implantation (Figure 4B–C) (p=0.006). Within the synthetic TETG neoepithelium, clodronate liposomes reduced macrophages by 46% and 62% in the epithelial submucosa compared to control at both 4-day (p=0.047) and 14-day timepoints (p=0.0002). Preferential M1 macrophage depletion was observed at day 4 where M1 macrophages decreased by 54% (p=0.0262) with no reduction of M2. This preferential M1 depletion resulted in a decrease of M1/M2 ratio to 0.86±0.26 at day 4 (p=0.006) (Figure 4D). Quantification of graft epithelialization revealed systemic macrophage depletion was associated with more differentiated epithelium (ACT+) at early time points (Figure 5). At day 14, macrophage depletion resulted in an M1/M2 ratio of 1.23±0.23, which is similar to control. By this time point, there was no observed difference in the extent of epithelialization by ciliated cells.
Figure 4. Macrophage depletion in synthetic tracheal graft implantation.
A. Intraperitoneal clodronate (CCL) or PBS liposomes were administered every other day, with the surgery occurring 3 days after the first dose to ensure depletion at time of implant. B. Flow cytometric analysis was used to characterize bone marrow macrophages in the PBS and CCL injected mice. Gating strategy for macrophages was defined as Live CD45+/F480+ cells. C. Quantification of macrophage population in bone marrow of PBS and CCL injected mice. (n=6; Welch’s t-test; * = p<0.05; Error bars represents the standard deviation) D. Immunohistochemistry against macrophages (CD68+), M1 macrophages (MØ) (iNOS+), and M2 MØ (CD206+) cells (a) were performed to indicate macrophage infiltrates in the submucosa over macrophage depleted and control mice at days 4 and 14 post-implant. Positive staining of macrophages is highlighted by the arrowheads. Scale bar=100 μm. Data was represented as macrophages (CD68+) (b), M1 MØ (iNOS+) (c), M2 MØ (CD206+) (d) macrophages per mm2 of the graft and the ratio of macrophage phenotype M1 (iNOS+)/ M2 (CD206+) (e) between PBS and CCL mice at 4d and 14d. Macrophage counts in native phenotypes are indicated by the grey bars. Error bars represents the standard deviation. (n=3; ANOVA with Tukey’s test; * p<0.05 compared to native; # p<0.05 between PBS and CCL; Error bars represent standard deviation)
Figure 5. TETG epithelization is enhanced by macrophage depletion at the early time point.
A. Immunofluorescent staining against K5 antibodies to identify basal epithelial progenitor cells over PET/PU patches in PBS (a) and CCL (b) treated mice. The working area is delineated by the white # sign between the white arrows. The region of K5 coverage is denoted by yellow * between the yellow arrows. (c) Quantification of K5+ basal cell epithelization of the graft. (n=3, Kruskal-Wallis test; Error bars represents the standard deviation) B. Immunofluorescent staining against ACT antibodies to identify ciliated epithelial cells over PET/PU patches in PBS (a) and CCL (b) treated mice. The working area is delineated by the white # sign between the white arrows. The region of ciliated epithelialization is denoted by yellow * between the yellow arrows. (c) Quantification of ciliated epithelization (ACT+) luminal to the patches. (n=3; ANOVA with Tukey’s test; * p<0.05; # p<0.05; Error bars represents the standard deviation)
Macrophage composition of tracheal regeneration in decellularized grafts is similar to native trachea
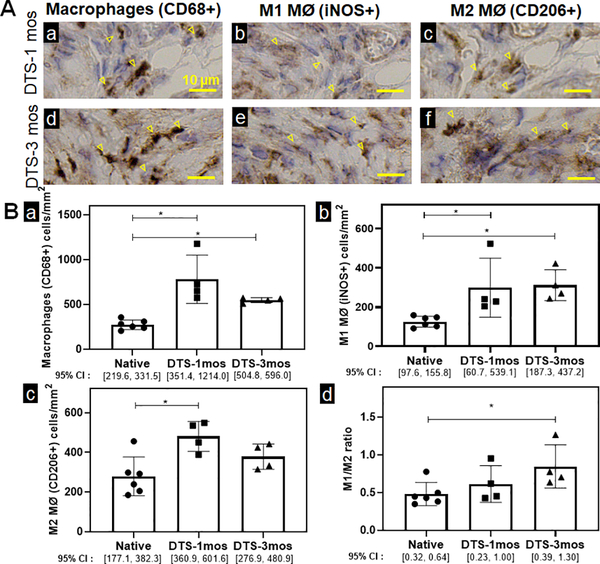
We then quantified macrophage infiltration following orthotopic tracheal replacement with decellularized tracheal grafts (DTGs). We examined the macrophage infiltrates into the decellularized graft and found macrophages (CD68+) to be elevated in decellularized grafts when compared to native controls at all time-points studied. While the M1/M2 ratio of 0.61±0.24 at 1 month is equivalent to native controls, the M1/M2 ratio in DTGs at 3 months was elevated, however remained <1 (0.84±0.28) (Figure 6).
Figure 6. Macrophage quantification and characterization of decellularized tracheal scaffolds.
A. Immunohistochemistry against macrophages (CD68+) (a), M1 macrophages (MØ) iNOS+ (b), and M2 MØ (CD206+) (c) cells were performed to indicate macrophage infiltrates in decellularized graft at 1 month and 3 months. Positive staining of macrophages is highlighted by the arrowheads. Scale bar=10 μm. B. Data was represented as macrophages (CD68+) (a), M1 macrophages (MØ) (iNOS+) (b), M2 MØ (CD206+) (c) macrophages per mm2 of the graft and the ratio of macrophage phenotype M1 (iNOS+)/ M2 (CD206+) (d) of DTS mice at 1 month and 3 months. (n=4; ANOVA with Tukey’s test; * p<0.05; Error bars represent standard deviation)
4. Discussion
In this study, we examined the dynamics of interstitial macrophage infiltration during tracheal repair. Macrophages are a heterogeneous population, and little is known about the subtypes involved in normal tracheal graft repair 16,34. We first sought to characterize macrophages during repair of syngeneic tracheal transplant, a surrogate for the ideal tracheal replacement 4,35. This method of free tracheal transplantation has proven to be well tolerated in the mouse model and results in both graft and host survival without graft collapse or stenosis 4,35,36. During syngeneic tracheal transplant, we observed a transient infiltration of macrophages highest at 1-month post-transplantation with eventual regression to native levels by 6 months. Characterizing macrophage phenotype, we observed that both phenotypes are present throughout our studied time points, suggesting that they both play a distinct role in tracheal repair.
We then characterized the influence of the scaffold on macrophage infiltration. We previously identified that synthetic TETG resulted in elevated CD68+ macrophage infiltration4. The proportion of M1 and M2 macrophages within the tracheal microenvironment was quantified using the M1/M2 ratio. Similar to disease states such as chronic obstructive pulmonary disease which exhibit increased M1/M2 ratios, we found that synthetic TETG resulted in a similar increase in M1/M2 ratio. This suggests that macrophage dysregulation is present in synthetic TETG repair 4,12,37,38.
We found that we were able to normalize M1/M2 ratio with systemic macrophage depletion using clodronate liposomes. Clodronate liposomes induce apoptosis in phagocytic cells39,40. As M1/M2 ratios can be altered by a shift in either macrophage phenotypes or a change in overall quantity, we found that our model of depletion resulted in a preferential depletion of M1 macrophages. In our mouse model of synthetic TETG, clodronate liposome-treated animals were able to normalize the M1/M2 ratio to native values. This restoration of native M1/M2 ratios corresponded with an increase in ciliated cell coverage during early repair. However, this effect is not seen at 14 days, where graft epithelialization was uniformly high. With the importance of rapid restoration of tracheal function for successful segmental replacement, this finding suggests that host-directed therapies can accelerate epithelial differentiation through the correction of macrophage dysregulation.
It should be noted that the exact mechanisms by which macrophages influence graft epithelialization remain unknown. Macrophages have been found to drive airway epithelial proliferation via Trefoil Factor 2 dependent mechanism and differentiation through the IL-6/STAT3 pathway 6,14,41,42. Since the macrophage impact on epithelial cell behavior can be context dependent, the pathways involved in the context of TETG regeneration warrants further investigation 42.
Our efforts to modulate macrophage response revealed conflicting findings. Similar to other reports, we found that graft modulation with the addition of PGA promotes M2 polarization 18,43. We found that the shift in macrophage polarization to favor M2 caused by PGA did not result in an improvement in graft epithelization. However, high levels of epithelization in our patch model was observed which may limit our ability to detect differences in graft regeneration.
We then pivoted to assess decellularized tracheal graft (DTG) as a more biocompatible scaffold for tracheal replacement 18. We observed that macrophage quantification was similar to syngeneic replacement models at 1 month. As there is no comprehensive study demonstrating M1/M2 ratio in decellularized trachea, we found that the macrophage phenotype ratio in DTS at 1 month is similar with reported data in clinically-used tissue engineered constructs44. Although the M1/M2 ratio of DTG at 3 months is elevated, its ratio of 0.84 is unlikely to be clinically significant given that there is still a larger proportion of M2 than M1 macrophages in the graft. More work to define the role of macrophage phenotype on tracheal regeneration are needed.
There are a few limitations to this study. Of the immune cell types assessed, we only assessed macrophages and their phenotype; this does not exclude the effect of other inflammatory cell types. Moreover, this study employs histologic quantification using iNOS+ cells and CD206+ cells as a marker for M1 and M2 macrophages respectively. Although these are established markers for macrophage phenotyping, it is important to acknowledge that macrophage polarization occurs along a spectrum rather than discrete M1/M2 phenotypes 18,45–47. Hence, the M1/M2 ratio was used as an alternative to better represent macrophage plasticity.
Conclusion
We present a comprehensive analysis of macrophage infiltration under various conditions of tracheal repair. Macrophage infiltration of both M1 and M2 subtypes are seen in repair of syngeneic tracheal grafts. Elevation of the M1/M2 ratio is observed with synthetic tracheal replacement. We were able to modulate the macrophage composition in our grafts without altering macrophage levels via scaffold biomaterial selection and host macrophage depletion. Decellularized tracheal grafts exhibit an M1/M2 ratio similar to native controls.
Acknowledgements:
We would like to express gratitude to the animal care and veterinary staff and the Morphology core at the Abigail Wexner Research Institute at Nationwide Children’s Hospital. Moreover, we would like to thank Tran Bourgeois, a biostatistician at the Abigail Wexner Research Institute in Nationwide Children’s Hospital for her assistance.
Financial Disclosure: The work presented is funded by NIH NHLBI K08HL138460 (TC is the recipient)
Conflict of Interest:
The author(s) declared the following potential conflicts of interest with respect to the research, authorship, and/or publication of this article: Jed Johnson is a co-founder and chief technology officer of Nanofiber Solutions, Inc. Christopher Breuer receives research support from Cook Medical (Bloomington, Indiana, USA) and Gunze Ltd (Kyoto, Japan). The remaining authors have no disclosures.
References
- 1.Chiang T, Pepper V, Best C, Onwuka E, Breuer CK. Clinical Translation of Tissue Engineered Trachea Grafts. Ann Otol Rhinol Laryngol 2016; 125:873–885. [DOI] [PMC free article] [PubMed] [Google Scholar]
- 2.Luo X, Liu Y, Zhang Z et al. Long-term functional reconstruction of segmental tracheal defect by pedicled tissue-engineered trachea in rabbits. Biomaterials 2013; 34:3336–3344. [DOI] [PubMed] [Google Scholar]
- 3.Tsukada H, Gangadharan S, Garland R, Herth F, DeCamp M, Ernst A. Tracheal replacement with a bioabsorbable scaffold in sheep. Ann Thorac Surg 2010; 90:1793–1797. [DOI] [PubMed] [Google Scholar]
- 4.Dharmadhikari S, Liu L, Shontz K et al. Deconstructing tissue engineered trachea: Assessing the role of synthetic scaffolds, segmental replacement and cell seeding on graft performance. Acta Biomater 2020; 102:181–191. [DOI] [PMC free article] [PubMed] [Google Scholar]
- 5.Pepper V, Best CA, Buckley K et al. Factors Influencing Poor Outcomes in Synthetic Tissue-Engineered Tracheal Replacement. Otolaryngol Head Neck Surg 2019; 161:458–467. [DOI] [PMC free article] [PubMed] [Google Scholar]
- 6.Yamada M, Fujino N, Ichinose M. Inflammatory responses in the initiation of lung repair and regeneration: their role in stimulating lung resident stem cells. Inflammation and regeneration 2016; 36:15. [DOI] [PMC free article] [PubMed] [Google Scholar]
- 7.Ahn HJ, Khalmuratova R, Park SA, Chung EJ, Shin HW, Kwon SK. Serial Analysis of Tracheal Restenosis After 3D-Printed Scaffold Implantation: Recruited Inflammatory Cells and Associated Tissue Changes. Tissue engineering and regenerative medicine 2017; 14:631–639. [DOI] [PMC free article] [PubMed] [Google Scholar]
- 8.Kzhyshkowska J, Gudima A, Riabov V, Dollinger C, Lavalle P, Vrana NE. Macrophage responses to implants: prospects for personalized medicine. J Leukoc Biol 2015; 98:953–962. [DOI] [PubMed] [Google Scholar]
- 9.Godwin JW, Pinto AR, Rosenthal NA. Macrophages are required for adult salamander limb regeneration. Proc Natl Acad Sci U S A 2013; 110:9415–9420. [DOI] [PMC free article] [PubMed] [Google Scholar]
- 10.Hibino N, Yi T, Duncan DR et al. A critical role for macrophages in neovessel formation and the development of stenosis in tissue-engineered vascular grafts. FASEB journal : official publication of the Federation of American Societies for Experimental Biology 2011; 25:4253–4263. [DOI] [PMC free article] [PubMed] [Google Scholar]
- 11.Spiller KL, Koh TJ. Macrophage-based therapeutic strategies in regenerative medicine. Adv Drug Deliv Rev 2017; 122:74–83. [DOI] [PMC free article] [PubMed] [Google Scholar]
- 12.Eapen MS, Hansbro PM, McAlinden K et al. Abnormal M1/M2 macrophage phenotype profiles in the small airway wall and lumen in smokers and chronic obstructive pulmonary disease (COPD). Sci Rep 2017; 7:13392. [DOI] [PMC free article] [PubMed] [Google Scholar]
- 13.Hillel AT, Samad I, Ma G et al. Dysregulated Macrophages Are Present in Bleomycin-Induced Murine Laryngotracheal Stenosis. Otolaryngology--head and neck surgery : official journal of American Academy of Otolaryngology-Head and Neck Surgery 2015; 153:244–250. [DOI] [PMC free article] [PubMed] [Google Scholar]
- 14.Tadokoro T, Wang Y, Barak LS, Bai Y, Randell SH, Hogan BL. IL-6/STAT3 promotes regeneration of airway ciliated cells from basal stem cells. Proc Natl Acad Sci U S A 2014; 111:E3641–3649. [DOI] [PMC free article] [PubMed] [Google Scholar]
- 15.Dagher R, Copenhaver AM, Besnard V et al. IL-33-ST2 axis regulates myeloid cell differentiation and activation enabling effective club cell regeneration. Nat Commun 2020; 11:4786. [DOI] [PMC free article] [PubMed] [Google Scholar]
- 16.Engler AE, Ysasi AB, Pihl RMF et al. Airway-Associated Macrophages in Homeostasis and Repair. Cell Rep 2020; 33:108553. [DOI] [PMC free article] [PubMed] [Google Scholar]
- 17.Lechner AJ, Driver IH, Lee J et al. Recruited Monocytes and Type 2 Immunity Promote Lung Regeneration following Pneumonectomy. Cell stem cell 2017; 21:120–134.e127. [DOI] [PMC free article] [PubMed] [Google Scholar]
- 18.Brown BN, Sicari BM, Badylak SF. Rethinking regenerative medicine: a macrophage-centered approach. Front Immunol 2014; 5:510. [DOI] [PMC free article] [PubMed] [Google Scholar]
- 19.Martinez FO, Gordon S. The M1 and M2 paradigm of macrophage activation: time for reassessment. F1000prime reports 2014; 6:13. [DOI] [PMC free article] [PubMed] [Google Scholar]
- 20.Alvarez MM, Liu JC, Trujillo-de Santiago G et al. Delivery strategies to control inflammatory response: Modulating M1-M2 polarization in tissue engineering applications. J Control Release 2016; 240:349–363. [DOI] [PMC free article] [PubMed] [Google Scholar]
- 21.McWhorter FY, Wang T, Nguyen P, Chung T, Liu WF. Modulation of macrophage phenotype by cell shape. Proc Natl Acad Sci U S A 2013; 110:17253–17258. [DOI] [PMC free article] [PubMed] [Google Scholar]
- 22.Becker M, De Bastiani MA, Parisi MM et al. Integrated Transcriptomics Establish Macrophage Polarization Signatures and have Potential Applications for Clinical Health and Disease. Sci Rep 2015; 5:13351. [DOI] [PMC free article] [PubMed] [Google Scholar]
- 23.Su Z, Zhang P, Yu Y et al. HMGB1 Facilitated Macrophage Reprogramming towards a Proinflammatory M1-like Phenotype in Experimental Autoimmune Myocarditis Development. Sci Rep 2016; 6:21884. [DOI] [PMC free article] [PubMed] [Google Scholar] [Retracted]
- 24.Das A, Sinha M, Datta S et al. Monocyte and macrophage plasticity in tissue repair and regeneration. The American journal of pathology 2015; 185:2596–2606. [DOI] [PMC free article] [PubMed] [Google Scholar]
- 25.Oshi M, Tokumaru Y, Asaoka M et al. M1 Macrophage and M1/M2 ratio defined by transcriptomic signatures resemble only part of their conventional clinical characteristics in breast cancer. Sci Rep 2020; 10:16554. [DOI] [PMC free article] [PubMed] [Google Scholar]
- 26.Cho DI, Kim MR, Jeong HY et al. Mesenchymal stem cells reciprocally regulate the M1/M2 balance in mouse bone marrow-derived macrophages. Experimental & molecular medicine 2014; 46:e70. [DOI] [PMC free article] [PubMed] [Google Scholar]
- 27.Liu B, Zhang M, Zhao J, Zheng M, Yang H. Imbalance of M1/M2 macrophages is linked to severity level of knee osteoarthritis. Experimental and therapeutic medicine 2018; 16:5009–5014. [DOI] [PMC free article] [PubMed] [Google Scholar]
- 28.Jayasingam SD, Citartan M, Thang TH, Mat Zin AA, Ang KC, Ch’ng ES. Evaluating the Polarization of Tumor-Associated Macrophages Into M1 and M2 Phenotypes in Human Cancer Tissue: Technicalities and Challenges in Routine Clinical Practice. Frontiers in oncology 2019; 9:1512. [DOI] [PMC free article] [PubMed] [Google Scholar]
- 29.Chen X, Tang J, Shuai W, Meng J, Feng J, Han Z. Macrophage polarization and its role in the pathogenesis of acute lung injury/acute respiratory distress syndrome. Inflammation research : official journal of the European Histamine Research Society [et al] 2020; 69:883–895. [DOI] [PMC free article] [PubMed] [Google Scholar]
- 30.Klopfleisch R Macrophage reaction against biomaterials in the mouse model - Phenotypes, functions and markers. Acta Biomater 2016. [DOI] [PubMed] [Google Scholar]
- 31.Batioglu-Karaaltin A, Ovali E, Karaaltin MV et al. Decellularization of trachea with combined techniques for tissue-engineered trachea transplantation. Clinical and experimental otorhinolaryngology 2019; 12:86. [DOI] [PMC free article] [PubMed] [Google Scholar]
- 32.Reinhardt JW, Rosado JDR, Barker JC et al. Early natural history of neotissue formation in tissue-engineered vascular grafts in a murine model. Regenerative medicine 2019; 14:389–408. [DOI] [PMC free article] [PubMed] [Google Scholar]
- 33.Stark PB. SticiGui [Chapter 26: Confidence Intervals]. 4/28/2021. Available at: https://www.stat.berkeley.edu/~stark/SticiGui/Text/confidenceIntervals.htm.
- 34.Tan SY, Krasnow MA. Developmental origin of lung macrophage diversity. Development (Cambridge, England) 2016; 143:1318–1327. [DOI] [PMC free article] [PubMed] [Google Scholar]
- 35.Genden EM, Boros P, Liu J, Bromberg JS, Mayer L. Orthotopic tracheal transplantation in the murine model. Transplantation 2002; 73:1420–1425. [DOI] [PubMed] [Google Scholar]
- 36.Kutten JC, McGovern D, Hobson CM et al. Decellularized Tracheal Extracellular Matrix Supports Epithelial Migration, Differentiation, and Function. Tissue Engineering Part A 2015; 21:75–84. [DOI] [PMC free article] [PubMed] [Google Scholar]
- 37.Dharmadhikari S, Best CA, King N et al. Mouse Model of Tracheal Replacement With Electrospun Nanofiber Scaffolds. Ann Otol Rhinol Laryngol 2019; 128:391–400. [DOI] [PMC free article] [PubMed] [Google Scholar]
- 38.Schwartz CM, Stack J, Hill CL et al. Electrospun scaffolds limit the regenerative potential of the airway epithelium. Laryngoscope investigative otolaryngology 2019; 4:446–454. [DOI] [PMC free article] [PubMed] [Google Scholar]
- 39.Lehenkari PP, Kellinsalmi M, Näpänkangas JP et al. Further insight into mechanism of action of clodronate: inhibition of mitochondrial ADP/ATP translocase by a nonhydrolyzable, adenine-containing metabolite. Molecular pharmacology 2002; 61:1255–1262. [DOI] [PubMed] [Google Scholar]
- 40.Van Rooijen N, Sanders A. Liposome mediated depletion of macrophages: mechanism of action, preparation of liposomes and applications. Journal of immunological methods 1994; 174:83–93. [DOI] [PubMed] [Google Scholar]
- 41.Shapouri-Moghaddam A, Mohammadian S, Vazini Het al. Macrophage plasticity, polarization, and function in health and disease. J Cell Physiol 2018; 233:6425–6440. [DOI] [PubMed] [Google Scholar]
- 42.Hung LY, Sen D, Oniskey TK et al. Macrophages promote epithelial proliferation following infectious and non-infectious lung injury through a Trefoil factor 2-dependent mechanism. Mucosal immunology 2019; 12:64–76. [DOI] [PMC free article] [PubMed] [Google Scholar]
- 43.Zhang J, Xie B, Xi Z, Zhao L, Cen L, Yang Y. A comparable study of polyglycolic acid’s degradation on macrophages’ activation. Mater Sci Eng C Mater Biol Appl 2020; 109:110574. [DOI] [PubMed] [Google Scholar]
- 44.Brown BN, Valentin JE, Stewart-Akers AM, McCabe GP, Badylak SF. Macrophage phenotype and remodeling outcomes in response to biologic scaffolds with and without a cellular component. Biomaterials 2009; 30:1482–1491. [DOI] [PMC free article] [PubMed] [Google Scholar]
- 45.Mirhaidari GJM, Barker JC, Zbinden JC et al. Tissue Engineered Vascular Graft Recipient Interleukin 10 Status Is Critical for Preventing Thrombosis. Advanced healthcare materials 2020; 9:e2001094. [DOI] [PMC free article] [PubMed] [Google Scholar]
- 46.Lu HL, Huang XY, Luo YF, Tan WP, Chen PF, Guo YB. Activation of M1 macrophages plays a critical role in the initiation of acute lung injury. Biosci Rep 2018; 38. [DOI] [PMC free article] [PubMed] [Google Scholar]
- 47.van Putten SM, Ploeger DT, Popa ER, Bank RA. Macrophage phenotypes in the collagen-induced foreign body reaction in rats. Acta Biomater 2013; 9:6502–6510. [DOI] [PubMed] [Google Scholar]


