

Summary
Although cell density is known to affect numerous biological processes including gene expression and cell fate specification, mechanistic understanding of what factors link cell density to global gene regulation is lacking. Here, we reveal that the expression of thousands of genes in mouse embryonic stem cells (mESCs) is affected by cell seeding density and that low cell density enhances the efficiency of differentiation. Mechanistically, β-catenin is localized primarily to adherens junctions during both self-renewal and differentiation at high density. However, when mESCs differentiate at low density, β-catenin translocates to the nucleus and associates with Tcf7l1, inducing co-occupied lineage markers. Meanwhile, Esrrb sustains the expression of pluripotency-associated genes while repressing lineage markers at high density, and its association with DNA decreases at low density. Our results provide new insights into the previously neglected but pervasive phenomenon of density-dependent gene regulation.
Subject areas: Cell biology, Stem cells research, Transcriptomics
Graphical abstract
Highlights
-
•
Cell density influences expression of thousands of genes in embryonic stem cells
-
•
Low seeding density augments differentiation efficiency via β-catenin
-
•
β-catenin works in tandem with Tcf7l1 for lineage marker induction
-
•
Esrrb opposes the action of β-catenin and Tcf7l1 by repressing their targets
Cell biology; Stem cells research; Transcriptomics
Introduction
Cell seeding density is a fundamental yet often neglected aspect of experimental design that affects numerous biological processes and pathways, including embryogenesis (Shahbazi 2020), cell cycle progression (Venugopal et al., 2018), metastasis (Guo et al., 2019), miRNA processing (Mori et al., 2014), and differentiation (Kempf et al., 2016). Cell density can vary widely between labs or even between different experimental techniques, and this can strongly influence results (Cha et al., 2017; Sukho et al., 2017; Chang et al., 2020; Hanafiah et al., 2020). For example, luciferase assays are profoundly sensitive and have been used at a density as low as 500 cells/well in a 96 well plate (1.6 × 10³ cells/cm2) (Mosaad et al., 2019). On the other hand, chromatin immunoprecipitation followed by sequencing (ChIP-seq) typically involves cells grown at high cell density. One protocol recommends a final concentration of 7 × 10⁶ cells/well in a 6 well plate, equivalent to 7.3 × 10⁵ cells/cm2 (∼450x higher than the luciferase assay) whereas another ChIP-seq protocol suggested a lower density of 1 × 10⁵ cells/cm2 (Song et al., 2015; Sullivan and Santos 2020). These discrepancies may contribute to reproducibility concerns in biomedical research (Mullane et al., 2018). Though many factors may be involved, including inconsistencies in reagents as well as human errors, we surmise that such variations in cell seeding density may contribute to lack of reproducibility.
Molecular characterization of the mechanisms connecting density to changes in cell physiology remains lacking. In particular, it remains poorly understood how density influences global gene expression and what downstream effectors are involved. Alterations in the transcriptome may explain why seeding density can affect cell fate transitions, resulting in many differentiation protocols calling for specific cell densities (Wilson et al., 2015; Mao and Zhao 2020). We contend that mouse embryonic stem cells (mESCs), the in vitro equivalent of the inner cell mass (ICM) of the blastocyst, are a superb model system to tackle this phenomenon because of their ability to differentiate into almost any other cell type (pluripotency), as well as preexisting knowledge on their gene regulation, signaling pathways, and metabolism (Beck et al., 2015; Wang and Chen 2016; Mossahebi-Mohammadi et al., 2020; Nair et al., 2020).
Here, we show that the expression of approximately 10–15% of all genes (20–30% of moderately expressed genes) in mESCs is affected by differential seeding density, both during self-renewal and differentiation. Unexpectedly, the expression of ESC core factors that sustain self-renewal is relatively constant regardless of cell density, yet upon differentiation, low cell density is critical for proper induction of lineage markers. Mechanistically, we find that β-catenin nuclear translocation is favored in conditions of low cell-cell contact. This allows β-catenin to associate with the transcription factor (TF) Tcf7l1 and co-occupy cis-regulatory elements, leading to lineage marker activation. Finally, we show that Esrrb, an orphan nuclear receptor implicated in stem cell self-renewal (Festuccia et al., 2018), opposes β-catenin/Tcf7l1 by repressing lineage markers that are normally activated at low density while also sustaining the expression of high density and pluripotency-specific genes. Esrrb genomic occupancy decreases during differentiation, particularly at low cell density. Together, our work reveals that the expression of thousands of genes is affected by changes in cell seeding density, as well as elucidates mechanisms of several transcriptional regulators that mediate density-dependent gene expression programs.
Results
Cell seeding density influences the expression of thousands of genes in mESCs
Previous research has shown that cell seeding density influences gene expression and fate specification (Kim et al., 2017; Memon et al., 2018). To our knowledge, systematic transcriptomic analysis over a broad range of seeding densities has not yet been reported. To address whether seeding density impacts the mESC transcriptome, we plated mESCs in +LIF (leukemia inhibitory factor, for self-renewal) and -LIF (differentiation) medium starting at an initial seeding density of 5×10⁵ cells (2.6×10⁵ cells/cm2) and serially diluting the cells 1:2 a total of six times, such that the lowest density was 4×10³ cells/cm2. This represents two extremes, as previous mESC studies specify densities between these two values (Liu et al., 2020a; Lackner et al., 2021). After 96 h, we performed RNA sequencing (RNA-seq) and quantified expression using kallisto (Bray et al., 2016). After filtering genes with extremely low expression across all samples, we ended up with 13,240 genes with average transcripts per million (TPMavg) > 1 out of 28,515 total genes. We then normalized the expression of each gene to average expression across all samples (log2TPM+1).
Surprisingly, in self-renewing mESCs, approximately 33% of moderately expressed genes (4,349 out of 13,240 genes) showed a 1.5 log2 variation in TPM (fold change ∼2.8x) across all seeding densities. Most of them clustered into two groups: a small group of genes active at high density whose expression goes down at low density (HDA, high density active) and a large group of genes repressed at high density that are activated at low density (LDA, low density active) (Figure 1A, Table S1). Principal component analysis (PCA) showed that the samples aligned themselves on a smooth trajectory from highest to lowest seeding density (Figure S1A), clearly revealing that seeding density alone is sufficient to influence the expression of thousands of genes.
Figure 1.

Seeding density influences the expression of numerous genes in mouse embryonic stem cells but does not perturb self-renewal
(A) Heatmap of RNA-seq performed on J1 mESCs seeded with serial dilutions starting at a concentration of 2.63 × 10⁵ cells/cm2 and ending at a concentration of 4.11 × 10³ cells/cm2 and grown in +LIF for 96 h. Transcripts per million (TPM) was calculated using kallisto and transcripts were consolidated into genes. After normalizing expression to the average (log2TPM+1 to avoid undefined results when TPM in any sample = 0, hereafter simply stated as log2), only genes showing a range of 1.5 log2 difference in TPM across samples are shown. Line graphs depict median gene expression ± interquartile range.
(B) Volcano plot depicting sleuth differential gene expression analysis of mESC RNA-seq samples corresponding to the three highest vs. three lowest seeding densities in +LIF. The TPM ratio of low density vs. high density (log2) is depicted on the x-axis, whereas -log(q-value) is shown on the y-axis. Red - upregulated, blue - downregulated genes.
(C) Scatterplots of select LDA and HDA genes with seeding density on the x-axis and TPM on the y-axis.
(D and E) RT-qPCR of (D) LDA genes or (E) HDA genes. mESCs were cultured in +LIF media for 48 h at high density (HD, 1.88 × 10⁵ cells/cm2, black bars) or low density (LD, 2.34 × 10⁴ cells/cm2, gray bars). Data were normalized using the 2–ΔΔCt method relative to Tcp1 expression and HD samples (fold change). Error bars indicate standard deviations (n = 3 biological replicates).
(F) Western blot of several proteins whose expression is impacted by seeding density in +LIF. mESCs were cultured in +LIF media for 48 h at HD or LD before whole-cell lysates were harvested in the Laemmli buffer. Antibodies were used specific to the proteins indicated using Gapdh as a loading control.
(G) Western blot of core factors in +LIF. mESCs were cultured in +LIF media for 48 h at HD, ½ HD, ¼ HD, or LD.
(H) Box plots depicting TPM of genes involved in stem cell maintenance (GO:0019827) in +LIF RNA-seq samples. Expression in the four lowest density samples was normalized to the third highest density sample. p value is derived from single factor ANOVA.
(I) Western blot of proteins involved in maintenance of stemness whose expression may be impacted by seeding density 96 h of differentiation in -LIF at HD or LD compared to their expression in +LIF at HD. Text color indicates whether the protein is known to be involved in naive (blue), primed (red), or core/general (black) pluripotency.
We then asked what pathways LDA and HDA genes are involved in. Before further analysis, we set significance thresholds to narrow down each gene category using sleuth (Pimentel et al., 2017). As input, we grouped the samples representing the three highest seeding densities and compared them against the three lowest seeding densities, generating a volcano plot that depicts TPM log2 differences as well as -log q-value (Figure 1B, Table S2). Using a -log q-value cutoff of 1.5 (q-value < 0.032), we performed gene ontology (GO) analysis, revealing that HDA genes tend to be involved in metabolism, translation, and stress response, whereas LDA genes were associated with transcriptional, post-transcriptional, and epigenetic gene regulation (Figure S1B). We propose that cells at high density (HD) undergo metabolic changes because of nutrient stress, and as for low density (LD), the enrichment of gene regulation-regulated terms is consistent with prior research implicating density in miRNA processing (Mori et al., 2014). Additional gene set enrichment analysis (GSEA) found that LDA genes are enriched for helicase activity and methylation (Figure S1C). This was expected, as many of these genes, such as DEAD box helicases and zinc finger proteins, are involved in transcription regulation. Furthermore, HDA genes showed enrichment for cell adhesion and extracellular matrix genes such as fibronectin and collagen, which also makes sense because of enhanced cell-cell contacts.
We then decided to inspect top LDA and HDA genes in terms of their expression fold change over the density gradient. We chose LDA genes Myc (a proto-oncogene important for pluripotent stem cell gene regulation) and Mat2a (methionine adenosyltransferase) as well as HDA genes Ndufa4l2 (NADH dehydrogenase subunit) and S100a1 (calcium-binding protein), graphing the TPM of each gene vs. seeding density (Figure 1C). Intriguingly, the expression of each gene changed most dramatically at low-moderate seeding densities, plateauing at the highest densities.
To independently validate our RNA-seq data, we selected a total of 13 LDA and 12 HDA genes representing various pathways for RT-qPCR. We established two density endpoints of 1.9×10⁵ cells/cm2 for HD and 2.3×10⁴ cells/cm2 for LD (Figure S1D). In addition, we selected a new reference gene, Tcp1, based on low variance across densities in RNA-seq data (Figure S1E) and in RT-qPCR samples at HD and LD (Figure S1F). Tcp1 is a member of the chaperonin-containing complex, and although it has roles in liver cancer (Yao et al., 2019), its expression is relatively constant in mESCs compared to Actb (Figure S1G). RT-qPCR of 25 density-sensitive genes confirmed increased expression of LDA genes (Figure 1D) and decreased expression of HDA genes (Figure 1E) at LD. This was consistent not only in J1, but also in other mESC lines (Figure S1H).
Finally, to confirm protein level expression, we first verified that Gapdh protein expression was relatively consistent in HD and LD (Figure S1I). Western blots of both LDA (Myc, Mat2a, and Hsph1) and HDA (Ddit3, S100A1) proteins validated their relative abundance at HD vs. LD aligning with mRNA level expectations (Figure 1F). Thus, changing seeding density alone affects the expression of many genes at both the mRNA and protein level in mESCs.
ESC core factor expression is not significantly affected by seeding density during self-renewal
Because many genes were differentially expressed as a result of density, we decided to inspect the expression of stem cell core factors such as Oct4. Intriguingly, serial dilutions over an eightfold change in density did not affect the protein expression of ESC core factors Oct4, Nanog, or Sox2 (Figure 1G), consistent with our RNA-seq data (Figure S1J). This was surprising, as the expression of so many other genes had changed from density alone. Furthermore, the expression of a panel of 166 genes involved in stem cell maintenance (GO:0019827) did not vary significantly over a 16-fold change in seeding density according to RNA-seq (Figure 1H), whereas there was a significant change in the expression of genes involved in the extracellular matrix and helicase activity (Figure S1K, gene lists from GSEA). Thus, ESC core factor expression is relatively robust over a wide range of seeding densities, even though the expression of thousands of other genes is affected. We surmise this might be why delving into the molecular mechanisms of cell density has been largely ignored, as core factor expression is so commonly tested as a proxy for mESC identity.
Although Nanog seems relatively density-insensitive during self-renewal, once mESCs are committed to differentiation in -LIF, Nanog protein levels decrease more at LD compared to HD (Figure 1I). We also observe more rapid loss of protein expression of pluripotency-related factors Sall4 and Zfp281 (Luo et al., 2019; Pantier et al., 2021) at LD. Interestingly, Oct4, Sox2, and Klf5 were downregulated in a density-independent manner, and protein levels of E-cadherin and Zfp57 expression were maintained better in LD compared to HD. This suggests that cell seeding density may influence the downregulation of pluripotency factors during differentiation.
LD is more favorable for mESC differentiation than HD
To investigate whether mESCs undergo swifter dismantling of self-renewal and/or better acquisition of a differentiated state at LD, we turned to our -LIF RNA-seq samples. We saw that cells differentiating at HD remained relatively compact whereas cells differentiating at LD were able to stretch out, which is a morphological indicator of cell fate change (Figure S2A). After data processing (see STAR Methods), we found that 23% of moderately expressed genes (3,134 out of 13,693 genes) showed a 1.5 log2 variation in TPM across all seeding densities upon differentiation, and differentially regulated genes tended to be either repressed at low density (dHDA, differentiation high density active) or activated at low density (dLDA, differentiation low density active) (Figure 2A).
Figure 2.

Low seeding density enables efficient mESC differentiation
(A) Heatmap of RNA-seq performed on J1 mESCs seeded with serial dilutions starting at a concentration of 2.63 × 10⁵ cells/cm2 and ending at a concentration of 4.11 × 10³ cells/cm2 and grown in -LIF for 96 h. Transcripts per million (TPM) was calculated using kallisto and transcripts were consolidated into genes. After normalizing expression to the average (log2TPM+1 to avoid undefined results when TPM in any sample = 0, hereafter simply stated as log2), only genes showing a range of 1.5 log2 difference in TPM across samples are shown. Line graphs depict median gene expression ± interquartile range.
(B) Boxplots depicting expression of genes involved in naive and primed pluripotency as well as primary gene layer formation.
(C) Venn diagram showing overlap of dHDA, dLDA, and differentiation-induced or differentiation-down genes using top 1000 differentially expressed genes (based on TPM compared to control).
(D) Scatter plot of 13,797 transcripts depicting log2 TPM ratio of low vs. high density in -LIF (x-axis) and -LIF and +LIF (y-axis) showing a positive correlation between low density and successful induction of the -LIF transcriptional program. Only transcripts where at least one of their q-values (associated with either LD vs. HD or -LIF vs. +LIF) was below 0.05 were included. Color indicates the -log of the higher (worse) q-value.
(E) Western blot of proteins whose expression is impacted by seeding density after 72 h of differentiation in -LIF at HD or LD. For Gata3, FL = full length, SV = splice variant.
(F) RT-qPCR of lineage markers corresponding to trophectoderm, ectoderm, endoderm, and mesoderm. mESCs were differentiated in LIF HD or LD for 72 h or maintained at LD in +LIF for 48 h. Data were normalized using the 2–ΔΔCt method relative to Tcp1 expression and +LIF LD samples (log2). Error bars indicate standard deviations (n = 3 biological replicates for -LIF, 2 for +LIF).
(G and H) RT-qPCR of Class I, II, III, and IV density-sensitive genes after 72 h of differentiation in -LIF, either (G) LD normalized to HD or (H) -LIF relative to +LIF. Data were normalized using the 2–ΔΔCt method relative to Tcp1 expression and HD samples (log2). Error bars indicate standard deviations (n = 4 biological replicates for (G), and 3 for (H)). Significance stars indicate p values from two-tailed t tests of LD vs. HD (G) or -LIF LD vs. +LIF LD (H). ∗ is 0.05 > p value > 0.01. ∗∗ is 0.01 > p value > 0.001. ∗∗∗ is 0.001 ≥ p value.
To determine whether differentiation was preferable at LD or HD, we calculated pairwise correlations between all samples, finding moderate positive correlations between the two most confluent -LIF and several HD +LIF samples (Figure S2B). However, this approach lacked resolution as the whole transcriptome was used as input. We thus decided to examine expression for genes involved in naive and primed pluripotency (Zhang et al., 2016) as well as lineage commitment (GO:0001704, formation of primary germ layer). We found that while naive marker expression decreased regardless of density, primed pluripotency genes and developmental genes were induced during LD differentiation compared to HD (Figure 2B). This reveals that differentiation at LD rather than HD may be preferable, as primed and lineage markers were generally more highly expressed, whereas differentiation at HD seems to be suboptimal as expression of these genes in HD is more similar to +LIF.
We then performed differential gene expression analysis comparing the three lowest and three highest density samples in -LIF (Figure S2C, Table S3). We found that some of the highest upregulated transcripts at LD encode for developmental TFs, including Cdx2, T, Snai1, and others. In addition, some of the most significantly downregulated transcripts at LD are involved in reprogramming or pluripotency, such as Utf1 (Bao et al., 2017) and Klf2/4 (Jeon et al., 2016). According to GO analysis, dHDA genes were enriched for response to LIF, whereas dLDA genes were implicated in development and related signaling pathways (Figure S2D). GSEA showed profound enrichment of dLDA genes in primary germ layer formation as well as heart development (Figure S2E). These results clearly evince that high seeding density is associated with inefficient differentiation, and low seeding density augments the induction of development-related genes.
Next, we created a differentiation-induced gene set, using the RNA-seq data from the three lower seeding densities (excluding the lowest) from each culture condition (Figure S2F, Table S4). Out of the top 1,000 differentiation-induced genes, only 53 (5.3%) genes were also top dHDA genes; 350 (35%) overlapped with top dLDA genes (Figure 2C). Similarly, 269 (27%) of the top differentiation-down genes were also dHDA genes. In addition, we gathered all transcripts with q-value < 0.05 from either dLDA vs. dHDA or -LIF vs. +LIF, plotting TPM ratio values corresponding to -LIF LD vs. -LIF HD on the x-axis, -LIF vs. +LIF on the y-axis, and color-coding -log (q-value) from gray (insignificant) to red (significant). We found a moderate positive correlation (r = 0.51) between low density and successful differentiation (Figure 2D, Table S5).
Potent upregulation of lineage markers is a gold standard for efficient differentiation. Cells differentiating at LD exhibited strong protein expression of trophectoderm markers Gata3 and Cdx2 and mesendoderm marker T, whereas these factors are hardly detectable at HD (Figure 2E). Effectors of signaling pathways known to be active during differentiation, such as Lef1 and cleaved Notch, were also more abundant at LD. Surprisingly, although Otx2 is known to be involved in neural development, it was expressed more highly at HD. Next, RT-qPCR of a panel of markers from all three germ layers as well as the trophectoderm showed superior induction of Cdx2, Hand1, Krt8, neuroectoderm marker Nes, and mesoderm marker Twist at LD rather than HD (Figure 2F). Conversely, endoderm markers like Eomes were not particularly affected by density. We conjecture that the differentiation defect at HD in -LIF primarily affects mesoderm and trophectoderm markers.
Then, we asked whether cells differentiating in HD would eventually upregulate lineage markers; thus, we differentiated for 120 h and compared them to 72 h. Intriguingly, we found that a couple genes (namely, Gata3 and Twist1) were eventually induced even at HD, whereas the expression of most of the other genes tested (such as Alox15) stayed static or decreased (Figure S2G). dLDA gene expression also decreased somewhat in LD samples, likely because the cells were allowed to proliferate without being passaged and thus gained more intercellular contacts. Thus, initial seeding density can influence terminal cell fate even over longer timescales, though the effect weakens over time if cells are not split. Lastly, culturing mESCs in serum + LIF can promote a heterogeneous state prone to spontaneous differentiation compared to defined 2i media (Sim et al., 2017). We thus maintained mESCs in 2i media and then withdrew 2i to determine the effects of density in serum-free conditions. We observed that even in serum-free media, LD differentiation still promoted higher expression of most of the markers tested, though the difference between LD and HD was more subtle than for serum + LIF (Figure S2H). Thus, together, the data support our assertion that cell seeding density affects the expression of thousands of genes, and LD is favorable for differentiation primarily via enhanced, but biased lineage marker upregulation.
Distinct classes of genes arise after taking both seeding density and differentiation into account
Because both density and differentiation affect global gene expression, we sought to test whether the effects of each process could be separated. As we observed in Figure 2C, instead of merely categorizing genes as dLDA or dHDA (density), we additionally consider expression in -LIF vs. +LIF (differentiation) to establish four classes of density-sensitive genes. Genes can be subdivided as such: Class I (active in LD and -LIF), Class II (LD and +LIF), Class III (HD and -LIF), and Class IV (HD and +LIF). We used a TPM ratio cutoff of log2 0.75 for each comparison (thus, to be in Class I, a transcript must have log2TPM LD/HD > 0.75 and log2TPM -LIF/+LIF > 0.75).
Class I and IV are the most numerous, comprising 1,232/2,033 = 61% and 622/2,033 = 31% of transcripts assigned to any class (out of 13,797 total transcripts), respectively. As examples, Class I genes Gata3 and T were strongly induced at LD but not HD during differentiation compared to +LIF (Figure S2I). Class II gene Gbx2 is a brain morphogenesis factor also involved in pluripotency (Wang et al., 2017b) and is downregulated in -LIF, but its expression is highest in LD. Class III gene Otx2 is an ectoderm marker that is upregulated in -LIF as expected but it was most active at HD. Finally, Class IV gene Ndufa4l2 was more highly expressed in +LIF at most densities and its expression was highest in HD. Next, we independently validated 17 genes belonging to the four classes with RT-qPCR (Figures 2G and 2H), showing fold changes consistent with RNA-seq data. In sum, the effects of differentiation and seeding density can be separated, though most genes are best expressed at either LD and during differentiation or at HD and during self-renewal.
β-catenin is critical for the expression of Class I genes during differentiation at LD
Because Class I genes were both the most numerous and had the most dramatic changes in expression, we sought to elucidate how Class I genes are upregulated at LD. Using the top 500 dLDA genes, we performed motif analysis (10 kb ± transcription start site; TSS) and uncovered significant enrichment of the Tcf3 motif among others (Figure S3A). The Tcf/Lef factors regulate fate specification, often in partnership with β-catenin (Sun et al., 2017; Liang and Liu 2018). Encoded by the Ctnnb1 gene, β-catenin is a transcriptional coregulator from the Wnt signaling pathway (Turner et al., 2014). Although its regulation by cell density has been shown in other contexts like cancer (Kim et al., 2019), it is unknown whether density and β-catenin are linked during mESC differentiation. Therefore, we hypothesized that β-catenin activates Class I genes downstream of cell density. To address this, we electroporated a Wnt reporter (H2B-GFP under the control of 6x Tcf/Lef motif (Ferrer-Vaquer et al., 2010)) into mESCs. We differentiated these reporter cells at either HD or LD and compared them to self-renewal. Wnt transcriptional activity was lowest during self-renewal at HD, increasing slightly at LD and substantially during HD differentiation, but Wnt activity was maximal when cells were differentiated at LD (Figures 3A and 3B). This result indicates that canonical Wnt is relatively inactive in self-renewing mESCs unless they differentiate under sparse conditions.
Figure 3.

β-catenin regulates Class I and III genes during mESC differentiation downstream of seeding density
(A) Representative confocal images (63× oil objective) of Tcf/Lef reporter mESCs cultured in either self-renewing (left, middle left) or differentiating (middle right, right) conditions at the densities indicated. Green indicates H2B-GFP. Nuclei were counterstained with NucBlue (Hoechst 33,342). Scale bar: 40 μm.
(B) Quantification of fluorescent intensity of H2B-GFP in (A). Individual nuclei were traced and quantified in ImageJ. For +LIF at HD, n = 84 nuclei; for -LIF, n = 121 nuclei for HD and 77 for LD. Significance stars indicate p values from the Kruskal-Wallis test for difference among all samples as well as the t test with Bonferroni-corrected p values between samples. ∗ is 0.05 > p value > 0.01. ∗∗ is 0.01 > p value > 0.001. ∗∗∗ is 0.001 ≥ p value.
(C) Representative confocal images (63× oil objective) of immunocytochemistry of mESCs grown in +LIF at HD or -LIF at HD or LD. Green represents β-catenin, blue represents the nucleus. White box represents the zoom in area. Scale bar: 40 μm.
(D) Boxplots showing weighted colocalization coefficients between nuclei and β-catenin in mESCs for several fields of view quantified using ZEISS ZEN. n = 5 for +LIF, 11 for -LIF LD, and 12 for -LIF LD. Significance stars indicate p values from the Kruskal-Wallis test for difference among all samples as well as the t test with Bonferroni-corrected p values between samples. ∗ is 0.05 > p value > 0.01. ∗∗ is 0.01 > p value > 0.001. ∗∗∗ is 0.001 ≥ p value.
(E) RT-qPCR of Classes I-IV density-sensitive genes after 72 h differentiation in -LIF at high or low density upon KD of β-catenin (Ctnnb1) or control KD. All samples were normalized using the 2–ΔΔCt method relative to Tcp1 expression and HD shCon (log2). Error bars indicate standard deviations (n = 2 biological replicates). Red text indicates presence of the Tcf7l1 motif ±10 kb of the TSS, determined using TFmotifView (http://bardet.u-strasbg.fr/tfmotifview/). Significance stars indicate p values from two-tailed t test of KD vs. shCon. ∗ is 0.05 > p value > 0.01. ∗∗ is 0.01 > p value > 0.001. ∗∗∗ is 0.001 ≥ p value.
(F) RT-qPCR of Class I-IV density-sensitive genes after 72 h differentiation in -LIF at high or low density upon 48 h dox-induced OE at 125 or 500 ng/mL of 4A β-catenin or no induction. All samples were normalized to no induction at HD (log2). Error bars indicate standard deviations (n = 2 biological replicates). Red text indicates presence of the Tcf7l1 motif ±10 kb of the TSS, determined using TFmotifView (http://bardet.u-strasbg.fr/tfmotifview/).
We then asked why Tcf/Lef activity increased at LD. It is known that β-catenin is regulated by nucleocytoplasmic shuttling, and some of these factors may be regulated by cell-cell contact (Shang et al., 2017). Indeed, we observed an upregulation of known β-catenin nuclear import and retention factors upon differentiation via RT-qPCR and this was enhanced at LD (Figure S3B). Therefore, we hypothesized that differentiating mESCs would have increased nuclear β-catenin at LD as opposed to HD. Indeed, we found that β-catenin nuclear staining was stronger in -LIF at LD under low cell-cell contact compared to HD (Figures 3C and 3D). Meanwhile, in mESCs cultured at HD regardless of culture condition, bright β-catenin staining was found at sites of intercellular contact.
It is known that E-cadherin forms a complex with β-catenin at adherens junctions (Adhikari et al., 2018). Indeed, immunocytochemistry of E-cadherin showed prominent membrane staining at HD, and this was reduced at LD (Figure S3C). Reduced membrane-associated E-cadherin at LD may allow for β-catenin nuclear import, which has been shown previously in cancer (Kourtidis et al., 2017). Consequently, we suspect that increased Wnt activity at LD during spontaneous differentiation originates from increased nuclear localization of β-catenin when cell-cell contact is low.
If β-catenin does induce Class I genes at LD, then depletion of β-catenin at LD must downregulate such genes. Indeed, shRNA-mediated knockdown (KD) of β-catenin at LD starkly downregulated Class I genes Alox15, Evx1, Sp5, and T compared to control shRNA (shCon) (Figures 3E and S3D). Other classes were not noticeably affected, although Class III genes Fgf5, Otx2, and Car4 were slightly upregulated. This is not surprising, as Otx2 is an ectodermal marker and β-catenin is known to inhibit ectodermal specification in mESCs (Theka et al., 2019).
Conversely, we hypothesized that β-catenin gain-of-function might increase Class I gene expression at HD. For this, because we suspected that excess β-catenin might be degraded or sequestered at HD (Faux et al., 2010), we used doxycycline (dox)-inducible overexpression (OE) of non-degradable β-catenin (S33A, S37A, T41A, S45A: referred to as β-catenin 4A) (Qu et al., 2016) (Figure S3E). As expected, OE of β-catenin 4A at HD drastically upregulated Class I genes and even mildly repressed Class III genes (Figure 3F). For further validation, we used small molecules CHIR99021 (CHIR) and LY2090314 (LY), GSK3 inhibitors which increase β-catenin protein levels, and IWR-1, a tankyrase inhibitor that decreases β-catenin protein levels (Kim et al., 2013; Tu et al., 2017). As predicted, GSK3 inhibition in mESCs differentiating at HD activated most Class I genes tested compared to control, whereas tankyrase inhibition in mESCs differentiating at LD repressed these genes (Figure S3F). Although effects of the GSK3 inhibitors differed somewhat, this is consistent with prior research showing that LY is more potent than CHIR (Zhang et al., 2021).
Finally, we conjectured that reduction in membrane-associated E-cadherin during HD differentiation would allow for upregulation of Class I genes at HD. E-cadherin is crucial for mESC pluripotency; thus, instead of targeting it directly, we decided to perform KD of Ctnnd1 (p120-catenin) (Figure S3G), a known member of the E-cadherin-β-catenin complex which stabilizes E-cadherin localization at the membrane (Pieters et al., 2016). As expected, KD of p120-catenin reduced E-cadherin membrane staining at sites of cell-cell contact at HD (Figure S3H). Crucially, KD of this factor partially rescues the induction of some Class I genes during HD differentiation, though not as effectively as GSK3 inhibition, showing that E-cadherin's association with β-catenin at the membrane is inhibitory but not the only layer of regulation at HD (Figure S3I). Thus, β-catenin is critical for the induction of Class I genes during -LIF differentiation at LD and its overactivation is sufficient to activate Class I genes even at HD.
Tcf7l1 regulates Class I genes during mESC differentiation
As a transcriptional coregulator, β-catenin typically works in tandem with the Tcf/Lef factors. Four Tcf/Lef factors exist: Lef1, Tcf7l1 (formerly known as Tcf3, encoded by the Tcf7l1 gene), Tcf7 (encoded by Tcf7 but also known as Tcf1), and Tcf4 (Tcf7l2) (Hrckulak et al., 2016). Although these factors are redundant to some degree, it was previously shown that after quadruple knockout, restoration of a single factor restored cell fate specification in mESCs (Moreira et al., 2017). If a single Tcf/Lef factor was critical for β-catenin function during LD differentiation, KD of that factor would reduce Class I gene expression. Thus, we performed KD of Lef1, Tcf7l1, and Tcf7, along with β-catenin KD as a positive control (Figure S4A), and then did RT-qPCR of our density-sensitive gene set followed by clustering.
Intriguingly, Tcf7l1 KD downregulated not only Class I genes activated by β-catenin, such as Evx1, but also genes whose expression was not strongly affected by β-catenin KD, such as Gata3 and Egr1 (Figure 4A). This implies that Tcf7l1 KD may have a broader effect than β-catenin KD. Because no substantial decrease in Class I gene expression was observed in Tcf7 KD and Lef1 KD samples (Figure 4A), we concluded that Tcf7l1 rather than Tcf7 or Lef1 seems to regulate density-sensitive genes during differentiation, even though all three were slightly upregulated upon differentiation (Figure S4B). This was unexpected as Tcf7l1 is primarily known as a repressor in self-renewing mESCs, where its interaction with β-catenin leads to its degradation (Shy et al., 2013). In differentiated cells, it has been shown that Tcf7l1 can act in concert with β-catenin to collaboratively activate gene expression (Yuan et al., 2019) or even do so independently of β-catenin (Liang and Liu 2018). Our results indicate that β-catenin collaborates with Tcf7l1 for regulation of at least some Class I genes during mESC spontaneous differentiation.
Figure 4.

Tcf7l1 and Esrrb regulate density-sensitive genes during differentiation
(A) Heatmap of RT-qPCR of Class I-IV density-sensitive genes after 72 h differentiation in -LIF at high or low density upon KD of β-catenin, Tcf3 (Tcf7l1), Tcf7, or Lef1. All samples were normalized using the 2–ΔΔCt method relative to Tcp1 expression and HD shCon (log2). LD shCon is an average of n = 3 biological replicates.
(B) RT-qPCR of Class I and III density-sensitive genes after 72 h differentiation in -LIF at high density, low density, or high density upon dox-induced OE of Tcf7l1 (250 ng/mL dox) with or without 48 h treatment with 2.5 μM IWR-1, a β-catenin inhibitor. All samples were normalized to no induction at HD (log2). Error bars indicate standard deviations (n = 2 biological replicates).
(C) RT-qPCR of Classes I-IV density-sensitive genes after 72 h differentiation in -LIF at high or low density upon dox-induced OE of Esrrb (500 ng/mL dox for 48 h). All samples were normalized to no induction at HD (log2). Error bars indicate standard deviations (n = 2 biological replicates). Red text indicates presence of the Esrrb motif ±10 kb of the TSS, determined using TFmotifView (http://bardet.u-strasbg.fr/tfmotifview/).
(D) RT-qPCR of Classes I-IV density-sensitive genes after 72 h differentiation in -LIF at high or low density upon KD of Esrrb or control KD. All samples were normalized to HD shCon (log2). Error bars indicate standard deviations (n = 2 biological replicates).
(E) Representative confocal images (63× oil objective) of Tcf/Lef reporter mESCs after differentiation (-LIF, 72 h) upon either KD of Esrrb or control KD. Green indicates H2B-GFP. Nuclei were counterstained with NucBlue (Hoechst 33,342). Scale bar: 40 μm.
(F) Quantification of fluorescent intensity of H2B-GFP in (E). For HD: shCon, n = 179 nuclei; KD1, n = 108 nuclei; KD2, n = 118 nuclei. For LD: shCon, n = 58 nuclei; KD1, n = 41 nuclei; KD2, n = 26 nuclei. Significance stars indicate p values from the ANOVA test for difference among all samples as well as the t test with Bonferroni-corrected p values between samples. ∗ is 0.05 > p value > 0.01. ∗∗ is 0.01 > p value > 0.001. ∗∗∗ is 0.001 ≥ p value.
Consequently, we performed inducible OE of Tcf7l1 at HD (Figure S4C) and observed partial rescue of Gata3, T, and Evx1 expression that was abolished upon IWR-1 treatment, indicating that β-catenin may be essential for Tcf7l1-mediated activation of these genes (Figure 4B). Unexpectedly, Tcf7l1 OE-mediated activation of Peg3 and repression of Fgf5 were not visibly affected by IWR-1, suggesting that β-catenin is not universally required for Tcf7l1 to modulate all its targets during mESC differentiation.
Esrrb opposes Tcf7l1 and β-catenin in the upregulation of Class I genes
Given that Tcf7l1 and β-catenin seem to both activate Class I genes, we sought to identify a regulator of density-sensitive genes that had a different or opposing role. We performed motif analysis of the top 500 dHDA genes, finding enrichment of the Klf15, Esrra, and Bach1 motifs (Figure S4D). Esrra has an extremely similar DNA-binding domain to Esrrb (Festuccia et al., 2018), a known ESC core factor directly repressed by Tcf7l1 in self-renewing ESCs (Martello et al., 2012; Xu et al., 2018). In addition, Esrrb is a direct target of Nanog, capable of substituting for its function after Nanog deletion (Festuccia et al., 2012; Zhang et al., 2018). Additionally, we found that although Esrrb mRNA levels decreased sharply upon LIF withdrawal, they decreased more at LD compared to HD, even more than the mRNA levels of Nanog, its upstream regulator (Figure S4E). This implies that regulation of Esrrb may be linked to seeding density. However, it remains relatively unknown what roles Esrrb plays during differentiation. Therefore, we thought that Esrrb might either repress Class I genes or activate Class IV genes to antagonize differentiation at LD.
To test this, we performed OE of Esrrb at LD during mESC differentiation. Surprisingly, we found that ectopic expression of Esrrb at LD suppressed the induction of Class I β-catenin target genes, particularly T and Sp5 (Figures 4C and S4F). This may be indirect, as the Esrrb motif was not highly enriched around the TSS of dLDA genes (Figure S3A). Ripply1, a Class IV gene, was activated at LD after Esrrb OE as predicted. This is logical, as the Ripply1 promoter does contain the Esrrb binding motif (AAGGTC).
Because the OE approach does not address the roles of endogenous Esrrb, we performed KD of Esrrb (Figure S4G). As expected, Esrrb KD enabled high induction of Class I genes even during HD differentiation, reminiscent of β-catenin OE (Figure 4D). Ripply1 expression was lower after KD, consistent with OE data. Furthermore, KD of Esrrb in Wnt reporter mESCs significantly increased Tcf/Lef activity during HD differentiation (Figures 4E and 4F). Collectively, these data suggest that Esrrb curbs mESC differentiation, opposing Tcf7l1 and β-catenin by repressing Class I genes and activating at least one Class IV gene.
Dissection of a density-regulatory network involving β-catenin, Tcf7l1, and Esrrb
To test density-dependent roles of β-catenin, Tcf7l1, and Esrrb on a wider scale, we performed RNA-seq after perturbation of these factors in differentiating mESCs at HD and LD. First, we tested whether our density-sensitive gene set (Classes I-IV) behaved as expected in this second round of RNA-seq, and most of them showed a similar fold change in LD vs. HD as our prior RT-qPCR panels (Figure S5A). Next, because we used two seeding density endpoints in the new RNA-seq datasets rather than a gradient, we created new sets of Class I and IV genes using several of the LD and HD shCon controls (all -LIF, TPMavg LD/HD) as well as three of the lower cell density samples in +LIF from Figure 1. Class I genes were defined as having log2 TPM ratio > 0.5 in both LD vs. HD and -LIF vs. +LIF, whereas Class IV genes were defined as log2 TPM ratio < -0.5 in LD vs. HD and -LIF vs. +LIF (Table S6). We relaxed this threshold because we harvested these cells at an earlier time point (72 h, not 96 h) compared to our prior RNA-seq (Figure 1).
Concordant with our expectations, overall Class I gene expression was elevated in the LD control, but was decreased upon KD of β-catenin or Tcf7l1, or OE of Esrrb, though Tcf7l1 KD and Esrrb OE had the most significant effect, and β-catenin KD was a milder perturbation in comparison (Figure 5A and S5B). KD of Esrrb at LD increased Class I gene expression beyond LD control. Furthermore, PCA showed that Tcf7l1 KD, β-catenin KD, or Esrrb OE shifts gene expression toward a more HD-like state (Figure 5B). Thus, these factors do not only regulate the genes in our small set tested via RT-qPCR, but also regulate hundreds of Class I genes and are partially responsible for the LD-specific transcriptomic program.
Figure 5.

Transcriptomic analysis of the roles of β-catenin, Esrrb, and Tcf7l1 in regulating Class I and IV genes
(A) Heatmap of Class I gene expression after RNA-seq was performed on mESCs differentiating in -LIF for 72 h at LD upon indicated perturbation of β-catenin, Tcf7l1, or Esrrb. shRNA controls, both LD (left) and HD (right), are depicted outlined in black boxes. Each sample was normalized to its respective LD control (for example, Esrrb OE is +dox vs. -dox, both at LD).
(B) Principal component analysis (PCA) of RNA-seq samples shown in (A).
(C) Venn diagram showing overlap of the top 200 downregulated (by fold change, compared to shCon) Class I genes upon KD of the indicated factors.
(D) Heatmap of Class I gene expression after RNA-seq was performed on mESCs differentiating in -LIF for 72 h at LD upon indicated perturbation of β-catenin or Esrrb. shRNA controls, both LD (left) and HD (right), are outlined in black boxes. Each sample was normalized to its respective LD control.
(E) Boxplot of Class I gene expression (log2 TPM, n = 951 genes) upon perturbation of β-catenin or Esrrb at HD. Significance stars indicate p values from the one-way ANOVA test for difference among all samples as well as the t test with Bonferroni-corrected p values between samples. ∗ is 0.05 > p value > 0.01. ∗∗ is 0.01 > p value > 0.001. ∗∗∗ is 0.001 ≥ p value.
(F) PCA of RNA-seq samples shown in (D) using the same gene set.
(G) Heatmap of Class IV gene expression after RNA-seq was performed on mESCs in -LIF for 72 h at LD upon indicated perturbation of Esrrb. shRNA controls, both LD (left) and HD (right), are depicted outlined in black boxes. Each sample was normalized to its respective LD control (for example, Esrrb is +dox vs. -dox, either at LD or HD). shRNA controls, both LD (left) and HD (right), are depicted outlined in black boxes. Each sample was normalized to its respective LD control (for example, Esrrb is +dox vs. -dox, either at LD or HD).
(H) Boxplot of Class IV gene expression (log2 TPM, n = 642 genes) upon perturbation of Esrrb at LD or HD. Significance stars indicate p values from the one-way ANOVA test for difference among all samples as well as the t test with Bonferroni-corrected p values between samples. ∗ is 0.05 > p value > 0.01. ∗∗ is 0.01 > p value > 0.001. ∗∗∗ is 0.001 ≥ p value.
(I) PCA of RNA-seq samples shown in (G) using the same gene set.
(J) Stacked bar charts depicting the number of downregulated (left) and upregulated (right) genes upon each perturbation. Threshold was set at 1 log2 difference compared to control. Proportion of dysregulated genes belonging to Class I, II, III, IV, or none of the above is indicated by color.
Fascinatingly, our heatmap implies somewhat different patterns of expression for Class I genes upon KD of Tcf7l1 and β-catenin, indicating that they may be working both collaboratively and separately to regulate various subsets of Class I genes. Indeed, among the top 200 downregulated genes upon β-catenin KD, Tcf7l1 KD, and Esrrb OE, there was a substantial overlap in the genes whose expression decreased in each perturbation (Figure 5C). In particular, there was a 53% overlap between Tcf7l1 KD and Esrrb OE, which was logical given that Tcf7l1 is known to repress Esrrb. We validated some of the top shared regulated genes using RT-qPCR, showing that either Tcf7l1 KD or Esrrb OE at LD could downregulate Class I lineage markers like Trim67, Wnt3, and Nefm (Figure S5C).
We then asked whether this relationship was valid for the overall transcriptome rather than merely Class I genes. Determining pairwise correlations between RNA-seq samples using ∼13k expressed genes showed positive correlations between Tcf7l1 KD and Esrrb OE during mESC differentiation, whereas global gene expression for β-catenin KD samples was more similar to the LD control, as the effect of β-catenin KD was more subtle (Figure S5D). Furthermore, there were several top upregulated genes shared by Tcf7l1 KD and Esrrb OE, including stemness-related transcripts Zfp42 and Nr0b1 (Figures S5E and S5F, Table S7).
β-catenin OE or Esrrb KD allow efficient differentiation even at HD
Given that KD of β-catenin or OE of Esrrb at LD could shift global Class I gene expression toward a more HD-like profile, we hypothesized that OE of β-catenin 4A or KD of Esrrb at HD would shift it toward a more LD-like state. Indeed, our heatmap shows a substantial induction of Class I genes during HD differentiation upon either perturbation (Figures 5D and 5E), and we validated several top upregulated Class I genes via RT-qPCR, including intestinal/trophectoderm marker Cdx2 and primitive streak marker Mixl1 (Figure S5G). In addition, PCA shows a pronounced shift of the β-catenin 4A OE or Esrrb KD samples from the HD to the LD side of the graph (Figure 5F). Differential gene expression analysis showed that Esrrb KD or β-catenin 4A OE at HD potently upregulated T and downregulated stemness genes like Utf1 or Class III genes like Car4, respectively (Figures S5H and S5I, Table S7), and GSEA demonstrated that genes activated by either perturbation tend to be involved in embryonic development (Figure S5J).
Next, we investigated Class IV gene expression via RNA-seq upon Esrrb perturbation. Despite Esrra motif enrichment, we have only observed Ripply1 expression being changed upon OE or KD of Esrrb in Figure 4. However, after surveying 640 Class IV genes, we find that OE of Esrrb at LD upregulated more than half of Class IV genes, whereas KD of Esrrb at HD visibly downregulated most of them compared to control (Figures 5G and 5H). We validated several Class IV genes – Mymx, Atp1a3, and known stemness factor Fgf4 – that match this pattern of dysregulation (Figure S5K). PCA shows a clear shift of LD Esrrb OE samples from LD controls toward HD controls, whereas KD Esrrb samples at either density move to the opposite side of the x-axis (Figure 5I). Thus, Esrrb sustains the expression of many Class IV genes during -LIF differentiation at HD and may contribute to inefficient differentiation when cells are too confluent, whereas constitutive activation of β-catenin allows cells to differentiate even at HD.
Finally, we surmised that each perturbation would have pleiotropic effects that are not limited to their regulation of density-sensitive genes. To separate these phenomena, we compiled a list of all dysregulated genes (1 log2 up or downregulated in KD or OE compared to control) and determined the proportion of each class of genes within each perturbation. We found that ∼40–50% of downregulated genes and ∼30–40% of upregulated genes for each KD or OE were actually density-sensitive genes belonging to one of the classes (Figure 5J). The distribution of genes belonging to each class matches our prior analyses. For example, ∼30–40% of β-catenin KD, Tcf7l1 KD, and Essrb OE downregulated genes overall were Class I. Thus, although each perturbation did have pleiotropic effects, a sizable percentage of dysregulated genes upon each perturbation were in fact density-related.
β-catenin co-occupies target loci with Tcf7l1 and Esrrb in a density-sensitive manner
After showing that perturbation of β-catenin, Tcf7l1, and Esrrb alters the expression of density-sensitive genes during mESC spontaneous differentiation, we sought to determine whether cell density affects protein-DNA or protein-protein interactions for these three factors. We used a Sleeping Beauty-based system that allows for random integration of a tagged version of a protein (here, FLAG-Bio tag in BirA-expressing mESCs) and tunable, inducible expression using dox. First, we tested a range of dox concentrations so that we could obtain close to endogenous expression of the tagged protein (Figure S6A and S6C) and performed bioChIP-seq (Kim et al., 2008) of each factor during differentiation at HD and LD. As comparisons, we used publicly available binding data from self-renewing mESCs for each factor (Marson et al., 2008; Zhang et al., 2013; Chronis et al., 2017).
We then performed pairwise correlation to determine the similarity of all samples using the peak scores of all genes bound by at least one factor. Intriguingly, β-catenin LD samples clustered with Tcf7l1 HD/LD samples rather than with β-catenin HD, implying that β-catenin at LD occupies many common target loci with Tcf7l1 (Figure 6A). Indeed, almost all β-catenin-bound genes at LD were also bound by Tcf7l1 (Figure 6B). Supporting these data, the Lef1 motif was significantly enriched in β-catenin peaks during LD but not HD differentiation (Figures S6D and S6F). Interestingly, even in Tcf7l1 peaks, we observed a subtle increase in Lef1 motif usage as well as other differentiation-related motifs (Figure S6G). We also saw dynamic shifts in preference for promoter vs. distal regulatory element binding for both β-catenin and Tcf7l1, showing that both differentiation and cell density could affect peak position (Figures S6H and S6I). We surmise that this may be because of density-dependent chromatin remodeling, as it is known that the opening of chromatin during human ESC differentiation allows for β-catenin to bind to mesoderm markers (Wang et al., 2017a). Finally, β-catenin peaks at LD, but not at HD, shared a few GO terms with Tcf7l1 (mesoderm development) and Esrrb (trophectodermal cell differentiation, blastocyst formation), although most GO terms were not shared (Figure S6J). Thus, density profoundly impacts motif usage and co-occupancy for β-catenin in differentiating mESCs.
Figure 6.

Genomic occupancy of β-catenin, Esrrb, and Tcf7l1 during differentiation at low and high density
(A) Correlogram of mESC ChIP-seq data after 72 h differentiation at LD. Genes that were not bound by any factor were filtered out, and the peak score calculated by Homer after peaks were called with MACS2 was used as input (q-value cutoff of peaks = 0.05). Color of the circles is relative to both sign and magnitude of Spearman correlation (blue for negative correlation, dark red for positive) whereas size is proportional to the absolute value of the coefficients.
(B) Venn diagram showing overlap of genes bound by β-catenin at LD, Tcf7l1 at HD, or Tcf7l1 at LD, all in -LIF.
(C) Integration of RNA-seq data (heatmap, left) and ChIP-seq data (line graph, right) comparing changes in expression upon β-catenin KD to peak score of β-catenin, both at LD. For the heatmap, yellow indicates upregulation upon KD whereas blue indicates downregulation. For the line graph, the line represents a moving window average of 150 genes.
(D) Violin plots showing TPM of top β-catenin-occupied genes in +LIF (blue), -LIF at HD (purple), and -LIF at LD (yellow) using RNA-seq data. Top 750 genes were first taken as input, and then any genes that were not expressed in any sample were removed, leaving 545 genes.
(E and F) Signal tracks of Class I (E) and Class IV (F) genes comparing occupancy of β-catenin, Tcf7l1, and Esrrb (or exclusively Esrrb for Class IV) during self-renewal (blue), HD -LIF (purple), and LD -LIF (pink).
(G) Peak-centric heatmaps showing tag density in β-catenin, Tcf7l1, and Esrrb ChIP-seq at HD and LD ± 1.5 kb of β-catenin LD peak centers. Scale bar indicates signal pileup after MACS2 peak calling.
(H) Integration of RNA-seq data (heatmap, left) and ChIP-seq data (line graph, right) comparing changes in expression of Class I genes upon Esrrb KD to peak score of β-catenin, both at HD. Line represents a moving window average of 50 genes.
(I) Integration of RNA-seq data (heatmap, left) and ChIP-seq data (line graph, right) comparing changes in expression of Class IV genes upon Esrrb KD to peak score of β-catenin, both at HD. Line represents a moving window average of 35 genes.
(J) Western blot after co-IP of biotinylated Tcf7l1 after differentiation (72 h) and dox treatment (48 h) at HD or LD. Input (0.2% of total protein extract) and dox untreated cells are provided as controls. FB = FLAG-Biotinylated.
(K) Western blot after co-IP of biotinylated β-catenin after differentiation (72 h) and dox treatment (48 h) at HD or LD. Input (0.2% of total protein extract) and dox untreated cells are provided as controls. FB = FLAG-Biotinylated.
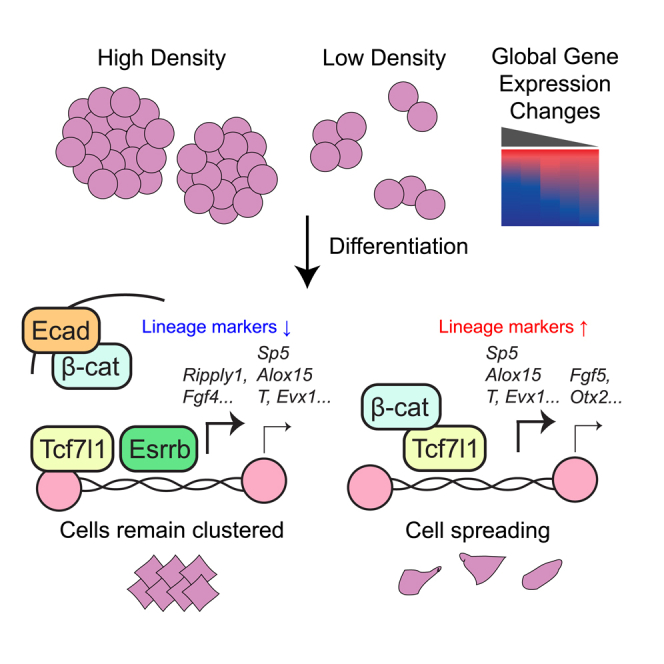
(L) Model showing factors implicated density-sensitive gene regulation during mESC differentiation.
Given that our data in Figures 3E and 5A implicate β-catenin in activation of low density-specific genes during differentiation, we then asked whether β-catenin functions as a direct activator. Indeed, after integrating our RNA-seq data, we found that β-catenin peak score is highest among genes that are downregulated upon β-catenin KD (Figure 6C). Furthermore, the top β-catenin-bound genes with the highest peak score are significantly upregulated during LD (but not HD) differentiation relative to their expression in self-renewing mESCs (Figure 6D). We thus decided to inspect the signal tracks of specific Class I genes. We uncovered that the cis-regulatory elements of Sp5, Evx1, and Alox15 are indeed occupied by β-catenin during LD differentiation, but not at HD or during self-renewal (Figure 6E). Fascinatingly, Tcf7l1 seems to co-occupy the same regulatory elements during differentiation, but strong binding is maintained regardless of seeding density. Thus, differentiation is both necessary and sufficient for Tcf7l1 occupancy on such genes, but β-catenin occupancy requires both differentiation and low seeding density.
Intriguingly, Esrrb binds these Class I loci as well, although its peaks are strongest during self-renewal and weaken substantially over differentiation, particularly at LD (Figure 6E). Esrrb displays a similar pattern of binding on Class IV genes Ripply1, Dppa5a, and Mymx (Figure 6F). This agrees with not only Esrrb's known roles as a stem cell factor, but also with our prior results in Figure 5G that Esrrb OE at LD upregulates Class IV genes whereas Esrrb KD at HD downregulates them. Esrrb shows some changes in motif preference at LD, namely an increase in Sox3 motif usage, but most motifs including the canonical Esrrb motif remain relatively unchanged (Figures S6K and S6L).
After seeing that our three factors co-occupy some of the same putative cis-regulatory elements in Figure 6E, we hypothesized that Tcf7l1 and Esrrb co-occupy β-catenin LD peaks in a differentiation and/or seeding density-dependent manner. Indeed, consistent with signal tracks, β-catenin peaks at LD were also strikingly co-occupied by Tcf7l1 at either density in -LIF (Figure 6G). These loci were also occupied by Esrrb in +LIF, but the strength of co-occupancy decreased substantially during differentiation, especially at LD.
Fascinatingly, Tcf7l1 occupancy on β-catenin-co-bound loci seems slightly higher at LD, implying that the presence of β-catenin at LD may stabilize Tcf7l1 association with DNA. In fact, the overall score of Tcf7l1 peaks on β-catenin-bound genes is somewhat enhanced at LD compared to HD, although the difference is more subtle than for β-catenin or Esrrb binding (Figure S6M). Conversely, Esrrb occupancy on its target loci is highest during self-renewal and drops considerably during differentiation, particularly at LD (Figure S6N). Intriguingly, at HD, Esrrb appears to directly repress Class I genes and directly activate a subset of Class IV genes, supporting our prior data in Figures 4 and 5 (Figures 6H and 6I). We thus surmise that this decrease in Esrrb binding contributes to the induction of Class I genes and suppression of Class IV genes at LD. Taking all these data into account, we argue that seeding density influences global gene expression via elevated co-occupancy of β-catenin and Tcf7l1 as well as reduced co-occupancy of Esrrb at LD, leading to transcriptional activation of β-catenin targets.
Given these changes, we reasoned that density may affect protein-protein interactions for β-catenin and Tcf7l1. Thus, we performed co-immunoprecipitation (co-IP) at HD and LD during differentiation. As expected, Tcf7l1's physical association with β-catenin was amplified at LD compared to HD, and its association with Hdac1 was much weaker at LD, despite similar protein expression in OE samples (Figure 6J). Concordant with this observation, co-IP of β-catenin revealed stronger physical interaction with Tcf7l1 at LD and a decrease in interaction with adherens junction-related E-cadherin (Figure 6K). This agrees with our findings in Figure 3C showing increased nuclear and reduced membrane localization of β-catenin at LD compared to HD, and also matches our ChIP-seq data showing enhanced co-occupancy of these factors at LD. We have presented our combined model in Figure 6L. At HD, cells are crowded and cannot differentiate efficiently; this is partly because of β-catenin associating with E-cadherin at adherens junctions even though Tcf7l1 is already on DNA. At LD, β-catenin translocates to the nucleus and associates with Tcf7l1 whereas Esrrb binding to the DNA is reduced, and this allows for proper induction of Class I genes to allow for successful fate specification.
Discussion
Though it has been observed that cell density can influence many biological processes including differentiation, there have been few mechanistic studies identifying which genes affect cell fate decisions downstream of density. In this study, we have shown that changing seeding density alone results in the differential expression of 10–15% of all genes in mESCs. This has profound implications for not only researchers working with stem cells, but also likely impacts all researchers who use cell culture, as it is probable that most cell types experience some degree of density-sensitive gene regulation.
Though β-catenin is known to be instrumental for fate specification during embryogenesis, our study has elucidated additional mechanisms of β-catenin's roles in mESC differentiation. Of note, lineage markers were not uniformly upregulated at LD or during β-catenin OE. In particular, trophectoderm and mesoderm markers like Cdx2 and T were quite strongly affected, whereas some endoderm and neural markers like Eomes and Otx2 were either unaffected or favored at HD. This is consistent with prior literature showing that β-catenin transcriptionally represses early neural differentiation while activating markers for mesodermal differentiation in ESCs (Davidson et al., 2012; Hoffmeyer et al., 2017). Less is known about β-catenin's importance for trophectoderm development, but a few studies have implicated β-catenin in successful trophoblast invasion and healthy placentation (Fan et al., 2016; Liu et al., 2020b). As cell-cell contact may change dramatically depending on the germ layer and embryonic stage, we hypothesize that dynamic regulation of β-catenin (mechanical or otherwise) may ensure proper specification of multiple tissues.
It has been shown previously that β-catenin is regulated by cell density by localizing at the plasma membrane with E-cadherin during increased cell-cell contact (Kim et al., 2019). However, more focus has been placed on other mechanisms of β-catenin regulation, namely the β-catenin destruction complex (Mukherjee et al., 2018), post-translational modifications (Hoffmeyer et al., 2017), as well as nuclear import, retention, and export factors (Griffin et al., 2018). It would be intriguing to determine how these layers of modification interact with one another, e.g., whether nuclear import factors of β-catenin are more active at LD. Furthermore, it may be fruitful to compare β-catenin to other known mechanotransducers, including Hippo signaling effectors Yap1 and Taz, which are known to collaborate with β-catenin in other contexts (Deng et al., 2018).
Indeed, it still remains unknown why Myc, Mat2a, and other transcripts are upregulated at LD in mESCs. Density-dependent expression of Myc has been known for decades; despite being observed in multiple cell types, the mechanism behind this remains unknown (Lee et al., 1995; Kim et al., 2017). Myc is known to be regulated by miRNAs (Ding et al., 2018), and miRNA processing can be influenced by cell density (Mori et al., 2014); therefore, seeding density may impact the abundance of miRNAs that may post-transcriptionally regulate LDA or HDA genes. Furthermore, it is still unstudied whether epigenetic features like histone acetylation, DNA methylation, or chromatin openness are affected by cell seeding density.
It is surprising that during mESC self-renewal, the expression of ESC core factors Oct4, Sox2, and Nanog is relatively invariant across a wide range of cell densities. This contradicts findings in other cell types. For example, ESC core factor expression in cord blood stem cells is highest at HD (Demerdash et al., 2015), but LD is preferred for core factor expression in mesenchymal stem cells (Kim et al., 2017). Thus, the sensitivity of genes like Oct4 and Nanog to seeding density might be highly context dependent. The upregulation of Myc at LD may reflect the fact that Myc and ESC core factors operate relatively independent transcriptional modules in ESCs (Kim et al., 2010). Indeed, we would expect Myc module activity to be elevated, whereas core module activity may not change significantly in self-renewing ESCs.
Finally, LD does not universally augment differentiation efficiency across cell types. For example, prior studies have shown that HD is superior for hESC differentiation into the pancreatic endocrine fate (Gage et al., 2013). It would be intriguing to determine how density affects gene expression in vivo during embryogenesis, as it is known that low cell contact is critical for trophectoderm specification (Cao et al., 2015) although other lineages are less studied in this respect. We propose that single-cell RNA-seq of the developing embryo would allow integration of spatial information, and cell-cell contacts in the embryo could be correlated with the expression of density-sensitive genes in individual cells.
In sum, our study shows that the simple choice of seeding density influences the expression of thousands of genes in mESCs. We have also demonstrated that mESC spontaneous differentiation is most efficient at low seeding density where β-catenin nuclear accumulation is maximized, and that Tcf7l1 and Esrrb also directly regulate density-sensitive genes during spontaneous differentiation. Future research on deciphering other mechanisms of density-dependent gene regulation in stem cells and other contexts will improve not only biomedical applications of stem cells, but also the rigor and reproducibility of cell culture.
Limitations of the study
mESCs have been used extensively for studies of mammalian gene regulation and cell fate determination. The present study elucidates mechanisms by which cell seeding density, a variable that is frequently overlooked in experimental design, influences global gene expression and differentiation in mESCs. Although we identified several transcription factors involved in this process such as Tcf7l1, further studies will be required to determine how seeding density influences histone modifications, chromatin accessibility, and other facets of gene regulation. Furthermore, investigations using organoids or animal models are needed to clarify the relevance of cell density to gene expression and fate determination in vivo, particularly from a developmental standpoint.
STAR★Methods
Key resources table
| REAGENT or RESOURCE | SOURCE | IDENTIFIER |
|---|---|---|
| Antibodies | ||
| Hsph1 | R&D Systems | Cat#MAB4029-SP; RRID:AB_10570875 |
| CHOP/Ddit3 | Cell Signaling Technology (CST) | Cat#2895S;RRID:AB_2089254 |
| S100A1 | Novus Biologicals | Cat#NBP2-29403; RRID:AB_2800458 |
| Nanog | Bethyl Laboratories | Cat#A300-397A; RRID:AB_386108 |
| Oct4/Pou5f1 | SCBT | Cat#sc-9081; RRID:AB_2167703 |
| Gapdh | SCBT | Cat#sc-365062; RRID:AB_10847862 |
| Sox2 | SCBT | Cat#sc-17320; RRID:AB_2286684 |
| Sall4 | Abcam | Cat#ab29112; RRID:AB_777810 |
| Zfp281 | Abcam | Cat#ab101318; RRID:AB_11157929 |
| E-cadherin | BD Biosciences | Cat#610181; RRID:AB_397580 |
| Zfp57 | Abcam | Cat#ab45341; RRID:AB_946192 |
| Klf5 | EMD Millipore | Cat#07-1580; RRID:AB_1977308 |
| Myc | Abcam | Cat#ab51154; RRID:AB_869187 |
| α-Tubulin | SCBT | Cat#sc-5286; RRID:AB_628411 |
| β-actin | Abgent | Cat#AM1829B; RRID:AB_10664137 |
| Tcp1 | Thermo Fisher Scientific | Cat#MA3-026; RRID:AB_2303275 |
| Gata3 | SCBT | Cat#sc268; RRID:AB_2108591 |
| Cdx2 | Abcam | Cat#ab76541; RRID:AB_1523334 |
| T/Brachyury | R&D Systems | Cat#AF2085-SP; RRID:AB_2200235 |
| Otx2 | Genetex | Cat#GTX133210; RRID:AB_2886868 |
| Lef1 | CST | Cat#2230S; RRID:AB_823558 |
| Notch1 | SCBT | Cat#sc-376403; RRID:AB_11149738 |
| β-catenin | Invitrogen | Cat#13-8400; RRID:AB_138792 |
| Streptavidin-HRP | Cytiva | Cat#GERPN1231-2ML |
| Tcf7l1 | Thermo Fisher Scientific | Cat#14519-1-A; RRID:AB_2287033 |
| Esrrb | Fisher Scientific | Cat#PPH670500; RRID:AB_567457 |
| Hdac1 | Abcam | Cat#ab7028; RRID:AB_305705 |
| Mat2a | Novus Biologicals | Cat#NB110-94158; RRID:AB_1237164 |
| HRP-conjugated Horse anti-mouse | CST | Cat#7076S; RRID:AB_330924 |
| HRP-conjugated Goat anti-rabbit | CST | Cat#7074S; RRID:AB_2099233 |
| HRP-conjugated Goat anti-rat | CST | Cat#7077S; RRID:AB_10694715 |
| HRP-conjugated Mouse anti-goat | Sigma-Aldrich | Cat#AP186P; RRID:AB_92616 |
| Goat anti-Mouse IgG (H+L) Highly Cross-Adsorbed Secondary Antibody, Alexa Fluor Plus 488 | Thermo Fisher Scientific | Cat#A32723; RRID:AB_2633275 |
| Bacterial and virus strains | ||
| E. coli HST08 | Takara Bio | Cat#636766 |
| Chemicals, peptides, and recombinant proteins | ||
| TGX FastCast Acrylamide | Bio-Rad | Cat#1610173 |
| Spectra™ Multicolor Broad Range Protein Ladder | Fisher Scientific | Cat#PI26634 |
| Ponceau S | VWR | Cat#K793-500ML |
| Lipofectamine™ 3000 Transfection Reagent | Thermo Fisher Scientific | Cat#L3000008 |
| ProLong™ Glass Antifade Mountant with NucBlue™ Stain | Thermo Fisher Scientific | Cat#P36981 |
| cOmplete™, Mini Protease Inhibitor Cocktail | Millipore Sigma | Cat#4693124001 |
| Dynabeads™ MyOne™ Streptavidin T1 | Invitrogen | Cat#65602 |
| CHIR-99021 (CT99021) HCl | Selleck Chemicals | Cat#S2924 |
| IWR-1 | Selleck Chemicals | Cat#S7086 |
| LY2090314 | Fisher Scientific | Cat#50-136-4365 |
| NDiff 227 | Takara Bio | Cat#Y40002 |
| DMEM, high glucose | Thermo Fisher Scientific | Cat#11965118 |
| 4x Laemmli Sample Buffer | Bio-Rad | Cat#1610747 |
| PD0325901 | Selleck Chemicals | Cat#S1036 |
| NheI HF | NEB | Cat#R3131S |
| NotI HF | NEB | Cat#R3189L |
| Critical commercial assays | ||
| RNeasy Plus Mini Kit | Qiagen | Cat#74136 |
| qScript cDNA SuperMix | VWR | Cat#101414-108 |
| PerfeCTa SYBR Green FastMix | VWR | Cat#95072-012 |
| ECL Prime Western Blotting Detection Reagent | Fisher Scientific | Cat#45-002-401 |
| ProtoScript II First Strand cDNA Synthesis Kit | New England Biolabs (NEB) | Cat#E6560S |
| NEBNext Ultra™ RNA Library Prep Kit for Illumina | NEB | Cat#E7770S |
| NEBNext Ultra™ II DNA Library Prep Kit | NEB | Cat#E7645S |
| NEXTflex® ChIP-Seq Barcodes - 24 | Bioo Scientific | Cat#NOVA-514122 |
| In-Fusion HD Cloning | Clontech | Cat#638917 |
| Deposited data | ||
| ChIP-seq, Esrrb (mouse ESCs) | Chronis et al., (2017) | GSE90893 |
| ChIP-seq, β-catenin (mouse ESCs) | Zhang et al., (2013) | GSE43565 |
| ChIP-seq, Tcf7l1 (mouse ESCs) | Marson et al., (2008) | GSE11724 |
| ChIP-seq, various (mouse ESCs) | This paper | GSE175801 |
| Experimental models: Cell lines | ||
| J1 Mouse Embryonic Stem Cells | ATCC | ATCC SCRC-1010 |
| CJ7 Mouse Embryonic Stem Cells | ENCODE | RRID:CVCL_C316 |
| ES-E14TG2a Mouse Embryonic Stem Cells | ATCC | ATCC CRL-1821 |
| HEK293T Human Embryonic Kidney Cells | ATCC | ATCC CRL-3216 |
| Recombinant DNA | ||
| Tcf/Lef:H2B-GFP | Addgene | Cat#32610 |
| pSBtet-GP | Addgene | Cat#60495 |
| pCMV(CAT)T7-SB100 | Addgene | Cat#34879 |
| E[beta]P | Addgene | Cat#24313 |
| MISSION® TRC2 pLKO.5-puro Non-Mammalian shRNA Control Plasmid DNA | Sigma-Aldrich | Cat#SHC202 |
| Software and algorithms | ||
| Primer3 | http://primer3.ut.ee/ | |
| HOMER | http://homer.ucsd.edu/homer/ | |
| SRA Toolkit | https://github.com/ncbi/sra-tools | |
| Bowtie 2 | http://bowtie-bio.sourceforge.net/bowtie2/index.shtml | |
| MACS2 | https://github.com/taoliu/MACS | |
| Integrated Genome Viewer | http://software.broadinstitute.org/software/igv/ | |
| ZEN Microscope Software | https://www.zeiss.com/microscopy/int/downloads/zen.html | |
| ImageJ | https://imagej.nih.gov/ij/index.html | |
| Kallisto | https://pachterlab.github.io/kallisto/ | |
| Sleuth | https://pachterlab.github.io/sleuth/ | |
| InteractiVenn | http://www.interactivenn.net/ | |
| GSEA | https://www.gsea-msigdb.org/gsea/index.jsp | |
| Cytoscape | https://cytoscape.org/ | |
| GREAT | http://great.stanford.edu/public/html/ | |
| Java TreeView | http://jtreeview.sourceforge.net/ | |
| BoxPlotR | http://shiny.chemgrid.org/boxplotr/ | |
| RStudio | https://www.rstudio.com/ | |
Resource availability
Lead contact
Further information and requests for resources and reagents should be directed to and will be fulfilled by the lead contact, Dr. Jonghwan Kim (jonghwankim@mail.utexas.edu).
Material availability
This study did not generate new unique reagents.
Experimental model and subject details
J1, CJ7, and E14TG2a (E14) male mESCs were cultured on tissue culture-treated plates coated in 0.1% gelatin with +LIF medium, which is composed of Dulbecco's Modified Eagle's Medium (DMEM, Gibco) supplemented with 18% fetal bovine serum (BioWest), EmbryoMax nucleosides (Millipore), MEM nonessential amino acids (Gibco), 100 μM β-mercaptoethanol, 50 U/mL penicillin/streptomycin/L-glutamine (PSG, Gibco), as well as 1000 U/mL recombinant mouse LIF (Millipore) in a 37°C incubator with 5% CO2. Cells were passaged every other day and media was changed daily. For cell culture experiments, cells were routinely seeded at 1.9×10⁵ cells/cm2 for high density (HD) and 2.3×10⁴ cells/cm2 for low density (LD). For differentiation, cells were passaged on d0 to transfer into -LIF medium (same as +LIF, except without LIF) and seeded on d1 at the appropriate densities (high or low). J1 and E14 mESCs and HEK293T cells were from ATCC, whereas CJ7 mESCs were obtained from Dr. Stuart Orkin. PCR did not detect mycoplasma contamination. For serum-free culture, mESCs were maintained in NDiff 227 (Takara Bio) supplemented with 1 μM PD0325901 (Selleck Chemicals), 3 μM CHIR99021 (Selleck Chemicals), and 1000 U/mL recombinant mouse LIF (2i media) and differentiated by withdrawal of LIF and both inhibitors.
Method details
Gene expression assay
For RT-qPCR, RNA was extracted from mESCs using the RNeasy Plus Mini Kit (Qiagen). Then, up to 1 μg of total RNA was reverse transcribed with the qScript cDNA SuperMix from QuantaBio (VWR). Afterward, qPCR was done in 20 μL reactions with PerfeCTa SYBR Green FastMix (VWR) mixed with 250 nM exon-spanning primers (designed using http://primer3.ut.ee/ and verified for absence of primer dimer formation using melt curve analysis, listed in Table S8) and 6 ng of cDNA. Relative expression was normalized to Tcp1 using the 2−ΔΔCT method. qPCR was done with 2–3 biological replicates in a StepOnePlus Real-Time PCR System (Applied Biosystems). T tests were performed using https://www.graphpad.com/quickcalcs/ttest1.cfm. Occurrence of specific motifs was determined using TFmotifView (http://bardet.u-strasbg.fr/tfmotifview/) (Leporcq et al., 2020).
Western blotting
To generate lysates for western blot, mESCs were first cultivated under appropriate conditions and administered treatments as specified. At a predetermined timepoint (generally 72 hr after LIF withdrawal and/or 48 hr after small molecule treatment), cells were quantified using a Countess Automated Cell Counter using 0.2% trypan blue. Next, cells were lysed using Laemmli Sample Buffer (Bio-Rad) supplemented with 5% β-mercaptoethanol (Millipore Sigma). Lysates were heated to 95°C for 7 mins and stored at −20°C. Up to 15 μL of lysate (normalized by viable cell count) was run on a 10% acrylamide gel (TGX FastCast Acrylamide kit, Bio-Rad) in denaturing conditions at 60-100 V for 70-180 min (depending on protein sizes). After sufficient separation was attained as evidenced by a Spectra Multicolor Broad Range protein ladder (Thermo Scientific), semi-dry transfer was performed using the Trans-Blot Turbo Transfer System (Bio-Rad) onto 0.2 μm PVDF membranes activated with methanol (Bio-Rad). Protein transfer was confirmed with Ponceau S staining (Amresco).
After blocking with 5% skim milk or 5% bovine serum albumin (BSA) in Tris-buffered saline containing 0.1% Tween 20 (TBST), membranes were incubated overnight at 4°C with primary antibodies, diluted in 1% BSA, 5% BSA, or 5% milk (depending on antibody) as described below. The next day, membranes were washed with TBST, incubated with HRP-conjugated secondary antibodies, washed again, incubated with ECL Prime Western Blotting Detection Reagent (Fisher Scientific), and visualized on a ChemiDoc XRS+ (Bio-Rad). Gapdh was used as a loading control.
Primary antibodies along with dilutions used were the following: Myc (Abcam #ab51154, 1:1000), Mat2a (Novus Biologicals #NB110-94158, 1:1000), Hsph1 (R&D Systems #MAB4029-SP, 1:1000), CHOP/Ddit3 (Cell Signaling Technology/CST #2895S, 1:1000), S100A1 (Novus Biologicals #NBP2-29403, 1:2000), Nanog (Bethyl Laboratories #A300-397A, 1:1000), Oct4/Pou5f1 (Santa Cruz Biotechnology/SCBT #sc-9081, 1:2000), Gapdh (SCBT #sc-365062, 1:1000), Sox2 (SCBT #sc-17320, 1:500), Sall4 (Abcam #ab29112, 1:1000), Zfp281 (Abcam #ab29050, 1:200), E-cadherin (BD Biosciences #610181, 1:1500), Zfp57 (Abcam #ab45341, 1:2000), Klf5 (EMD Millipore #07-1580, 1:500), α-Tubulin (SCBT #sc-5286, 1:1000), β-actin (Abgent #AM1829B, 1:20,000), Tcp1 (Thermo Fisher Scientific #MA3-026, 1:2000), Gata3 (SCBT #sc268, 1:5000), Cdx2 (Abcam #ab76541, 1:2500), T/Brachyury (R&D Systems #AF2085-SP, 1:2000), Otx2 (Genetex #GTX133210, 1:1000), Lef1 (CST #2230S, 1:1000), Notch1 (SCBT #sc-376403, 1:500), β-catenin (Invitrogen #13-8400, 1:3000), streptavidin-HRP (Cytiva #RPN1231, 1:2000), Tcf7l1 (Thermo Fisher Scientific #14519-1-A, 1:2500), Esrrb (Fisher Scientific #PPH670500, 1:1000), and Hdac1 (Abcam, #ab7028, 1:2000).
All primary antibodies were diluted in milk, except for HRP-conjugated streptavidin (5% BSA) as well as Gata3 and Cdx2 (1% BSA). HRP-conjugated secondary antibodies (purchased from Cell Signaling Technology), used at a dilution of 1:12,500 in TBST, were horse anti-mouse (#7076S) and goat anti-rabbit (#7074S), whereas HRP-conjugated goat anti-rat was diluted 1:2000 in 5% milk (#7077S). Mouse anti-goat (Sigma-Aldrich #AP186P) was used at a dilution of 1:10,000 in TBST.
Knockdown, overexpression, and reporter cell line creation
Frozen bacterial stocks containing lentiviral shRNA for gene knockdown (KD) were purchased from Millipore Sigma through the MISSION shRNA library. For transfection, HEK293T cells were seeded at 1.25 × 10⁵ cells/cm2. After attaining a confluency of 60–70%, cells were transfected with 1.2 μg of shRNA-containing pLKO-puro vector (Millipore Sigma) plus 800 ng pCMV-Δ8.9 and 400 ng VSVG packaging plasmids using Lipofectamine 3000 (Thermo Fisher) according to the manufacturer's protocol. After 18 hr, HEK293T medium was replaced with +LIF+ medium. Finally, up to 60 hr after transfection, medium was supplemented with 15 mM HEPES and the lentivirus-containing supernatant was filtered through a 0.45-μm Supor membrane (PALL). Virus was stored at −80°C. For transduction, mESCs were infected at a density of 6 × 10⁵ cells/mL in +LIF with 10 μg/mL polybrene (Millipore). Up to 48 hr after infection, mESCs were selected with puromycin (Thermo Scientific) or geneticin/G418 (Thermo Scientific). Experiments were performed within five passages of infection to minimize loss in KD efficiency. All shRNA constructs used in this study are listed in Table S8.
For inducible overexpression (OE) of tagged proteins, we utilized the pSBtet-GP vector (AddGene) after replacing the luciferase ORF with Flag, biotinylation sequence, and multiple cloning site. A gene of interest, amplified from full-length mESC cDNA reverse transcribed using the ProtoScript II First Strand cDNA Synthesis Kit from New England Biolabs, was cloned and verified with Sanger sequencing. Cloning was performed using the In-Fusion HD Cloning mix (Clontech) or T4 DNA Ligase (NEB) after digestion with NheI HF and NotI HF restriction enzymes (NEB). Confirmed vectors were transformed into Stellar competent E. coli HST08 (Takara Bio) and plasmids were extracted and purified using the PureLink™ Quick Plasmid Miniprep Kit (Thermo Fisher Scientific). The vector was transfected into BirA mESCs at a density of 6 × 10⁵ cells/mL along with a pCMV(CAT)T7-SB100 vector (AddGene) which allows transient expression of transposase. Successful transposition was verified with puromycin selection 24 hr after transfection. Antibiotics were withdrawn one passage before experiments. Doxycycline (Fisher Scientific) was administered for 48 hr at a concentration of 500 ng/mL unless otherwise specified.
To create the Tcf/Lef reporter cell line, we electroporated the Tcf/Lef:H2B-GFP plasmid (AddGene) into J1 or E14 mESCs using the BioRad Gene Pulser Xcell at 250 V and 500 μF. After electroporation, cells were plated and allowed to grow under geneticin selection, and colonies were picked after 7 d followed by expansion.
Immunofluorescence and microscopy
mESCs were seeded at HD (1.6 × 10⁵ cells/cm2 in -LIF, 1.2 × 10⁵ cells/cm2 in +LIF) or LD (1/8th of the HD concentration) on a gelatin-coated μ-Slide VI 0.4 (Ibidi). For -LIF, cells were differentiated for one day before seeding the μ-Slide. After 48 hr, cells were washed with Dulbecco’s phosphate-buffered saline (DPBS) supplemented with CaCl2 and MgCl2 and fixed with 4% paraformaldehyde (depolymerized in 70 mM NaOH at 70°C) for 10 mins. Cells were washed again with DPBS and then permeabilized with 0.2% Triton X-100 in DPBS for five mins.
After washing, samples were blocked using 4% BSA and 1% normal goat serum diluted in DPBS for 1 hr, then incubated overnight with primary antibodies diluted in blocking solution. Primary antibodies were used against β-catenin (1:600) or E-cadherin (1:500). Slide channels were then washed with DPBS followed by 1 hr incubation with fluorescent secondary antibody (goat anti-rabbit IgG Alexa Fluor 488 from Thermo Scientific, 1:1000). Additional washing was followed by addition of ProLong Glass Antifade Mountant with NucBlue (Thermo Scientific). Wnt reporter cells were not permeabilized but rather treated with mountant directly after washing post-fixation. Finally, slides were imaged on a Zeiss LSM 710 Confocal Microscope with the Plan-Apo 63X (oil) objective. Images were processed using the ZEN microscope software to quantify colocalization using the same crosshair coordinates for all samples from any given day. Fluorescent intensity was quantified using ImageJ after tracing polygons around nuclei. For statistical testing, we used Microsoft Excel for ANOVA, Social Science Statistics (https://www.socscistatistics.com/tests/kruskal/default.aspx) for the Kruskal-Wallis test, and Astatsa (https://astatsa.com/OneWay_Anova_with_TukeyHSD/) for ANOVA followed by Bonferroni-corrected p-value correction.
RNA-seq and analysis
For RNA-seq wild-type mESCs in Figures 1 and 2, cells were set at an initial density at 2.6×10⁵ cells/cm2 in a 24-well plate and serially diluted 1:2 a total of six times before seeding all concentrations. Cells were cultured in either +LIF or -LIF for 96 hr before RNA extraction using the RNeasy Mini Kit (Qiagen). For library prep, 1 μg of total RNA was processed using the NEBNext Ultra™ RNA Library Prep Kit for Illumina (NEB) according to manufacturer’s instructions. RNA-seq was then performed in technical duplicate with single-end reads on a NextSeq500 (Illumina).
For KD and OE mESCs, cells were differentiated in -LIF by passaging once into -LIF, then seeding 24 hr later at concentrations of 1.9×10⁵ cells/cm2 for high density (HD) and 2.3×10⁴ cells/cm2 for low density (LD). Cells were differentiated for a total of 72 hr before RNA extraction. For library prep, 500 ng of total RNA was processed using the NEBNext Ultra™ II RNA Library Prep Kit for Illumina (NEB) according to manufacturer’s instructions, with several modifications. In particular, NEXTflex ChIP-Seq Barcodes (Bioo Scientific) were used, the purified ligation reaction was directly mixed with the master mix for amplification without addition of index primers, and 15 PCR cycles were used. RNA-seq was then performed in biological duplicate with paired-end reads on the NovaSeq 6000 (Illumina). For both runs, fragment size distribution and purity were determined using a Bioanalyzer (Agilent).
RNA-seq analysis was performed via kallisto (https://pachterlab.github.io/kallisto/). The Mus musculus mm10 transcriptome was used for pseudomapping with sequence-based bias correction enabled and 100 bootstraps, either in single-end mode (for initial serially diluted, WT samples in Figure 4.1) or paired-end mode (for KD, OE samples in Figure 4.9). kallisto output was then used for differential gene expression analysis in sleuth (https://pachterlab.github.io/sleuth/) using standard settings with the samples indicated in each panel. When needed, transcript IDs were mapped back to genes using BioMart for consolidation of TPM.
Heatmaps were constructed in R using heatmap3. After obtaining TPM, data were routinely processed before heatmaps: non-expressed transcripts (TPM = 0 in all samples) were removed, expression of transcripts corresponding to the same gene (according to BioMart) were consolidated, and genes whose expression was less than an average TPM of 1 across all samples were removed to minimize noise. Further filtering such as q-values and fold change thresholds are described in figure legends. Line graphs and some scatterplots (namely plots utilizing all four quadrants) were made using ggplot. Bar graphs and other scatterplots were made in Excel. All graphs were resized in Adobe Illustrator. Volcano plots were graphed in R with ggplot after -log transforming q-values from sleuth and taking the log2 ratio of TPM between the samples of interest. To reduce overplotting in volcano plots, transcripts with low -log q-values were trimmed. Venn diagrams were generated using InteractiVenn (http://www.interactivenn.net/).
Principal component analysis was performed in R using prcomp and graphed using fviz_pca_ind. Correlograms were built in R using corrplot. Gene ontology analysis was performed in Cytoscape (https://cytoscape.org/) using the app ClueGO (http://apps.cytoscape.org/apps/cluego) using standard settings. For GO analysis on seeding density gradient samples, input was genes with a -log(q-value) above 3.5 for LDA vs. HDA or 3.0 for dLDA vs. HDA as well as a log2 TPM ratio of 1.5. Per panel, approximately 12 of the top terms were pulled out of the term clusters for display.
We also utilized GSEA (https://www.gsea-msigdb.org/gsea/index.jsp) from the Broad Institute and UC San Diego, using sleuth output as input for GSEA Preranked (only using genes with a -log(q-value) > 1.5) and collapsing mouse gene symbols to human gene symbols in the program itself using Mouse_Gene_Symbol_Remapping_Human_Orthologs_MSigDB.v.7.2.chip as the platform.
ChIP-seq and analysis
For ChIP-seq, inducible OE J1 mESCs constitutively expressing BirA were subjected first to dox titration to determine the concentration of dox for ∼2-fold or less OE of the gene of interest (10 ng/mL for FB-Esrrb, 50 ng/mL for FB-Tcf7l1, or 100 ng/mL for FB-β-catenin; FB = FLAG-Biotinylation tag at N-terminus of the protein of interest (Kim et al. 2010)). Then, mESCs were differentiated for 72 h at either HD or LD in -LIF and treated with dox for the last 48 hr. Cells were then fixed using formalin to a final formaldehyde concentration of 1% and incubated at RT with shaking for 7 min. Formaldehyde was then quenched using glycine to a final concentration of 125 mM and incubated with shaking for 5 min. Cells were washed thoroughly with PBS supplemented with protease inhibitors (Roche), scraped, and frozen at −80°C. Pellets were resuspended in ChIP dilution buffer (1% Triton X-100, 2 mM EDTA, 20 mM Tris HCl pH 8, 150 mM NaCl, and protease inhibitors) and sonicated using a Bioruptor (Diagenode). Sheared chromatin (∼300 bp in length) was immunoprecipitated using Dynabeads MyOne Streptavidin T1 (Thermo Scientific) overnight at 4°C and washed extensively. Eluted and purified ChIP samples were prepared for sequencing using the NEBNext Ultra™ II DNA Library Prep Kit for Illumina (NEB). Sequencing was then performed in biological duplicate with paired-end reads on the NovaSeq 6000 (Illumina).
Public ChIP-seq datasets used (GSE90893 for Esrrb, GSE43565 for β-catenin, GSE11724 for Tcf7l1, all in self-renewing mESCs) were downloaded from NCBI using fasterq. All ChIP-seq data was aligned to the mm10 genome using Bowtie2 version 2.4.2 (Langmead and Salzberg 2012) and peaks were called using MACS2 version 2.2.7.1 (Zhang et al. 2008) using default options (q-value cutoff of 0.05 for peaks, remove redundant tags) and appropriate controls (submitter-provided input or whole cell extracts for public datasets, uninduced OE cell input for our datasets). De novo motif analysis was performed in Homer and genomic features were determined using an in-house Perl script and an mm10 refFlat file from UCSC. Peaks were assigned to genomic features with the following hierarchy: promoter (±2 kb of the TSS) > upstream (2–20 kb upstream of the TSS) > intron > exon > intergenic (any other binding site). GO analysis of peaks was performed using GREAT (http://great.stanford.edu/public/html/) (McLean et al. 2010). Co-occupancy histograms were created using Homer and visualized using Java TreeView (https://sourceforge.net/projects/jtreeview/). Violin plots were created using BoxPlotR (http://shiny.chemgrid.org/boxplotr/) and statistical testing was carried out in Microsoft Excel and Astatsa.
Co-immunoprecipitation
For Co-IP, OE cells were seeded at HD or LD in -LIF and treated with the same concentration of dox as for ChIP. Cells were then trypsinized and washed with cold PBS. A total of 2×10⁷ cells were resuspended in cold extraction buffer (20 mM HEPES pH 7.5, 150 mM NaCl, 10% glycerol, 0.25% NP40, 0.5 mM DTT, 1 mM EDTA, and protease inhibitors). Cells were then allowed to rotate at 4°C for 1 hr, centrifuged, and a portion of the supernatant was set aside as input. The rest of the supernatant was immunoprecipitated using Dynabeads MyOne Streptavidin T1 (Thermo Scientific) and rotated at 4°C for 3 h. Beads were then washed with extraction buffer followed by Tris-buffered saline. Then, proteins were eluted by incubating beads in 2x Laemmli buffer plus β-mercaptoethanol for 9 min at 95°C. Western blot then proceeded as normal, except instead of semi-dry transfer, wet transfer was performed due to its greater sensitivity. Wet transfer was carried out using Towbin buffer (25 mM Tris pH 8.3, 192 mM glycine, 20% methanol, chilled to 4°C) for 90 min at 90 V before blocking, adding primary and secondary antibodies with the dilutions specified earlier, washing, and visualizing on a ChemiDoc XRS+.
Quantification and statistical analysis
Quantification was represented by the mean ± standard deviation for each sample where n indicates biological replicates. Two-tailed Student's t-test analysis, ANOVA, or Kruskal-Wallis test was used to examine all significant differences between groups as indicated in the figure legends. Significance was determined when the p values were lower than 0.05, although raw p values are presented where possible. For genomics data and software like GSEA, sleuth, Cytoscape, GSEA, and others, default settings for adjusting p values to q-values were used.
Acknowledgments
We would like to thank the UT Austin Genome Sequencing and Analysis Facility (GSAF) and Texas Advanced Computing Center (TACC) for sequencing data analysis as well as the Center for Biomedical Research Support (CBRS) for confocal microscopy. This research was supported by R01GM112722 (NIH) to JK, as well as the NSF GRFP, Hamilton Seed Grant, and Graduate School Continuing Fellowship to LL.
Author contributions
L.L. and J.K. designed the study. L.L., M.K., A.K., A.J.S., & N.R. performed experiments. L.L. analyzed data. L.L. and J.K. wrote the manuscript. All authors contributed to and approved the paper.
Declaration of interests
The authors declare no competing interests.
Published: January 21, 2022
Footnotes
Supplemental information can be found online at https://doi.org/10.1016/j.isci.2021.103541.
Supplemental information
Data and code availability
-
•
Next-generation sequencing data generated for this study have been deposited in the NCBI GEO with accession number GSE175801 and are publicly available as of the date of publication. Microscopy data reported in this paper will be shared by the lead contact upon request.
-
•
Code used for analysis of RNA-seq and ChIP-seq data as well as generation of heatmaps, PCA, and other graphs made in R can be found in Table S9. All programs and R packages used are publicly available and listed in the key resources table.
-
•
Any additional information required to reanalyze the data reported in this paper is available from the lead contact upon request.
References
- Adhikari S., Moran J., Weddle C., Hinczewski M. Unraveling the mechanism of the cadherin-catenin-actin catch bond. PLoS Comput. Biol. 2018;14:e1006399. doi: 10.1371/journal.pcbi.1006399. [DOI] [PMC free article] [PubMed] [Google Scholar]
- Bao Q., Morshedi A., Wang F., Bhargy S., Pervushin K., Yu W.-P., Dröge P. Utf1 contributes to intergenerational epigenetic inheritance of pluripotency. Sci. Rep. 2017;7:14612. doi: 10.1038/s41598-017-14426-5. [DOI] [PMC free article] [PubMed] [Google Scholar]
- Beck S., Lee B.-K., Kim J. Multi-layered global gene regulation in mouse embryonic stem cells. Cell Mol. Life Sci. 2015;72:199–216. doi: 10.1007/s00018-014-1734-9. [DOI] [PMC free article] [PubMed] [Google Scholar]
- Bray N.L., Pimentel H., Melsted P., Pachter L. Near-optimal probabilistic RNA-seq quantification. Nat. Biotechnol. 2016;34:525–527. doi: 10.1038/nbt.3519. [DOI] [PubMed] [Google Scholar]
- Cao Z., Carey T.S., Ganguly A., Wilson C.A., Paul S., Knott J.G. Transcription factor AP-2γ induces early Cdx2 expression and represses HIPPO signaling to specify the trophectoderm lineage. Development (Cambridge, England) 2015;142:1606–1615. doi: 10.1242/dev.120238. [DOI] [PMC free article] [PubMed] [Google Scholar]
- Cha K.J., Kong S.-Y., Lee J.S., Kim H.W., Shin J.-Y., La M., Han B.W., Kim D.S., Kim H.-J. Cell density-dependent differential proliferation of neural stem cells on omnidirectional nanopore-arrayed surface. Sci. Rep. 2017;7:13077. doi: 10.1038/s41598-017-13372-6. [DOI] [PMC free article] [PubMed] [Google Scholar]
- Chang S.-Y., Carpena N.T., Mun S., Jung J.Y., Chung P.-S., Shim H., Han K., Ahn J.-C., Lee M.Y. Enhanced inner-ear organoid formation from mouse embryonic stem cells by photobiomodulation. Mol. Ther. Methods Clin. Dev. 2020;17:556–567. doi: 10.1016/j.omtm.2020.03.010. [DOI] [PMC free article] [PubMed] [Google Scholar]
- Chronis C., Fiziev P., Papp B., Butz S., Bonora G., Sabri S., Ernst J., Plath K. Cooperative binding of transcription factors orchestrates reprogramming. Cell. 2017;168:442–459.e20. doi: 10.1016/j.cell.2016.12.016. [DOI] [PMC free article] [PubMed] [Google Scholar]
- Davidson K.C., Adams A.M., Goodson J.M., McDonald C.E., Potter J.C., Berndt J.D., Biechele T.L., Taylor R.J., Moon R.T. Wnt/β-catenin signaling promotes differentiation, not self-renewal, of human embryonic stem cells and is repressed by Oct4. Proc. Natl. Acad. Sci. U S A. 2012;109:4485–4490. doi: 10.1073/pnas.1118777109. [DOI] [PMC free article] [PubMed] [Google Scholar]
- Demerdash Z., El-Baz H., Maher K., Hassan S., Salah F., Hassan M., Elzallat M., El-Shafei M., Taha T. Effect of repeated passaging and cell density on proliferation and differentiation potential of cord blood unrestricted somatic stem cells. New Horizons Translational Med. 2015;2:67. [Google Scholar]
- Deng F., Peng L., Li Z., Tan G., Liang E., Chen S., Zhao X., Zhi F. YAP triggers the Wnt/β-catenin signalling pathway and promotes enterocyte self-renewal, regeneration and tumorigenesis after DSS-induced injury. Cell Death Dis. 2018;9:153. doi: 10.1038/s41419-017-0244-8. [DOI] [PMC free article] [PubMed] [Google Scholar]
- Ding L., Zhang Y., Han L., Fu L., Mei X., Wang J., Itkow J., Elabid A.E.I., Pang L., Yu D. Activating and sustaining c-Myc by depletion of miR-144/451 gene locus contributes to B-lymphomagenesis. Oncogene. 2018;37:1293–1307. doi: 10.1038/s41388-017-0055-5. [DOI] [PMC free article] [PubMed] [Google Scholar]
- Fan M., Xu Y., Hong F., Gao X., Xin G., Hong H., Dong L., Zhao X. Rac1/β-catenin signalling pathway contributes to trophoblast cell invasion by targeting snail and MMP9. Cell Physiol. Biochem. 2016;38:1319–1332. doi: 10.1159/000443076. [DOI] [PubMed] [Google Scholar]
- Faux M.C., Coates J.L., Kershaw N.J., Layton M.J., Burgess A.W. Independent interactions of phosphorylated β-catenin with E-cadherin at cell-cell contacts and APC at cell protrusions. PLoS ONE. 2010;5:e14127. doi: 10.1371/journal.pone.0014127. [DOI] [PMC free article] [PubMed] [Google Scholar]
- Ferrer-Vaquer A., Piliszek A., Tian G., Aho R.J., Dufort D., Hadjantonakis A.-K. A sensitive and bright single-cell resolution live imaging reporter of Wnt/ß-catenin signaling in the mouse. BMC Dev. Biol. 2010;10:121. doi: 10.1186/1471-213X-10-121. [DOI] [PMC free article] [PubMed] [Google Scholar]
- Festuccia N., Osorno R., Halbritter F., Karwacki-Neisius V., Navarro P., Colby D., Wong F., Yates A., Tomlinson S.R., Chambers I. Esrrb is a direct Nanog target gene that can substitute for Nanog function in pluripotent cells. Cell Stem Cell. 2012;11:477–490. doi: 10.1016/j.stem.2012.08.002. [DOI] [PMC free article] [PubMed] [Google Scholar]
- Festuccia N., Owens N., Navarro P. Esrrb, an estrogen-related receptor involved in early development, pluripotency, and reprogramming. FEBS Lett. 2018;592:852–877. doi: 10.1002/1873-3468.12826. [DOI] [PubMed] [Google Scholar]
- Gage B.K., Webber T.D., Kieffer T.J. Initial cell seeding density influences pancreatic endocrine development during in vitro differentiation of human embryonic stem cells. PLoS One. 2013;8:e82076. doi: 10.1371/journal.pone.0082076. [DOI] [PMC free article] [PubMed] [Google Scholar]
- Griffin J.N., Del Viso F., Duncan A.R., Robson A., Hwang W., Kulkarni S., Liu K.J., Khokha M.K. RAPGEF5 regulates nuclear translocation of β-catenin. Dev. Cell. 2018;44:248–260.e4. doi: 10.1016/j.devcel.2017.12.001. [DOI] [PMC free article] [PubMed] [Google Scholar]
- Guo M.-L., Sun M.-X., Lan J.-Z., Yan L.-S., Zhang J.-J., Hu X.-X., Xu S., Mao D.-H., Yang H.-S., Liu Y.-W., et al. Proteomic analysis of the effects of cell culture density on the metastasis of breast cancer cells. Cell Biochem. Funct. 2019;37:72–83. doi: 10.1002/cbf.3377. [DOI] [PubMed] [Google Scholar]
- Hanafiah A., Geng Z., Wang Q., Gao Z. Differentiation and characterization of neural progenitors and neurons from mouse embryonic stem cells. JoVE. 2020:e61446. doi: 10.3791/61446. [DOI] [PMC free article] [PubMed] [Google Scholar]
- Hoffmeyer K., Junghans D., Kanzler B., Kemler R. Trimethylation and acetylation of β-catenin at lysine 49 represent key elements in ESC pluripotency. Cell Rep. 2017;18:2815–2824. doi: 10.1016/j.celrep.2017.02.076. [DOI] [PubMed] [Google Scholar]
- Hrckulak D., Kolar M., Strnad H., Korinek V. TCF/LEF transcription factors: An update from the internet resources. Cancers (Basel) 2016;8:70. doi: 10.3390/cancers8070070. [DOI] [PMC free article] [PubMed] [Google Scholar]
- Jeon H., Waku T., Azami T., Khoa L.T.P., Yanagisawa J., Takahashi S., Ema M. Comprehensive Identification of Krüppel-like factor family members contributing to the self-renewal of mouse embryonic stem cells and cellular reprogramming. PLoS one. 2016;11:e0150715. doi: 10.1371/journal.pone.0150715. [DOI] [PMC free article] [PubMed] [Google Scholar]
- Kempf H., Olmer R., Haase A., Franke A., Bolesani E., Schwanke K., Robles-Diaz D., Coffee M., Göhring G., Dräger G., et al. Bulk cell density and Wnt/TGFbeta signalling regulate mesendodermal patterning of human pluripotent stem cells. Nat. Commun. 2016;7:13602. doi: 10.1038/ncomms13602. [DOI] [PMC free article] [PubMed] [Google Scholar]
- Kim D.S., Lee M.W., Lee T.-H., Sung K.W., Koo H.H., Yoo K.H. Cell culture density affects the stemness gene expression of adipose tissue-derived mesenchymal stem cells. Biomed. Rep. 2017;6:300–306. doi: 10.3892/br.2017.845. [DOI] [PMC free article] [PubMed] [Google Scholar]
- Kim H., Wu J., Ye S., Tai C.-I., Zhou X., Yan H., Li P., Pera M., Ying Q.-L. Modulation of β-catenin function maintains mouse epiblast stem cell and human embryonic stem cell self-renewal. Nat. Commun. 2013;4:2403. doi: 10.1038/ncomms3403. [DOI] [PMC free article] [PubMed] [Google Scholar]
- Kim J., Chu J., Shen X., Wang J., Orkin S.H. An extended transcriptional network for pluripotency of embryonic stem cells. Cell. 2008;132:1049–1061. doi: 10.1016/j.cell.2008.02.039. [DOI] [PMC free article] [PubMed] [Google Scholar]
- Kim J., Woo A.J., Chu J., Snow J.W., Fujiwara Y., Kim C.G., Cantor A.B., Orkin S.H. A Myc network accounts for similarities between embryonic stem and cancer cell transcription programs. Cell. 2010;143:313–324. doi: 10.1016/j.cell.2010.09.010. [DOI] [PMC free article] [PubMed] [Google Scholar]
- Kim W.K., Kwon Y., Jang M., Park M., Kim J., Cho S., Jang D.G., Lee W.-B., Jung S.H., Choi H.J., et al. β-catenin activation down-regulates cell-cell junction-related genes and induces epithelial-to-mesenchymal transition in colorectal cancers. Scientific Rep. 2019;9:18440. doi: 10.1038/s41598-019-54890-9. [DOI] [PMC free article] [PubMed] [Google Scholar]
- Kourtidis A., Lu R., Pence L.J., Anastasiadis P.Z. A central role for cadherin signaling in cancer. Exp. Cel. Res. 2017;358:78–85. doi: 10.1016/j.yexcr.2017.04.006. [DOI] [PMC free article] [PubMed] [Google Scholar]
- Lackner A., Sehlke R., Garmhausen M., Giuseppe Stirparo G., Huth M., Titz-Teixeira F., van der Lelij P., Ramesmayer J., Thomas H.F., Ralser M., et al. Cooperative genetic networks drive embryonic stem cell transition from naïve to formative pluripotency. EMBO J. 2021;40:e105776. doi: 10.15252/embj.2020105776. [DOI] [PMC free article] [PubMed] [Google Scholar]
- Langmead B., Salzberg S.L. Fast gapped-read alignment with Bowtie 2. Nat. Methods. 2012;9:357–359. doi: 10.1038/nmeth.1923. [DOI] [PMC free article] [PubMed] [Google Scholar]
- Lee L.A., Resar L.M., Dang C.V. Cell density and paradoxical transcriptional properties of c-Myc and Max in cultured mouse fibroblasts. J. Clin. Invest. 1995;95:900–904. doi: 10.1172/JCI117741. [DOI] [PMC free article] [PubMed] [Google Scholar]
- Leporcq C., Spill Y., Balaramane D., Toussaint C., Weber M., Bardet A.F. TFmotifView: A webserver for the visualization of transcription factor motifs in genomic regions. Nucleic Acids Res. 2020;48:W208–W217. doi: 10.1093/nar/gkaa252. [DOI] [PMC free article] [PubMed] [Google Scholar]
- Liang R., Liu Y. Tcf7l1 directly regulates cardiomyocyte differentiation in embryonic stem cells. Stem Cell Res Ther. 2018;9:267. doi: 10.1186/s13287-018-1015-x. [DOI] [PMC free article] [PubMed] [Google Scholar]
- Liu G., Ruan Y., Zhang J., Wang X., Wu W., He P., Wang J., Xiong J., Cheng Y., Liu L., et al. ABHD11 is critical for embryonic stem cell expansion, differentiation and lipid metabolic homeostasis. Front. Cell Developmental Biol. 2020;8:570. doi: 10.3389/fcell.2020.00570. [DOI] [PMC free article] [PubMed] [Google Scholar]
- Liu Y., Huang J., Yu N., Wei S., Liu Z. Involvement of WNT2 in trophoblast cell behavior in preeclampsia development. Cell Cycle. 2020;19:2207–2215. doi: 10.1080/15384101.2020.1802913. [DOI] [PMC free article] [PubMed] [Google Scholar]
- Luo Z., Liu X., Xie H., Wang Y., Lin C. ZFP281 recruits MYC to active promoters in regulating transcriptional initiation and elongation. Mol. Cell Biol. 2019;39 doi: 10.1128/MCB.00329-19. e00329–e00319. [DOI] [PMC free article] [PubMed] [Google Scholar]
- Mao X., Zhao S. Neuronal differentiation from mouse embryonic stem cells in vitro. JoVE. 2020:e61190. doi: 10.3791/61190. [DOI] [PubMed] [Google Scholar]
- Marson A., Levine S.S., Cole M.F., Frampton G.M., Brambrink T., Johnstone S., Guenther M.G., Johnston W.K., Wernig M., Newman J., et al. Connecting microRNA genes to the core transcriptional regulatory circuitry of embryonic stem cells. Cell. 2008;134:521–533. doi: 10.1016/j.cell.2008.07.020. [DOI] [PMC free article] [PubMed] [Google Scholar]
- Martello G., Sugimoto T., Diamanti E., Joshi A., Hannah R., Ohtsuka S., Göttgens B., Niwa H., Smith A. Esrrb is a pivotal target of the Gsk3/Tcf3 axis regulating embryonic stem cell self-renewal. Cell Stem Cell. 2012;11:491–504. doi: 10.1016/j.stem.2012.06.008. [DOI] [PMC free article] [PubMed] [Google Scholar]
- McLean C.Y., Bristor D., Hiller M., Clarke S.L., Schaar B.T., Lowe C.B., Wenger A.M., Bejerano G. GREAT improves functional interpretation of cis-regulatory regions. Nat. Biotechnol. 2010;28:495–501. doi: 10.1038/nbt.1630. [DOI] [PMC free article] [PubMed] [Google Scholar]
- Memon B., Karam M., Al-Khawaga S., Abdelalim E.M. Enhanced differentiation of human pluripotent stem cells into pancreatic progenitors co-expressing PDX1 and NKX6.1. Stem Cell Res Ther. 2018;9:15. doi: 10.1186/s13287-017-0759-z. [DOI] [PMC free article] [PubMed] [Google Scholar]
- Moreira S., Polena E., Gordon V., Abdulla S., Mahendram S., Cao J., Blais A., Wood G.A., Dvorkin-Gheva A., Doble B.W. A single TCF transcription factor, regardless of its activation capacity, is sufficient for effective trilineage differentiation of ESCs. Cell Rep. 2017;20:2424–2438. doi: 10.1016/j.celrep.2017.08.043. [DOI] [PubMed] [Google Scholar]
- Mori M., Triboulet R., Mohseni M., Schlegelmilch K., Shrestha K., Camargo F.D., Gregory R.I. Hippo signaling regulates microprocessor and links cell-density-dependent miRNA biogenesis to cancer. Cell. 2014;156:893–906. doi: 10.1016/j.cell.2013.12.043. [DOI] [PMC free article] [PubMed] [Google Scholar]
- Mosaad E.O., Futrega K., Seim I., Gloss B., Chambers K.F., Clements J.A., Doran M.R. Constraints to counting bioluminescence producing cells by a commonly used transgene promoter and its implications for experimental design. Scientific Rep. 2019;9:11334. doi: 10.1038/s41598-019-46916-z. [DOI] [PMC free article] [PubMed] [Google Scholar]
- Mossahebi-Mohammadi M., Quan M., Zhang J.-S., Li X. FGF signaling pathway: A key regulator of stem cell pluripotency. Front. Cel. Dev. Biol. 2020;8:79. doi: 10.3389/fcell.2020.00079. [DOI] [PMC free article] [PubMed] [Google Scholar]
- Mukherjee A., Dhar N., Stathos M., Schaffer D.V., Kane R.S. Understanding how Wnt influences destruction complex activity and β-catenin dynamics. iScience. 2018;6:13–21. doi: 10.1016/j.isci.2018.07.007. [DOI] [PMC free article] [PubMed] [Google Scholar]
- Mullane K., Curtis M.J., Williams M. In: Research in the Biomedical Sciences. Williams M., Curtis M.J., Mullane K., editors. Academic Press; 2018. Chapter 1 - reproducibility in biomedical research; pp. 1–66. [Google Scholar]
- Nair G.G., Tzanakakis E.S., Hebrok M. Emerging routes to the generation of functional β-cells for diabetes mellitus cell therapy. Nat. Rev. Endocrinol. 2020;16:506–518. doi: 10.1038/s41574-020-0375-3. [DOI] [PMC free article] [PubMed] [Google Scholar]
- Pantier R., Chhatbar K., Quante T., Skourti-Stathaki K., Cholewa-Waclaw J., Alston G., Alexander-Howden B., Lee H.Y., Cook A.G., Spruijt C.G., et al. SALL4 controls cell fate in response to DNA base composition. Mol. Cell. 2021;81:845–858.e8. doi: 10.1016/j.molcel.2020.11.046. [DOI] [PMC free article] [PubMed] [Google Scholar]
- Pieters T., Goossens S., Haenebalcke L., Andries V., Stryjewska A., De Rycke R., Lemeire K., Hochepied T., Huylebroeck D., Berx G., et al. p120 Catenin-mediated stabilization of E-cadherin is essential for primitive endoderm specification. Plos Genet. 2016;12:e1006243. doi: 10.1371/journal.pgen.1006243. [DOI] [PMC free article] [PubMed] [Google Scholar]
- Pimentel H., Bray N.L., Puente S., Melsted P., Pachter L. Differential analysis of RNA-seq incorporating quantification uncertainty. Nat. Methods. 2017;14:687–690. doi: 10.1038/nmeth.4324. [DOI] [PubMed] [Google Scholar]
- Qu Y., Gharbi N., Yuan X., Olsen J.R., Blicher P., Dalhus B., Brokstad K.A., Lin B., Øyan A.M., Zhang W., et al. Axitinib blocks Wnt/β-catenin signaling and directs asymmetric cell division in cancer. Proc. Natl. Acad. Sci. U S A. 2016;113:9339–9344. doi: 10.1073/pnas.1604520113. [DOI] [PMC free article] [PubMed] [Google Scholar]
- Shahbazi M.N. Mechanisms of human embryo development: from cell fate to tissue shape and back. Development. 2020;147:dev190629. doi: 10.1242/dev.190629. [DOI] [PMC free article] [PubMed] [Google Scholar]
- Shang S., Hua F., Hu Z.-W. The regulation of β-catenin activity and function in cancer: Therapeutic opportunities. Oncotarget. 2017;8:33972–33989. doi: 10.18632/oncotarget.15687. [DOI] [PMC free article] [PubMed] [Google Scholar]
- Shy B.R., Wu C.-I., Khramtsova G.F., Zhang J.Y., Olopade O.I., Goss K.H., Merrill B.J. Regulation of Tcf7l1 DNA binding and protein stability as principal mechanisms of Wnt/β-catenin signaling. Cell Rep. 2013;4:1–9. doi: 10.1016/j.celrep.2013.06.001. [DOI] [PMC free article] [PubMed] [Google Scholar]
- Sim Y.-J., Kim M.-S., Nayfeh A., Yun Y.-J., Kim S.-J., Park K.-T., Kim C.-H., Kim K.-S. 2i maintains a naive ground state in ESCs through two distinct epigenetic mechanisms. Stem Cel. Rep. 2017;8:1312–1328. doi: 10.1016/j.stemcr.2017.04.001. [DOI] [PMC free article] [PubMed] [Google Scholar]
- Song L., Sun N., Peng G., Chen J., Han J.-D.J., Jing N. Genome-wide ChIP-seq and RNA-seq analyses of Pou3f1 during mouse pluripotent stem cell neural fate commitment. Genomics Data. 2015;5:375–377. doi: 10.1016/j.gdata.2015.06.028. [DOI] [PMC free article] [PubMed] [Google Scholar]
- Sukho P., Kirpensteijn J., Hesselink J.W., van Osch G.J.V.M., Verseijden F., Bastiaansen-Jenniskens Y.M. Effect of cell seeding density and inflammatory cytokines on adipose tissue-derived stem cells: An in vitro study. Stem Cell Rev. Rep. 2017;13:267–277. doi: 10.1007/s12015-017-9719-3. [DOI] [PMC free article] [PubMed] [Google Scholar]
- Sullivan A.E., Santos S.D.M. An optimized protocol for ChIP-seq from human embryonic stem cell cultures. STAR Protoc. 2020;1:100062. doi: 10.1016/j.xpro.2020.100062. [DOI] [PMC free article] [PubMed] [Google Scholar]
- Sun H., Wang X., Liu K., Guo M., Zhang Y., Ying Q.-L., Ye S. β-catenin coordinates with Jup and the TCF1/GATA6 axis to regulate human embryonic stem cell fate. Dev. Biol. 2017;431:272–281. doi: 10.1016/j.ydbio.2017.09.004. [DOI] [PubMed] [Google Scholar]
- Theka I., Sottile F., Cammisa M., Bonnin S., Sanchez-Delgado M., Di Vicino U., Neguembor M.V., Arumugam K., Aulicino F., Monk D., et al. Wnt/β-catenin signaling pathway safeguards epigenetic stability and homeostasis of mouse embryonic stem cells. Sci. Rep. 2019;9:948. doi: 10.1038/s41598-018-37442-5. [DOI] [PMC free article] [PubMed] [Google Scholar]
- Tu C., Xu R., Koleti M., Zoldan J. Glycogen synthase kinase-3 inhibition sensitizes human induced pluripotent stem cells to thiol-containing antioxidants induced apoptosis. Stem Cell Res. 2017;23:182–187. doi: 10.1016/j.scr.2017.07.019. [DOI] [PubMed] [Google Scholar]
- Turner D.A., Rué P., Mackenzie J.P., Davies E., Martinez Arias A. Brachyury cooperates with Wnt/β-catenin signalling to elicit primitive-streak-like behaviour in differentiating mouse embryonic stem cells. BMC Biol. 2014;12:63. doi: 10.1186/s12915-014-0063-7. [DOI] [PMC free article] [PubMed] [Google Scholar]
- Venugopal B., Mogha P., Dhawan J., Majumder A. Cell density overrides the effect of substrate stiffness on human mesenchymal stem cells’ morphology and proliferation. Biomater. Sci. 2018;6:1109–1119. doi: 10.1039/c7bm00853h. [DOI] [PMC free article] [PubMed] [Google Scholar]
- Wang L., Chen Y.-G. Signaling control of differentiation of embryonic stem cells toward mesendoderm. J. Mol. Biol. 2016;428:1409–1422. doi: 10.1016/j.jmb.2015.06.013. [DOI] [PubMed] [Google Scholar]
- Wang L., Xu X., Cao Y., Li Z., Cheng H., Zhu G., Duan F., Na J., Han J.-D.J., Chen Y.-G. Activin/Smad2-induced histone H3 Lys-27 Trimethylation (H3K27me3) reduction is crucial to initiate mesendoderm differentiation of human embryonic stem cells. J. Biol. Chem. 2017;292:1339–1350. doi: 10.1074/jbc.M116.766949. [DOI] [PMC free article] [PubMed] [Google Scholar]
- Wang M., Tang L., Liu D., Ying Q.-L., Ye S. The transcription factor Gbx2 induces expression of Kruppel-like factor 4 to maintain and induce naïve pluripotency of embryonic stem cells. J. Biol. Chem. 2017;292:17121–17128. doi: 10.1074/jbc.M117.803254. [DOI] [PMC free article] [PubMed] [Google Scholar]
- Wilson H.K., Canfield S.G., Hjortness M.K., Palecek S.P., Shusta E.V. Exploring the effects of cell seeding density on the differentiation of human pluripotent stem cells to brain microvascular endothelial cells. Fluids Barriers CNS. 2015;12:13. doi: 10.1186/s12987-015-0007-9. [DOI] [PMC free article] [PubMed] [Google Scholar]
- Xu X., Guo M., Zhang N., Ye S. Telomeric noncoding RNA promotes mouse embryonic stem cell self-renewal through inhibition of TCF3 activity. Am. J. Physiology-Cell Physiol. 2018;314:C712–C720. doi: 10.1152/ajpcell.00292.2017. [DOI] [PubMed] [Google Scholar]
- Yao L., Zou X., Liu L. The TCP1 ring complex is associated with malignancy and poor prognosis in hepatocellular carcinoma. Int. J. Clin. Exp. Pathol. 2019;12:3329–3343. [PMC free article] [PubMed] [Google Scholar]
- Yuan Y.-H., Zhou J., Zhang Y., Xu M.-D., Wu J., Li W., Wu M.-Y., Li D.-M. Identification of key genes and pathways downstream of the β-catenin-TCF7L1 complex in pancreatic cancer cells using bioinformatics analysis. Oncol. Lett. 2019;18:1117–1132. doi: 10.3892/ol.2019.10444. [DOI] [PMC free article] [PubMed] [Google Scholar]
- Zhang H., Gayen S., Xiong J., Zhou B., Shanmugam Avinash K., Sun Y., Karatas H., Liu L., Rao Rajesh C., Wang S., et al. MLL1 inhibition reprograms epiblast stem cells to naive pluripotency. Cell Stem Cell. 2016;18:481–494. doi: 10.1016/j.stem.2016.02.004. [DOI] [PMC free article] [PubMed] [Google Scholar]
- Zhang M., Leitch H.G., Tang W.W.C., Festuccia N., Hall-Ponsele E., Nichols J., Surani M.A., Smith A., Chambers I. Esrrb Complementation rescues development of nanog-null germ cells. Cell Rep. 2018;22:332–339. doi: 10.1016/j.celrep.2017.12.060. [DOI] [PMC free article] [PubMed] [Google Scholar]
- Zhang N., Tian Y.-N., Zhou L.-N., Li M.-Z., Chen H.-D., Song S.-S., Huan X.-J., Bao X.-B., Zhang A., Miao Z.-H., et al. Glycogen synthase kinase 3β inhibition synergizes with PARP inhibitors through the induction of homologous recombination deficiency in colorectal cancer. Cell Death Dis. 2021;12:183. doi: 10.1038/s41419-021-03475-4. [DOI] [PMC free article] [PubMed] [Google Scholar]
- Zhang X., Peterson K.A., Liu X.S., McMahon A.P., Ohba S. Gene regulatory networks mediating canonical Wnt signal-directed control of pluripotency and differentiation in embryo stem cells. Stem Cells. 2013;31:2667–2679. doi: 10.1002/stem.1371. [DOI] [PMC free article] [PubMed] [Google Scholar]
- Zhang Y., Liu T., Meyer C.A., Eeckhoute J., Johnson D.S., Bernstein B.E., Nusbaum C., Myers R.M., Brown M., Li W., et al. Model-based analysis of ChIP-seq (MACS) Genome Biol. 2008;9:R137. doi: 10.1186/gb-2008-9-9-r137. [DOI] [PMC free article] [PubMed] [Google Scholar]
Associated Data
This section collects any data citations, data availability statements, or supplementary materials included in this article.
Supplementary Materials
Data Availability Statement
-
•
Next-generation sequencing data generated for this study have been deposited in the NCBI GEO with accession number GSE175801 and are publicly available as of the date of publication. Microscopy data reported in this paper will be shared by the lead contact upon request.
-
•
Code used for analysis of RNA-seq and ChIP-seq data as well as generation of heatmaps, PCA, and other graphs made in R can be found in Table S9. All programs and R packages used are publicly available and listed in the key resources table.
-
•
Any additional information required to reanalyze the data reported in this paper is available from the lead contact upon request.