

Abstract
Occupational and recreational acoustic noise exposure is known to cause permanent hearing damage and reduced quality of life, which indicates the importance of noise controls including hearing protection devices (HPDs) in situations where high noise levels exist. While HPDs can provide adequate protection for many noise exposures, it is often a challenge to properly train HPD users and maintain compliance with us-age guidelines. HPD fit-testing systems are commercially available to ensure proper attenuation is achieved, but they often require specific facilities designed for hearing testing (e.g. a quiet room or an audiometric booth) or special equipment (e.g. modified HPDs designed specifically for fit testing). In this study, we explored using visual information from a photograph of an HPD inserted into the ear to estimate hearing protector attenuation. Our dataset consists of 960 unique photographs from four types of hearing protectors across 160 individuals. We achieved 73% classification accuracy in predicting if the fit was greater or less than the median measured attenuation (29 dB at 1 kHz) using a Deep Neural Network (DNN). Ultimately, the fit-test technique developed in this research could be used for training as well as for automated compliance monitoring in noisy environments to prevent hearing loss.
I. INTRODUCTION
Dangerous acoustic noise levels are encountered occupationally by 22 million workers annually (Tak et al., 2009). Occupational and recreational noise is known to cause permanent hearing damage and reduced quality of life, which indicates the importance of noise controls including hearing protection devices (HPDs). While HPDs can provide adequate protection for many noise exposures, training wearers and ensuring consistent compliance among them is often a challenge. In the military, hearing protection devices are often not worn due to the fact that auditory situational awareness (e.g. sound detection, sound localization and speech perception) may be reduced (Smalt et al., 2020). This in turn results in exposures that result in temporary and permanent audiometric shifts and also possibly additional non-measurable damage to the auditory system(Hecht et al., 2019; Yankaskas et al., 2017).
One way to help maintain both auditory situational awareness and HPD compliance is to provide only as much attenuation that is needed for the given noise environment, as not to overprotect (Lee and Casali, 2017) and even cognitive performance (Smalt et al., 2020). Noise Reduction Ratings (NRRs) provide a way to assess the range of protection that different types of HPDs can provide through a single attenuation value in decibels (dB), and thus could be used to estimate the necessary amount of protection for a given environment. In the United States, manufacturers are required to label all HPDs with the NRR; however, because it is a laboratory-based test, the NRR is known to often overestimate the actual protection level provided in the field. Because of this overestimation bias, the NRR is often de-rated by 50% on a dB scale before calculating if a protected exposure is safe or not (Berger, 1996).
In addition to laboratory-based evaluations such as the NRR, it is also possible measure the attenuation of HPDs in the field for a given individual. This practice is often referred to as hearing protection fit testing, which may be accomplished by several methods. The first method is the Real-Ear Attenuation at Threshold (REAT), first demonstrated in the field by Michael et al. (1976). The REAT attenuation is calculated as the difference of the threshold of audibility measured with the hearing protector in place to the threshold obtained from the open ear. This process is then repeated across several frequencies to come up with a single personal attenuation rating (ANSI/ASA, 2018).
A second approach to hearing protector attenuation measurement is to use the Microphone in Real Ear (MIRE) technique. he MIRE technique takes the difference between sound pressure levels measured in the free-field (outside the ear) and those behind the hearing protector (Voix et al., 2006). The behind-the-hearing-protector measurement is accomplished by either placing the microphone in the ear canal before the earplug is inserted, embedding in the earplug in the protector, or by a tube that penetrates the earplug and connects to an external microphone. One advantage to the MIRE approach is that it is typically faster than a REAT-like test, since it requires no behavioral response. One negative aspect of the MIRE is that it can be difficult to position the microphone in the ear, or require a proprietary system.
The speed of hearing-protector fit testing has become more important recently because individual fit-testing is now being incorporated into hearing conservation programs to document how well hearing protection is being used, and potentially to reduce noise-induced hearing loss by increasing achieved attenuation (Hager et al., 2011; Schulz et al., 2011; Voix et al., 2020). In addition, portable hearing protection fit evaluation systems have been developed that are essentially over-the-ear headphones that fit over the HPD (Murphy et al., 2016).
Several studies have investigated methods to assess the performance of earplugs in the work place (Biabani et al., 2017; Copelli et al., 2021; Voix and Hager, 2009) and in the military (Federman et al., 2020). These studies suggest that individual fit testing as part of training procedures may impact compliance and improve achieved attenuation. In our prior work, we administered a fit test with the NIOSH HPD Well-Fit™, and also tracked attenuation continuously throughout the day at a rifle training range (Davis et al., 2019) using a custom in-ear noise monitoring device. We found that in-ear exposure levels that exceeded recommended limits were associated with poor HPD Fit.
In the present study, we explore the use of automatic inspection of the hearing-protector fit using photographs of the hearing protector fit in the ear to estimate the attenuation as an alternative to the existing methods. Our motivation to develop such a tool is two-fold. First, photograph-based fit estimation could provide automated feedback on hearing protection fit status almost instantly just before and even during exposure to noisy environments. Second, a photograph-based fit-check system can be deployed widely as a smartphone application, and used as part of training procedures with non-experts.
The system described in this paper relies on a form of machine learning referred to as deep neural networks or DNNs. DNNs have been broadly applied across many fields including automatic object detection (Szegedy et al., 2013) and recognition (Cichy et al., 2016), facial detection (Zhang and Zhang, 2014), and even medical image diagnosis (Lu et al., 2017). The sections that follow describe the data used to train the DNN for HPD fit-estimation, the architectures evaluated, and model performance. Finally, a smartphone implementation is presented as well as further discussion for practical use.
II. METHODS
A. Hearing Protector Fit Data
To develop an algorithm to predict hearing protection fit status based on a photograph, two components are necessary: a laboratory measurement of HPD attenuation, and a corresponding photograph of the fit. Our data source was derived from a HPD training study (Murphy et al., 2011) which characterized the effect of three different training instruction types (visual instruction, audio instruction, and expert fit). One hundred sixty participants total were enrolled in that study, and each was tested on one of four types of hearing protection (40 participants per HPD type). The fit study was done in a reverberant room for both ears simultaneously using the REAT method, per ANSI/ASA S12.6–2008 (ANSI/ASA, 2008). The four hearing protectors used were the Moldex Pura-Fit® (Moldex, Culver City, CA), E-A-R™Classic™,(3M, Minneapolis, MN) foam earplugs, Howard Leight Fusion®, and AirSoft® (Sperian Protection, Smithfield, RI) flanged earplugs. The NRR for each HPD was 33dB, 29dB, 27dB, and 27 dB, respectively. The measured attenuation values at 1 kHz across all hearing protectors were approximately normally distributed with a mean of 29.3 dB, and a standard deviation of 9.3 dB, and ranged from 0 to 53 dB.
Figure 1 shows photographs of both ears taken just before each attenuation measurement was conducted. Since three different fit training instruction methods were compared in this study for each subject, a total of 480 unique hearing protector fits were conducted, resulting in 960 images total when considering both ears. Each photograph was assigned a label: “good fit” or “poor fit” based on the median attenuation at 1 kHz, which was 29 dB. A single frequency was used as a proxy for attenuation as to be compatible with planned future validation studies where only a single frequency will be measured due to time constraints. We compared this approach with averaging the attenuation across all frequencies and did not find any significant change in our results; see section IV B for a discussion of the implications of this design choice on our results. Figure 1 contains randomly selected exemplars of these two classes, where a visual difference may be observable to the reader.
FIG. 1.
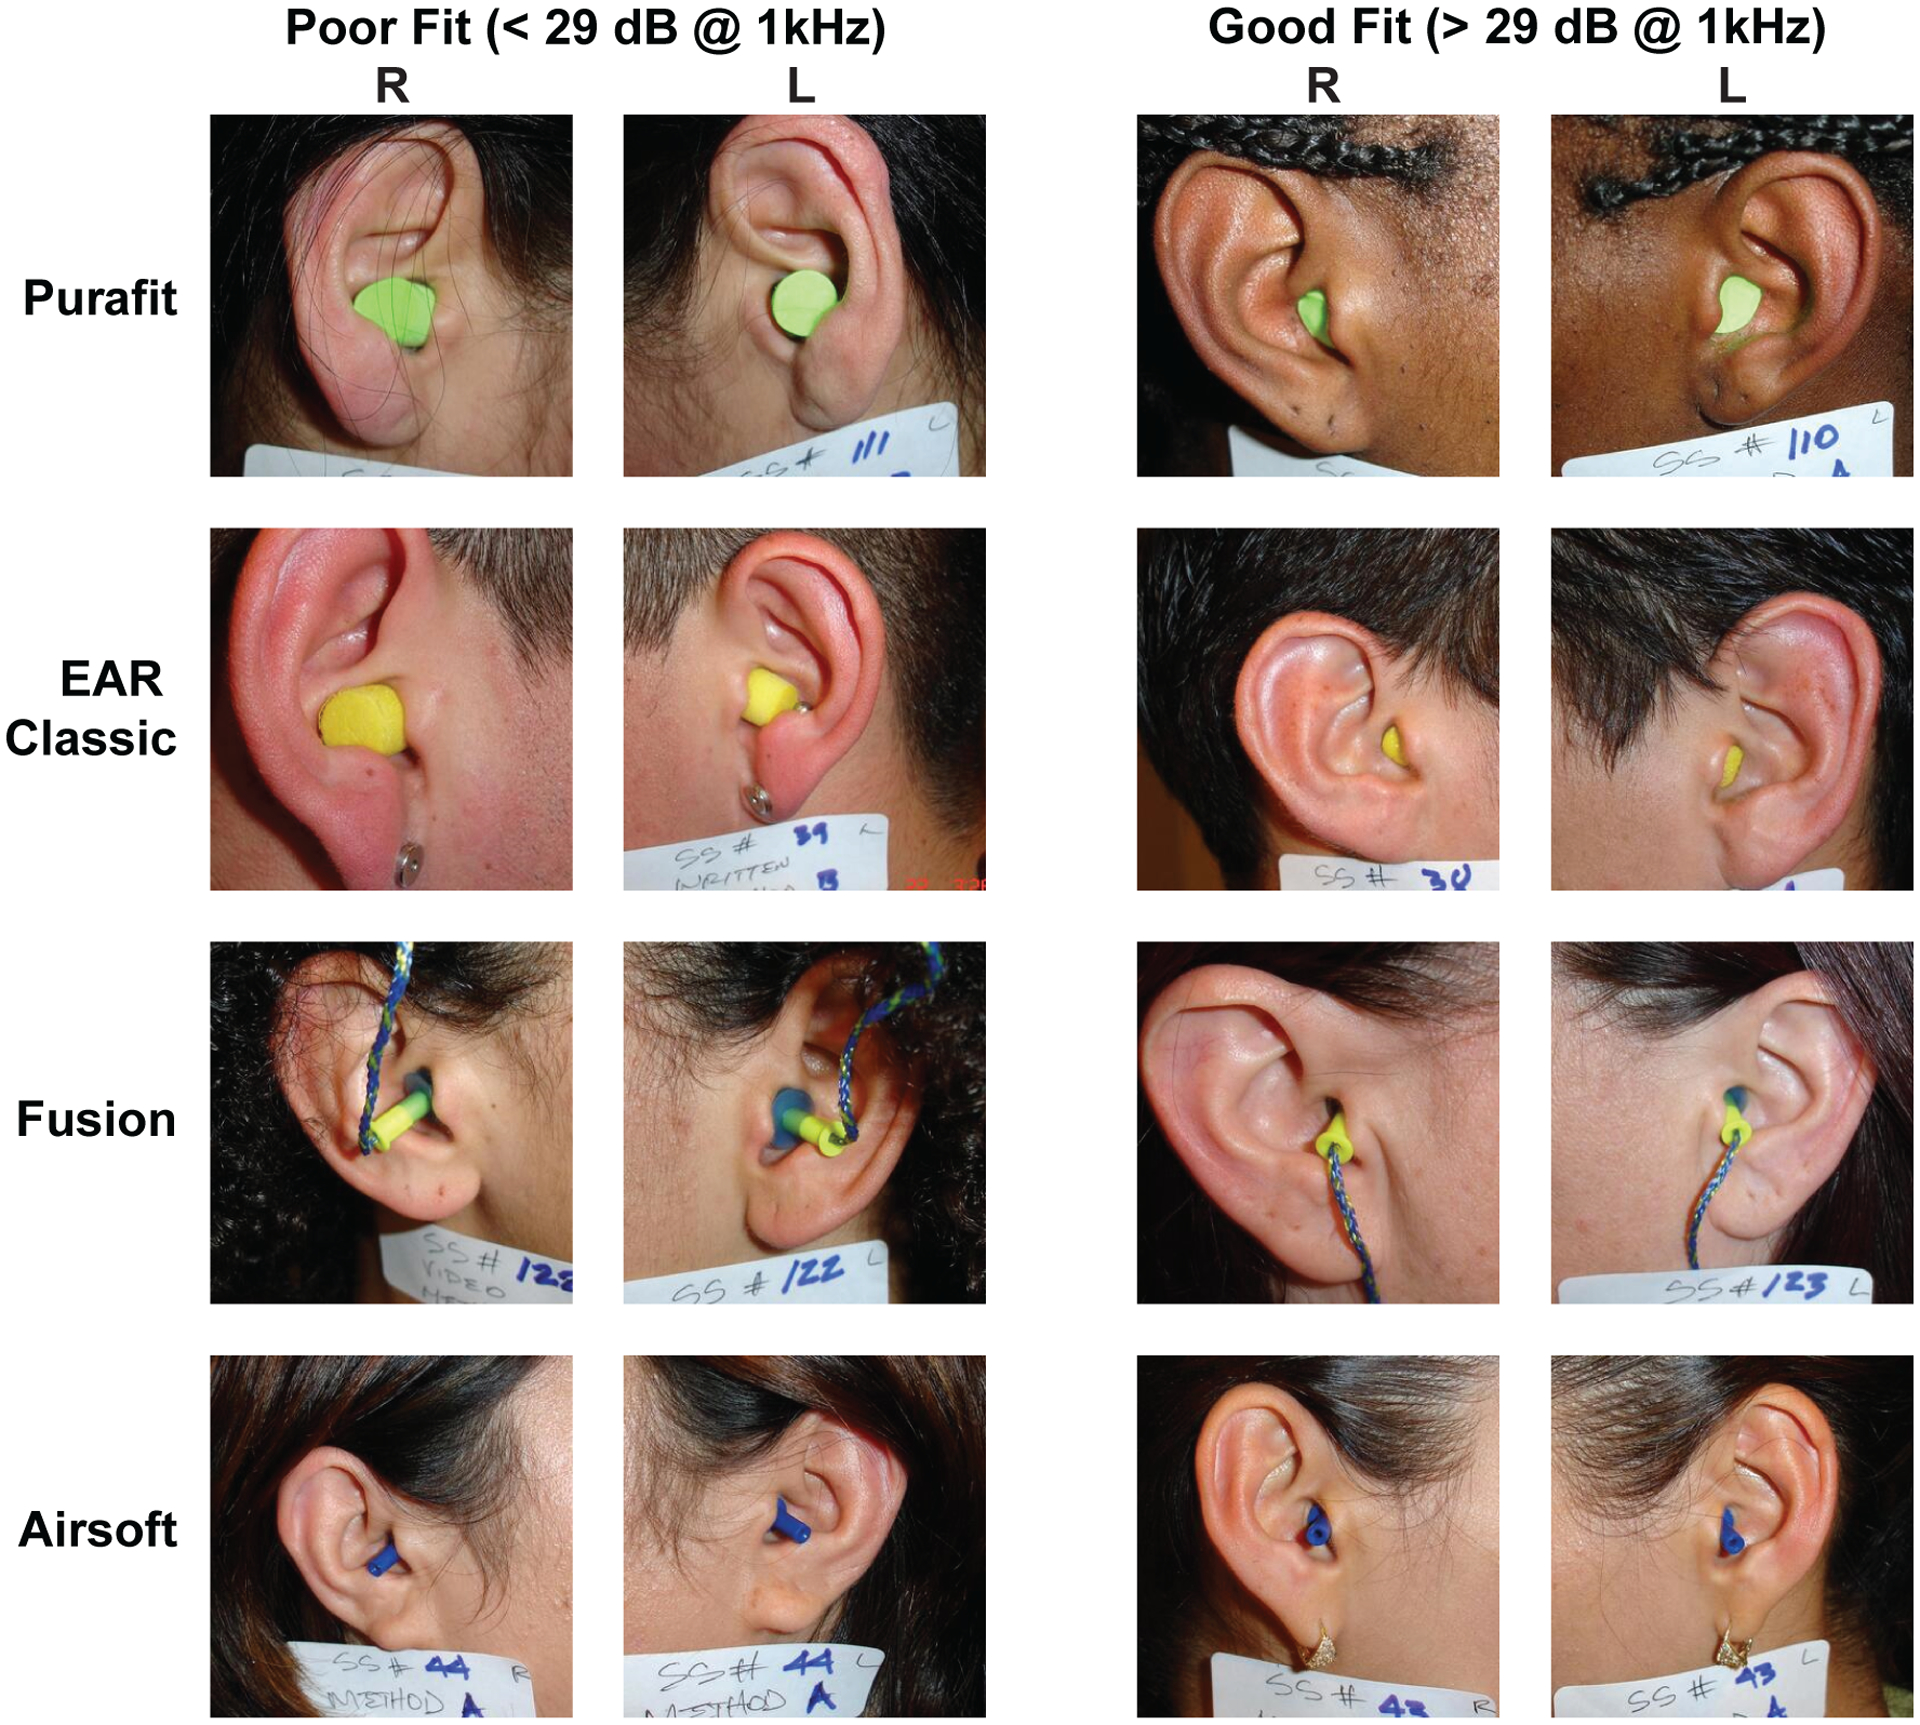
Photographs of four types hearing protection devices. The left two columns show examples of fits labeled as “bad” (<29 dB attenuation), while the right two columns show fits labeled as “good” (>29 dB attenuation)
B. Human Visual HPD Classification
As a proof of concept for quantifying hearing protection fit through visual observation, two individuals (who did not participate in the fit testing described previously) were asked to rate photographs. This process was done not as a comprehensive behavioral study, but to establish whether there is indeed information present in the images themselves related to attenuation. For a pair of hearing protectors, each participant was asked to rate them as either “good fit” or “poor fit”. The participants viewed both left and right ear images at the same time, and were instructed to rate “poor” if the fit of either ear appeared to be poor. A binary rating was used to simplify the task as much as possible. The experimental protocol for behavioral assessment of the photographs was approved by the MIT Committee on the Use of Humans as Experimental Subjects and the US Army Medical Research and Materiel Command (USAMRMC) Human Research Protection Office. All research was conducted in accordance with the relevant guidelines and regulations for human subject testing required by these committees. All individuals gave written informed consent to participate in the protocol.
C. Deep Neural Network Classification
Our hearing protector fit estimator system design employed a binary classifier, meaning that it has a 0 or 1 output, corresponding to poor fit or good fit, respectively, given an input image. A single photograph of the hearing protector fit, with dimensions of 224 by 224 pixels, was used as the input. Image preprocessing steps are provided in section II C 1.
To make classifications on an image, a deep neural network must first be trained using an iterative process, finding the optimal mapping between the input image and desired class label (“good fit”, “bad fit”) for the training data set. For a single training sample (i.e. single fit test), both the left and right ear images were passed through the DNN separately to obtain two output likelihood values (between 0–1). These scores were then averaged across the two ears before being compared against the true class label measured using REAT. We combined the two ears because the true attenuation value computed in the free field is measured simultaneously for both ears (i.e., a REAT test), rather than one ear at a time for the data used to develop our model (Murphy et al., 2011).
In this study, we compared three DNN models: two ResNet architectures and one simple convolutional architecture. All 3 networks begin with convolutional layers, which are often applied to image data due their ability to handle translations (Valueva et al., 2020) (i.e. invariant to the the location of the pixels in the image that contain the hearing protector, ear, etc.). Figure 2 summarizes the two DNN architectures of increasing computational complexity that were evaluated in this study: a simple convolutional network, and a ResNet model (Cheng et al., 2017). For a survey and tutorial of convolutional DNNs, including descriptions of rectified linear unit (ReLU), pooling, softmax, see (Sze et al., 2017). Each rectangular slice from left to right represents a single layer of the network, which has both an input and output. The size of each layer is indicated by the size of the rectangular slice, with dimensions given just above (e.g. the input image 224 pixels by 224 pixels by 3 colors). We designed our simple convolutional network to have two convolutional layers, with the idea that the non-linearity might provide more learning capability than a linear filter, while being as simple as possible. The two convolutional layers also allow for efficient data reduction before the fully connected layers. The final stage of each network is the softmax function, which returns a 0–1 likelihood that the image has a good fit.
FIG. 2.
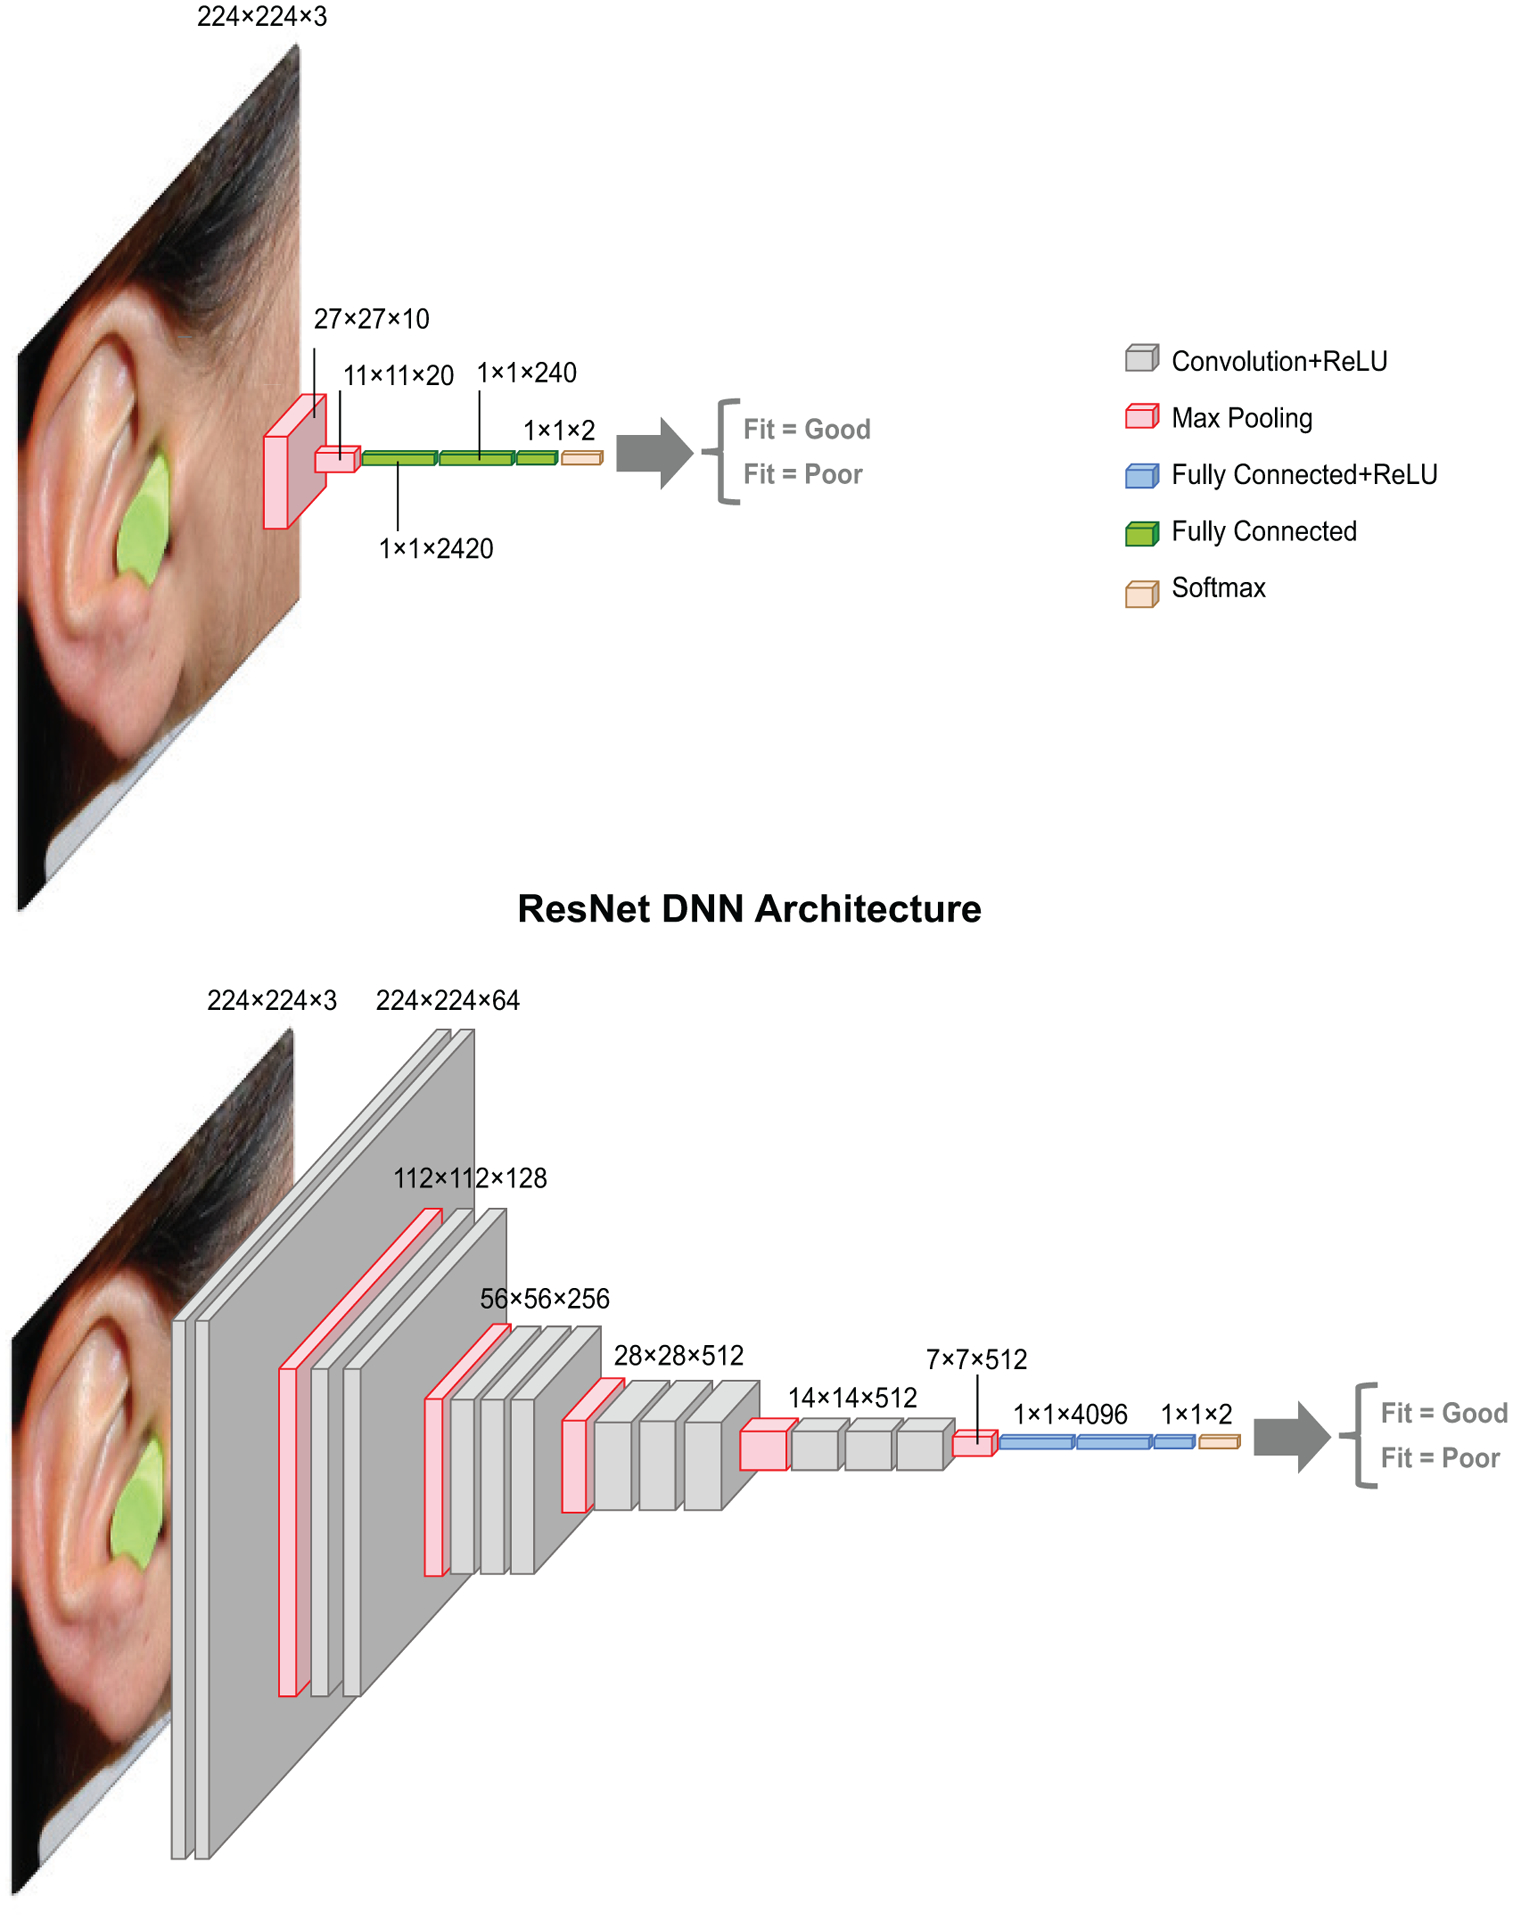
Two neural network architectures for classifying hearing protector fit based on an input image. 1. A simple convolutional neural network. 2. The ResNet architecture (shown is the ResNet18). Input is color image, and last FC layer is set to have 2 outputs: Good fit > 29dB, Poor Fit < 29dB attenuation. Each layer is labeled with the dimensionality of its input (e.g. the input image is of size 224 pixels by 224 pixels by 3 for RGB).
The ResNet model was chosen because it has shown to be successful in other image classification tasks such as the ImageNet Database (Akiba et al., 2017). Two different ResNet models (ResNet18, ResNet50) were downloaded and loaded through the Pytorch TorchVision library. The structure of the ResNet18 and ResNet50 both have 5 blocks of convolutional layers; they vary by the number of layers in each block (https://pytorch.org/hub/pytorch_vision_resnet). In our preliminary development of the algorithm, we tried initializing the networks with pretrained weights (i.e. transfer learning) as well as randomly selected weights, and found no difference in performance on our validation set. We opted to show the results for the randomized weights.
1. Image Pre-processing
Several preprocessing stages were required in order to train and test our DNN classifier. The first stage was cropping the image around the ear, as shown in Figure 1, to 256×256 pixels. This process was done manually by one of the authors, and aimed to include the entire ear if possible. Based on Figure 1, it should be evident from the sample images that this process was intentionally done without precision, simulating what a novice user might do on a smartphone camera (see Figure 7).
FIG. 7.
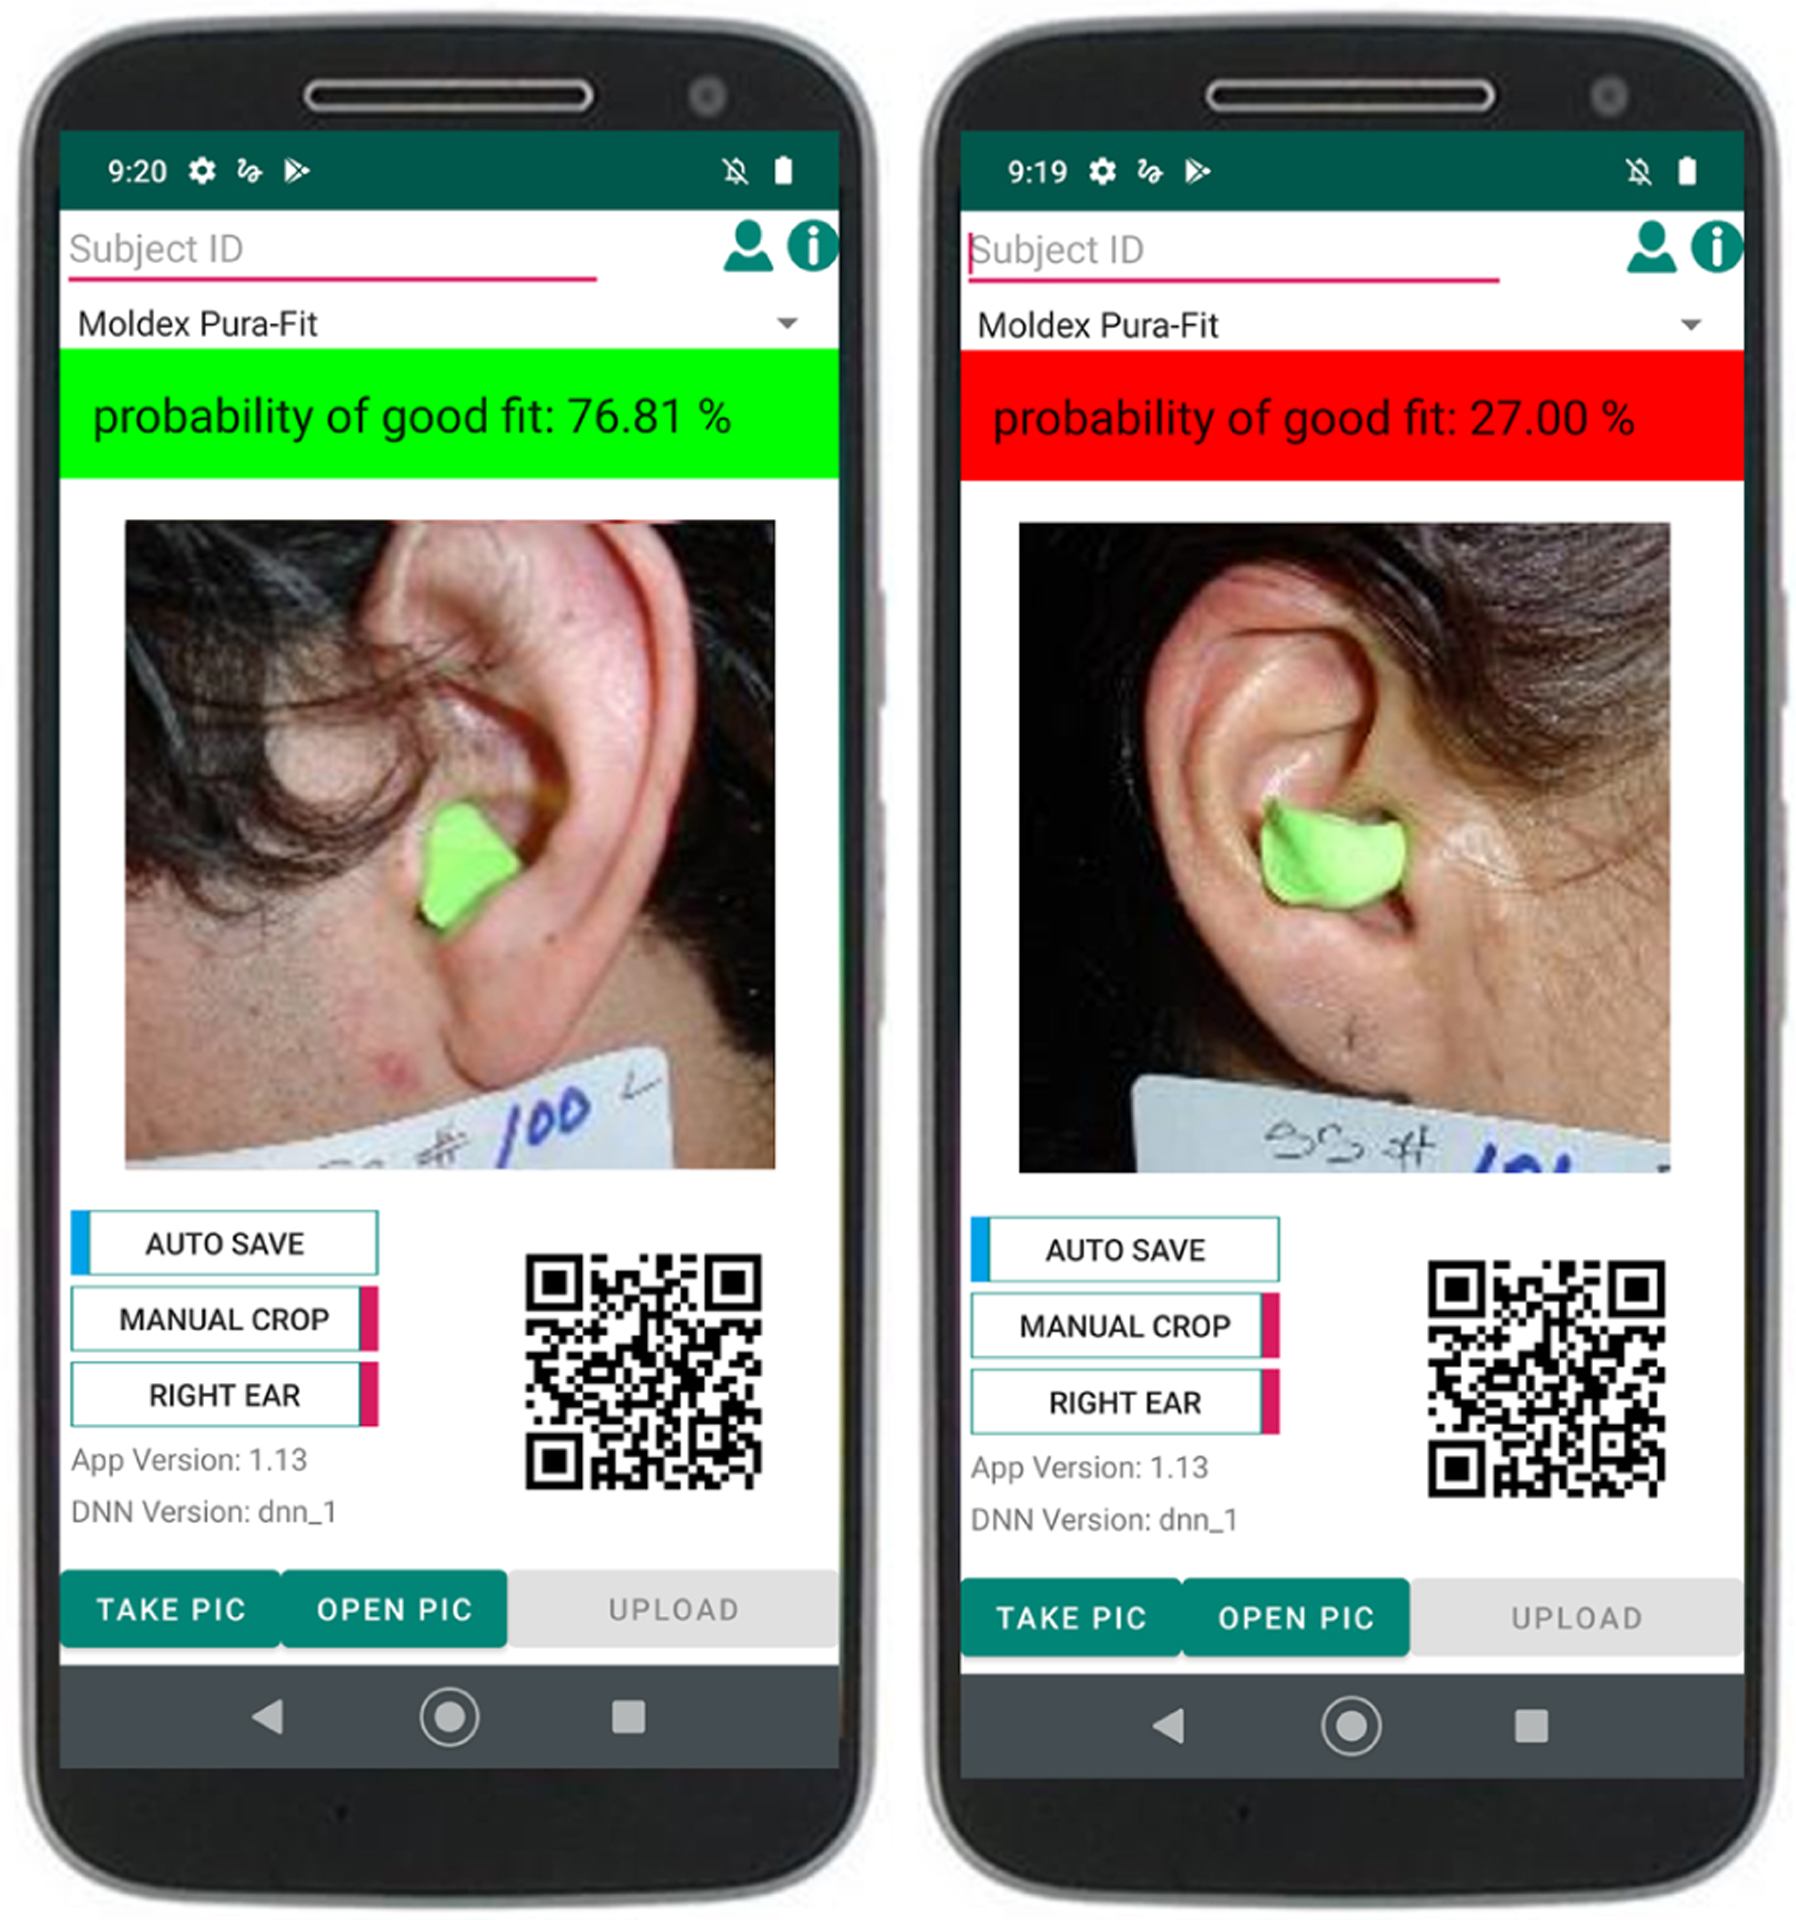
The smartphone application showing an example of a good fit correctly classified as a good fit and poor fit correctly classified as a bad fit.
Small transformations or random modifications were applied to the photographs help prevent overfitting or memorization of the training data by the network (Miko lajczyk and Grochowski, 2018). The transformations essentially add new, unique data to the training set, and were applied in the order shown in the table I. All of the transforms are commonly available in the Pytorch TorchVision Library. During the model testing phase, only normalization was applied, as well as a center crop (224 pixels from the center of the image) instead of a random crop. Three samples of the image output after the transforms are shown for two photographs in Figure 3.
TABLE I.
Table of PyTorch torchvision transforms applied in this order to the input image dataset during training. For further information see https://pytorch.org/docs/1.3.0/torchvision/transforms.html
| Torchvision Transform | Parameters |
|---|---|
| RandomRotation | degrees=10 (Uniformly chosen in range [−10 10]) |
| ColorJitter | brightness=0.05, contrast=0.05, saturation=0.01, hue=0.01 |
| RandomResizedCrop | size=224, scale=(0.6, 1.0), ratio=(0.75, 1.33), interpolation=2 |
| RandomAffine | angle=5, translate=None, scale=None, shear=5 |
| RandomHorizontalFlip | none |
| Normalize | mean =[0.485, 0.456, 0.406], std=[0.229, 0.224, 0.225] |
FIG. 3.
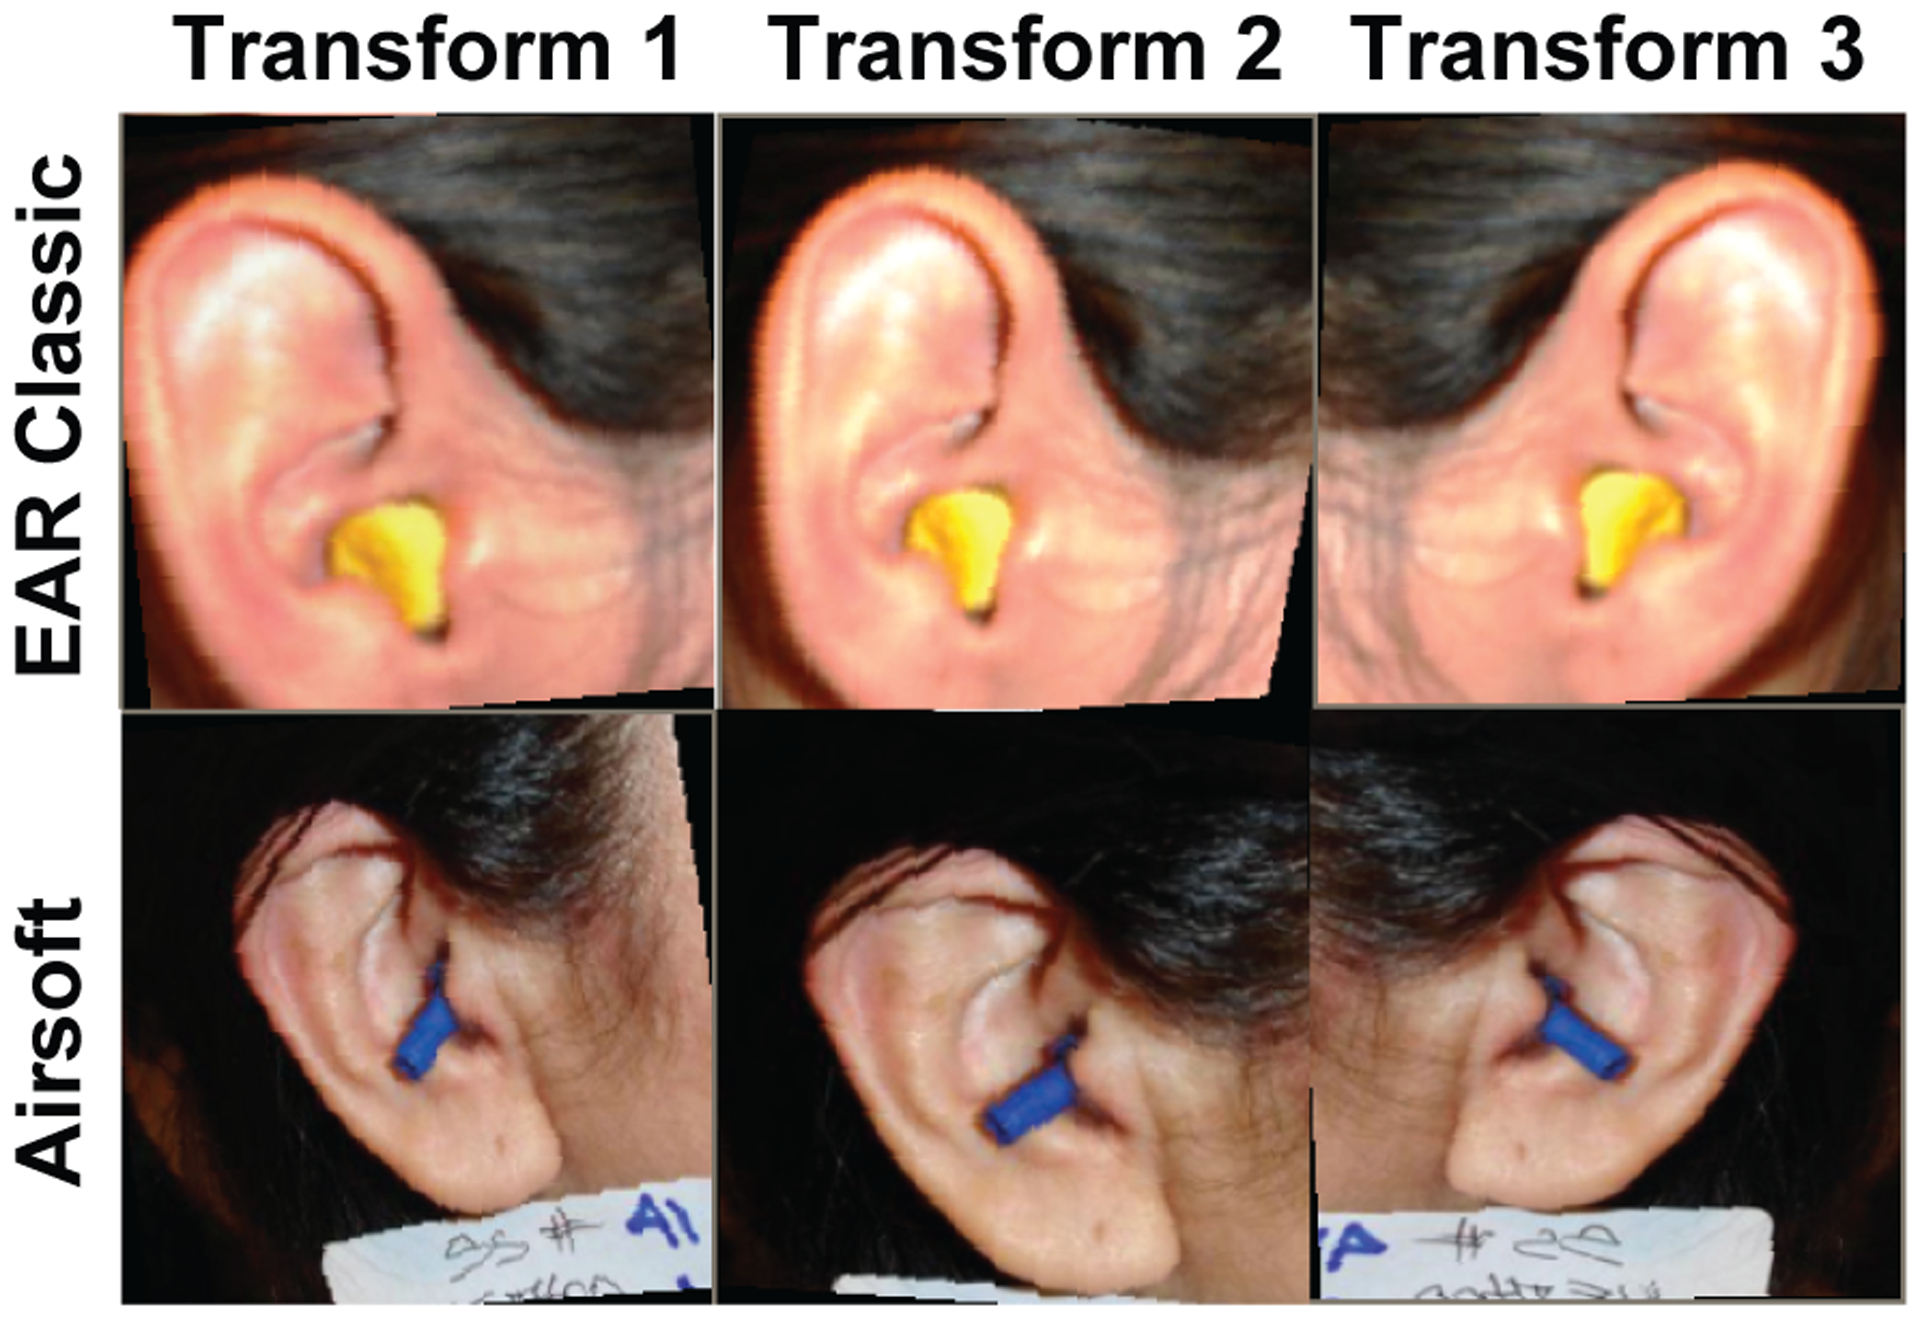
Three examples of PyTorch torchvision transformations for two sample photographs, using the parameter set from table I. The result is a slight variation in translation, rotation, brightness, and color. More easily identifiable is a horizontally flipping in Transform 3 as compared to Transform 1 and 2.
D. Training Procedure
To train our classifiers, the image data were split up into train, validation, and test sets with the ratio 70%:15%:15% respectively, for a total of 336 unique items in the train set. For cross-validation, we repeated this data splitting process 12 times (folds) using the function GroupShuffleSplit from Python’s Scikit-learn. Individual subjects were grouped together, so that no individual subject’s data were shared across training and testing. This means that when testing our network, we were testing against novel photographs and novel ears and consequently were evaluating performance on never before seen people. One training and evaluation of one of the 12 folds took approximately two minutes to complete. We used the Adam optimizer, a batch size of 32, a learning rate of 0.001, weight decay of 0.001 (see https://pytorch.org/docs/stable/generated/torch.optim.Adam.html for details), and selected the model that achieved the best accuracy on the validation set.
E. Software and Hardware Stack
Software development was done using Python 3.6.9, PyTorch 1.3.0, Torchvision 0.4.2, and Scikit-learn 0.20.3. Data were processed on a Nvidia Volta V100 GPU on the MIT Lincoln Laboratory Supercomputing Center (Reuther et al., 2018).
III. RESULTS
A. Human Classification of Hearing Protection Fit Images
Table II shows a breakdown of classification accuracy across hearing protectors in the human evaluation of fit. Both human rater participants were able to rate hearing protector fit photographs as being “good” or “poor” (greater or less than 29 dB attenuation at 1 kHz) at a rate above chance averaged across all HPDs. Participant one achieved 68% and participant two achieved 58% overall across the four hearing protector types. Performance across the hearing protectors varied, and both participants reported that the foam hearing protectors seemed easier to classify.
TABLE II.
Accuracy (Fraction Correct) for each of the three classifiers and two human participants (P1 and P2). Mean values are shown across training folds for DNN results, while standard deviations are in parenthesis.
| Classic | Purafit | Fusion | Airsoft | All | |
|---|---|---|---|---|---|
| ConvNet | 0.77 (0.10) | 0.74 (0.12) | 0.66 (0.14) | 0.72 (0.11) | 0.73 (0.05) |
| ResNet18 | 0.72 (0.12) | 0.80 (0.12) | 0.65 (0.12) | 0.73 (0.12) | 0.73 (0.04) |
| ResNet50 | 0.69 (0.14) | 0.79 (0.13) | 0.64 (0.13) | 0.73 (0.13) | 0.71 (0.06) |
| P1 | 0.57 | 0.78 | 0.68 | 0.70 | 0.68 |
| P2 | 0.64 | 0.70 | 0.49 | 0.49 | 0.58 |
Characterizing only the accuracy of ratings can be misleading however, because it assumes the participant is able to infer the arbitrary cut-off point of 29 dB just through visual inspection. An alternative analysis was performed using the Receiver Operating Characteristic (ROC) curve as follows. The score from the human rater is a binary outcome variable and the true attenuation is a continuous variable. If we binarize the truth data (attenuation) at various thresholds, we can see the performance of the human at that threshold, rather than picking a fixed cut-off. Looking at the extreme cases, if we binarize the fit data at 0 dB attenuation, then all the true labels are “good fit”, and the person will then register some labels as good and some bad (approximately half). Consequently we compute a sensitivity score of 50%, and a false alarm of 0% (since all protectors are good, we cannot have false positives). The opposite is true if we binarize at a high attenuation, e.g., 50 dB. The ROC curve allows us to find the point at which the human raters are intuitively tracking at the threshold between good fit and poor fit. This threshold is the point at which the ROC curve is farthest to the upper left. In general, the total Area Under the Curve (AUC) is a proxy for how much informative detail exists in the images for performing classification.
Figure 4 shows the ROC curves for the two participants. They achieved an overall AUC of 0.72 and 0.60 respectively, where the maximum possible AUC is 1. The human rater most experienced at working with hearing protection achieved good classification across all hearing protectors, while the second human rater achieved good performance on all but the Fusion HPD. These results suggest that there is useful information in the images hearing protector that can be leveraged in an automated system through machine learning. A summary of the AUC as a function of hearing protector is shown in Table III.
FIG. 4.
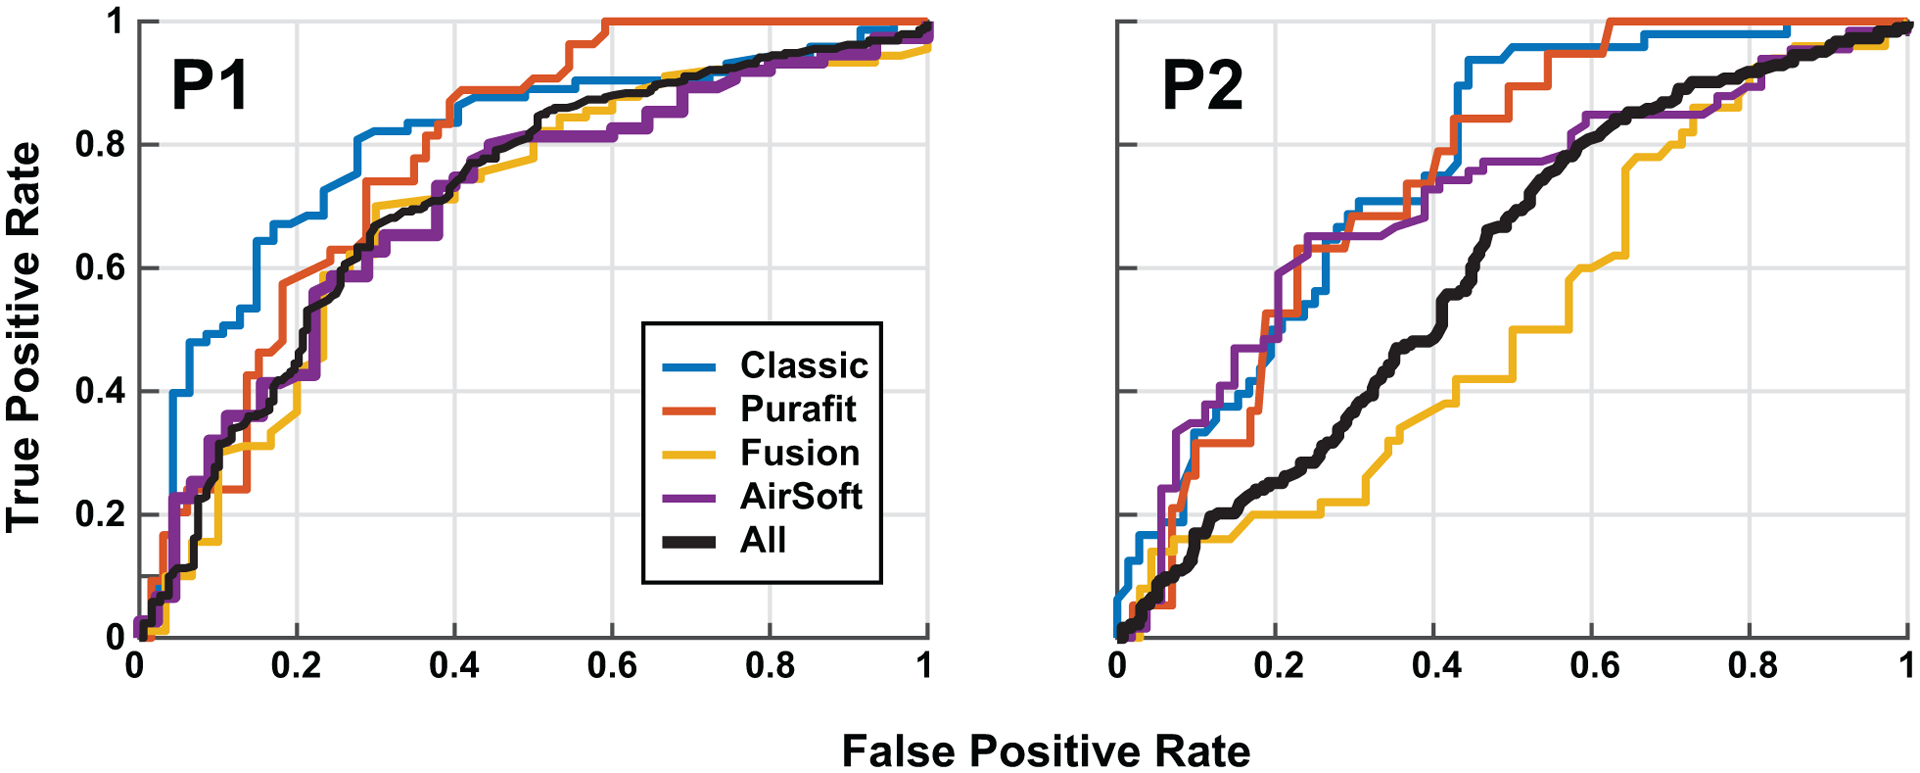
ROC curves for human binary classification of hearing protector fit (good, poor) given the attenuation of that hearing protector. Each panel shows the ROC curve for one subject across hearing protectors, across a total of 480 pairs of photographs. Human rater 1 (P1, left) performed well on all hearing protectors, while human rater 2 (P2, right) performed worse with the Fusion HPD.
TABLE III.
Table of ROC Area under the Curve (AUC) for each of the three classifiers and the two human raters (P1 and P2). Mean values are shown across training folds for DNN results, while standard deviations are in parenthesis.
| Classic | Purafit | Fusion | Airsoft | All | |
|---|---|---|---|---|---|
| ConvNet | 0.76 (0.14) | 0.70 (0.18) | 0.67 (0.16) | 0.69 (0.19) | 0.74 (0.06) |
| ResNet18 | 0.69 (0.19) | 0.81 (0.16) | 0.67 (0.16) | 0.69 (0.19) | 0.75 (0.07) |
| ResNet50 | 0.62 (0.24) | 0.74 (0.18) | 0.65 (0.22) | 0.70 (0.14) | 0.73 (0.08) |
| P1 | 0.80 | 0.78 | 0.70 | 0.70 | 0.72 |
| P2 | 0.76 | 0.75 | 0.52 | 0.71 | 0.60 |
B. Neural Network Classifier
Figure 5 shows the ROC curves produced on the held-out validation sets for each of the three DNN architectures. These ROC curves represent an average across all hearing protectors, as well as across the 12 cross-validation training folds. The ResNet18 model produced the highest AUC of 0.75, slightly higher than the ResNet50 (AUC=0.73), and Simple Convnet (AUC = 0.74). A repeated-measures ANOVA with main effects of Fold and Model Type, revealed no significant difference between the AUCs of the 3 model types (F = 0.6, p = 0.55).
FIG. 5.
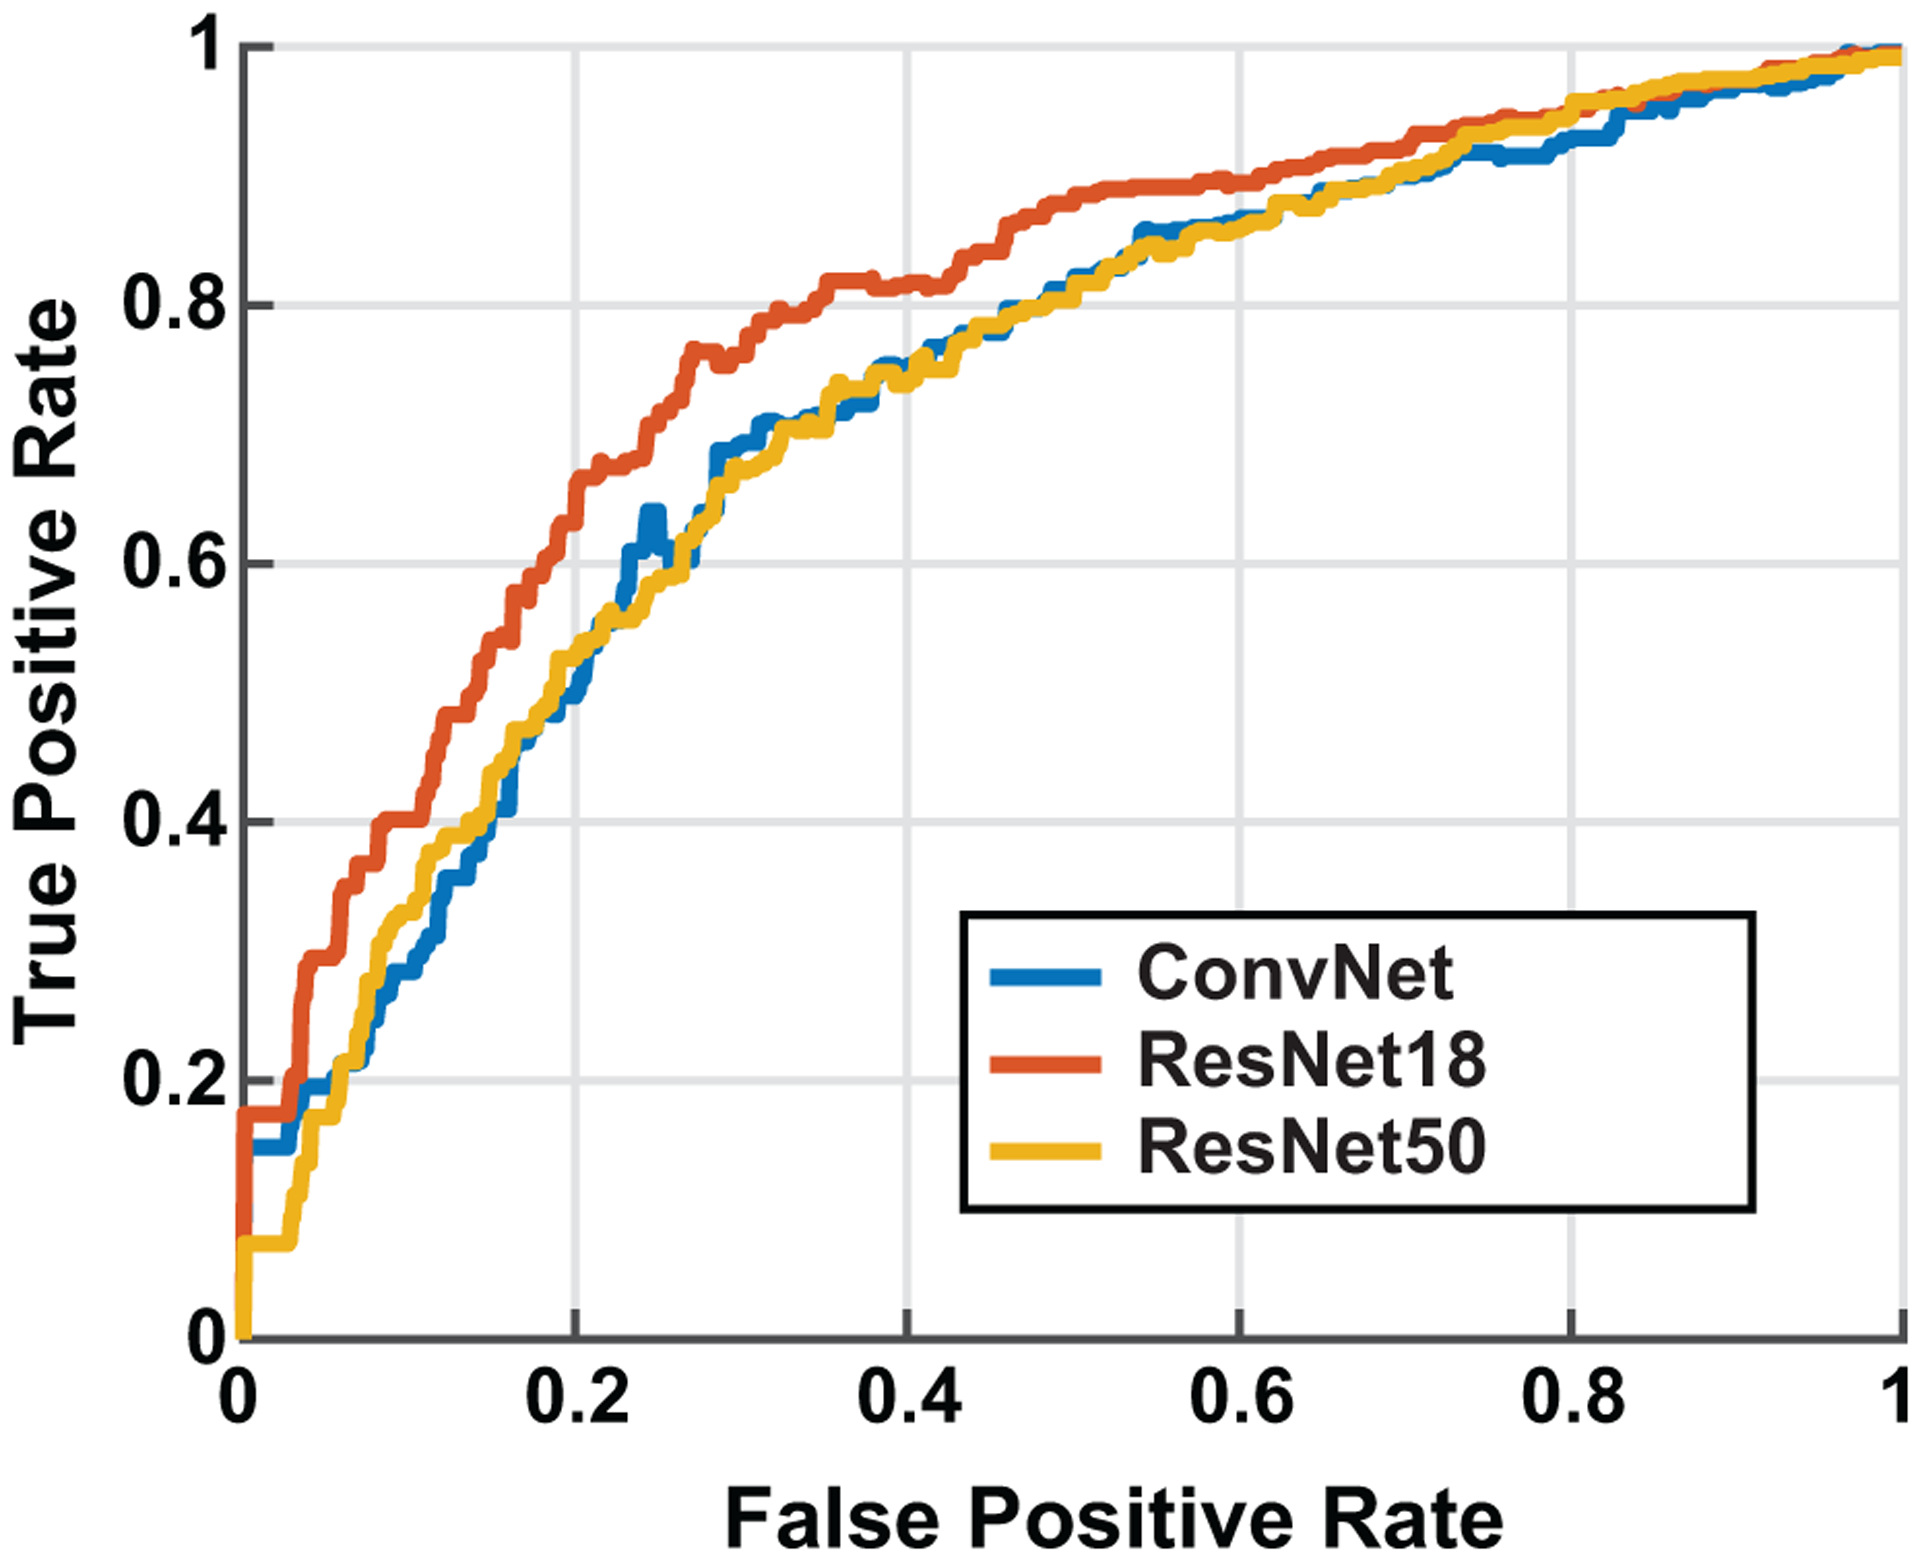
Receiver operating characteristic curve for the three Neural Network architectures. The ResNet18 network performed best overall with AUC=0.75.
Figure 6 shows ROC curves for each hearing protector individually using the ResNet18 model since it was the highest performing overall. A repeated-measures ANOVA found a significant difference between hearing protectors (F = 5.9, p = 0.0001). Tukey post-hoc comparisons revealed that the Purafit HPD was significantly better than the Fusion HPD (p < 0.04). The mean and standard deviation of the AUCs for all 3 models are shown in Table III.
FIG. 6.
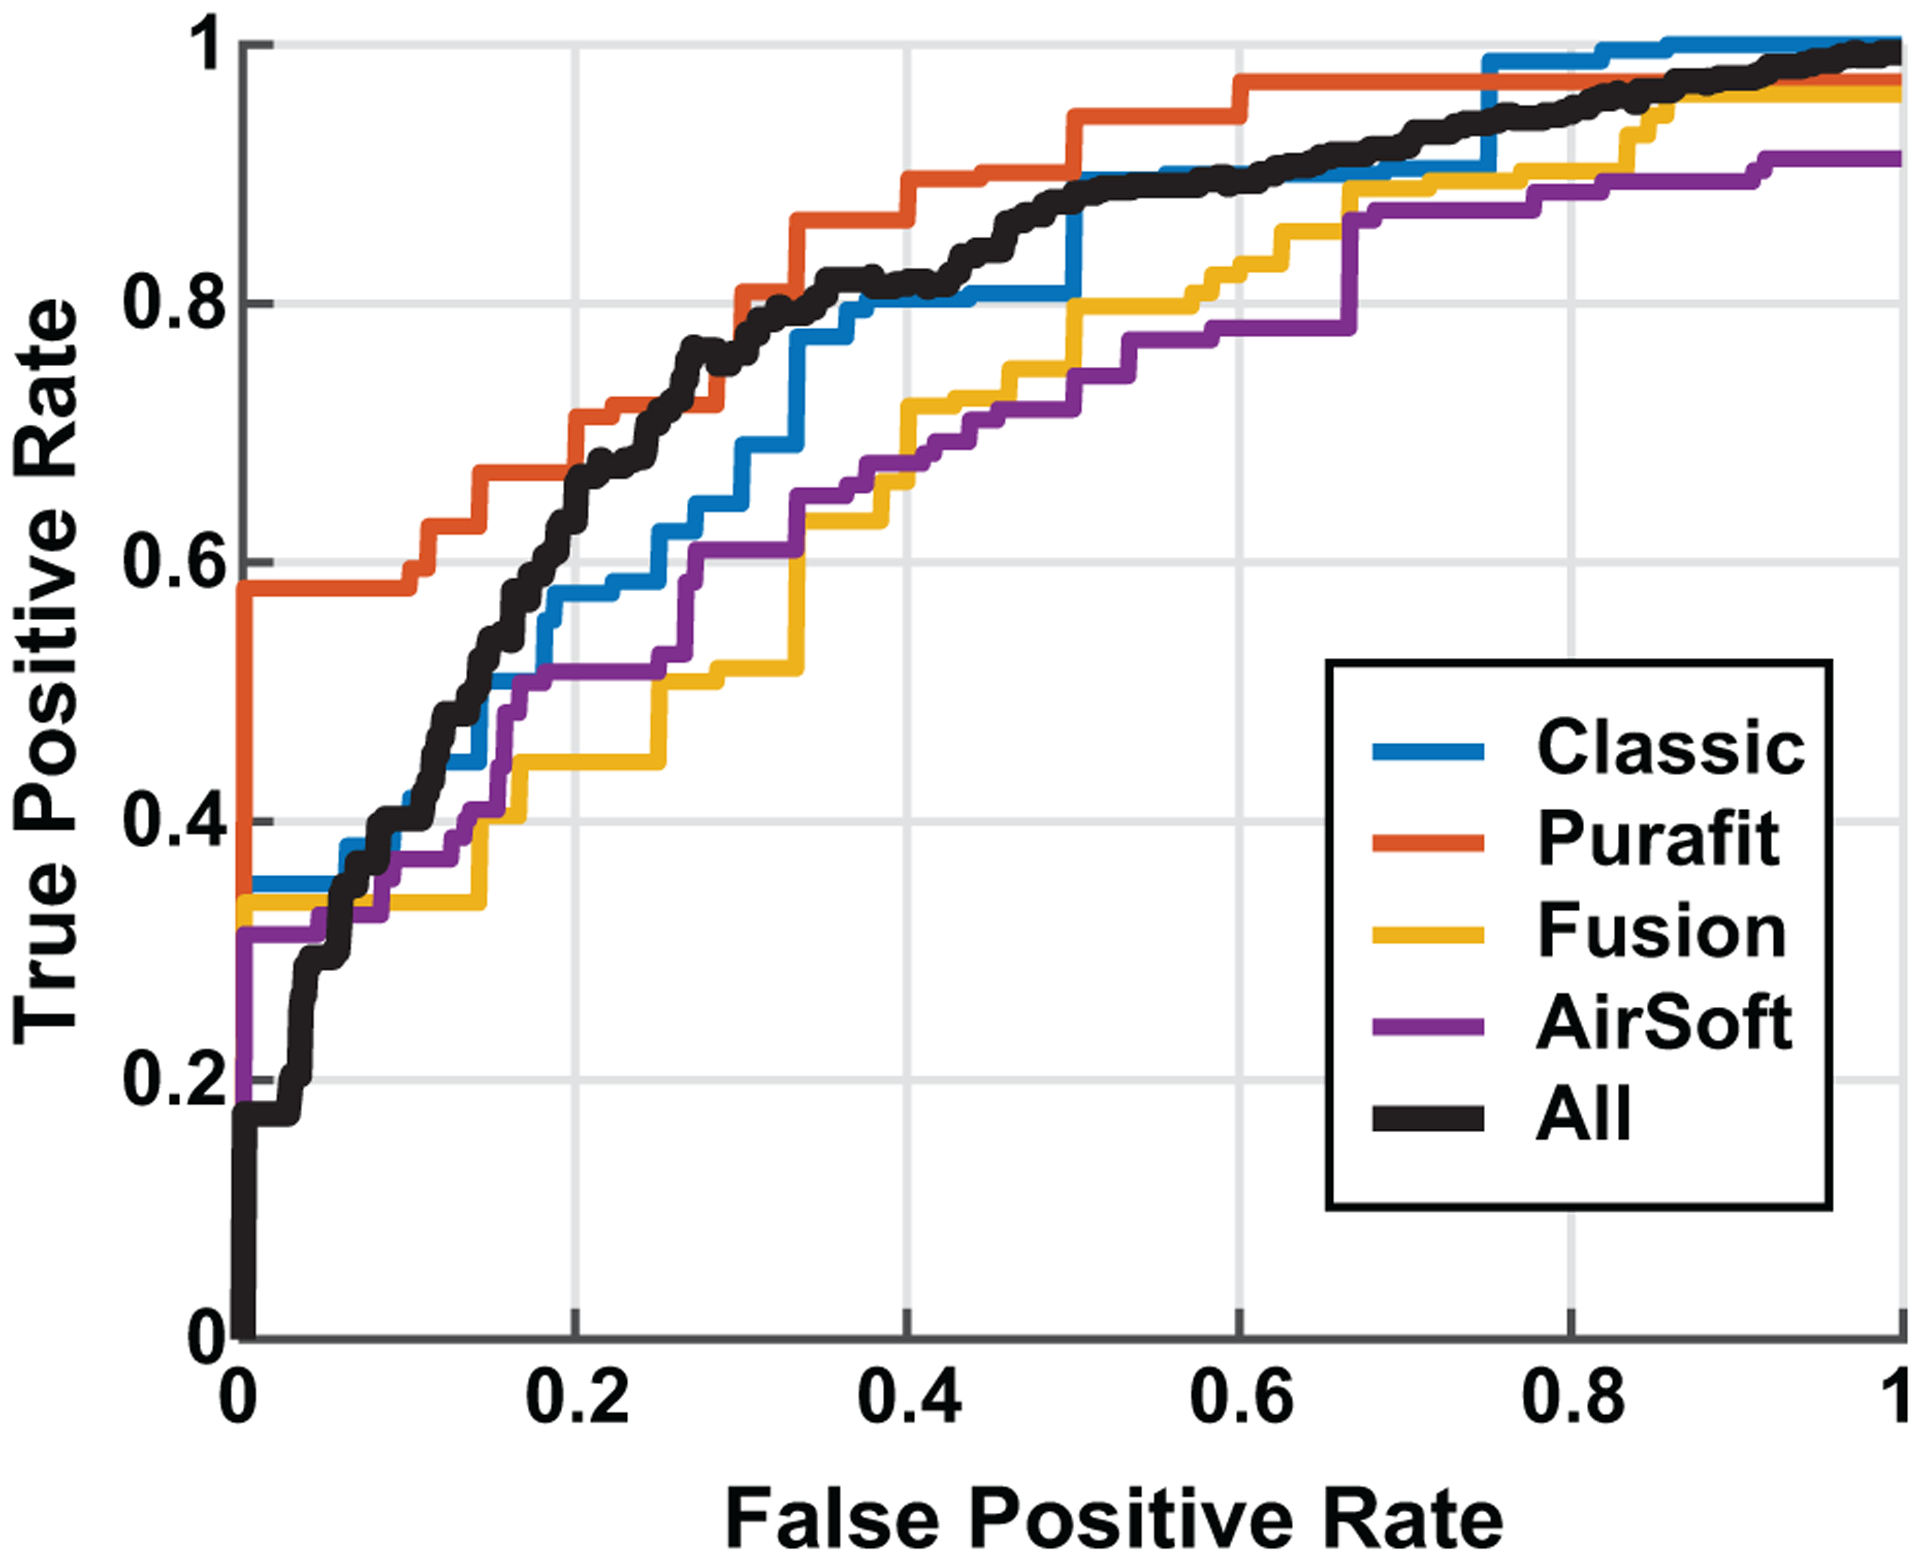
Receiver operating characteristic curve for the ResNet18 Network architecture, as a function of each hearing protector.
IV. DISCUSSION
Overall, our results show promise for image-based fit classification of HPD attenuation. Surprisingly, we found little difference in the performance between the three DNN classification models compared in this study. A major factor in the lack of varying model performance is likely due to the database size, and how quickly the models can overfit on the training data (see IV B). It was also unexpected that there was little benefit to using a pre-trained network (transfer learning). The following sections discuss the applications, considerations, and future work for this system.
A. Hearing Conservation and Safety Applications
One obvious application of this photograph-based fit system is to perform a quick check of hearing protection fit just before noise exposure, or at the start of the work day for those enrolled in hearing conservation programs. While portable audiometric-based fit check systems could serve this purpose, we see an image based classifier as complementary because of its speed, taking only a few seconds to employ, and could be completely automated.
An example application might be at a gun-range where noise exposure risk is quite high. An automated system could detect in-real time if individuals are in compliance with safety regulations at the range. This could also apply to industrial environments.
A second application of our system is as a training tool. Several studies have indicated that hearing protection training is critical to achieving good attenuation. We propose that a smartphone app that uses our system could provide feedback to the user when the user is establishing a good fit.
One potential concern over using visual inspection for fit testing is the potential for false positives, or cases when the fit looks good, but it is really not. A related problem is that individual variability in ear-canal shape and size would likely impact the ability of our algorithm accuracy. Our system is not intended to replace other fit check systems, but rather supplement them and find obvious cases. For that reason, we did not attempt to do regression, predicting the actual dB attenuation value. Instead we limited ourselves to binary classification. To overcome the potential ear-canal size variability, future studies might include on-occluded baseline images for each subject that include a fixed size reference (e.g. a ruler).
Using the ROC curve, the operating point of the system can be set to reduce the impact of false positives. For example, in Figure 6, if we set the system at a false positive rate of 0, the system still has 60% accuracy for the Purafit HPD. Slightly less conservative operating points may be taken in the future as overall system performance is likely to improve with additional data.
B. Model Generalization
The number of images and hearing protectors used in this study is quite low as compared to some neural network studies that use millions of images. A challenge across all machine learning approaches is generalization of the model to new datasets and conditions. In this case, all the photographs were taken in a single laboratory, with specific lighting conditions, and on the same camera. The image augmentation transformations applied to the images as shown in Figure 3 will likely help with this issue, but further data are needed under other conditions to truly assess generalization.
A second generalization goal is for the system to work on other hearing protectors, and potentially even ones that it has not been trained on. Anecdotal testing by the authors has shown some potential promise at predicting other styles of insert HPDs, but further formal evaluation is required.
One potential issue with our fit predictions is that we did not use the personal attenuation rating (PAR) as the label for each hearing protector image. We opted to use a single frequency instead of averaging across multiple frequencies that is typically done in hearing protection fit-testing. We did compare our results using a single frequency with the average across all frequencies and did not find a significant change in the classifier performance.
There are several features that could be added in the future to improve the robustness and usefulness of the system. A first feature is the ability to detect if a hearing protector is in the image at all, or if the picture even contains an ear. This would help reduce or filter out images in an online system that are not relevant, and could also be helpful in processing video data (for real-time compliance monitoring applications). A second feature could be to detect if no hearing protector is present in the image, and just the open ear is present. This could be an extremely useful feature in a surveillance mode (for example at a gun range, where hearing protection is generally required). Finally, it could be beneficial to detect which hearing protector is being used, or if it is an unknown hearing protector, to warn the user that the estimate may be less accurate.
Fortunately, adding new hearing protectors to the database should be relatively simple, especially with use of portable audiometric fit check systems. For future studies, training on single ear data, rather than the free field two ear fit data used in this study, is likely to improve the quality of the training data, and is another way performance could be improved. Other variations also might prove to increase model performance, including reference photographs of the either the HPD, the individuals unoccluded ear, or both.
C. Smartphone Implementation
We exported our trained ResNet18 model and developed an Android app that can take a photograph and run that model. A crop tool automatically opens up after the image is taken for the user to select a square region (which is required for the model input). A screenshot of the current smartphone application is shown in Figure 7, where a good and bad fit are shown. This may allow the model to calibrate for the relative size of the ear and HPD, and even account for individual subject variation in the ear canal itself (Benacchio et al., 2016).
V. CONCLUSIONS
In this study, we evaluated the feasibility of estimating hearing protection fit visually, and developed an automatic binary image classifier using a deep neural network. We achieved 73% classification accuracy overall with our selected model, the ResNet18, for determining if the fit was greater or less than the median measured attenuation (29 dB at 1 kHz). Ultimately, this algorithm could be used as part of a smartphone app for training as well as for automated compliance monitoring in noisy environments for preventing hearing loss.
ACKNOWLEDGMENTS
DISTRIBUTION STATEMENT A. Approved for public release. Distribution is unlimited. This material is based upon work supported by the Department of the Navy under Air Force Contract No. FA8702-15-D-0001. Any opinions, findings, conclusions or recommendations expressed in this material are those of the author(s) and do not necessarily reflect the views of the Department of the Navy, Department of Defense, National Institute for Occupational Safety and Health (NIOSH), Centers for Disease Control and Prevention (CDC), nor the United States Government. Mention of any company product does not constitute endorsement by the Navy, DoD, NIOSH, CDC, or the government.
VI. REFERENCES
- Akiba T, Suzuki S, and Fukuda K (2017). “Extremely large minibatch SGD: Training Resnet-50 on ImageNet in 15 minutes,” arXiv preprint arXiv:1711.04325. [Google Scholar]
- ANSI/ASA (2008). ANSI S12.6–2008: Method for the Measurement of the Real-Ear Attenuation of Hearing Protectors. (ANSI New York; ). [Google Scholar]
- ANSI/ASA (2018). ANSI S12.71–2018: Performance Criteria for Systems that Estimate the Attenuation of Passive Hearing Protectors for Individual Users. (ANSI New York; ). [Google Scholar]
- Benacchio S, Varoquaux A, Wagnac E, Doutres O, Callot V, Bendahan D, and Sgard F (2016). “Ear canal deformations by various earplugs: An in situ investigation using MRI,” Canadian Acoustics 44(3). [Google Scholar]
- Berger E (1996). Scientific basis of noise-induced hearing loss. International review of field studies of hearing protector attenuation (Thieme Medical Publishers; ), pp. 361–377. [Google Scholar]
- Biabani A, Aliabadi M, Golmohammadi R, and Farhadian M (2017). “Individual fit testing of hearing protection devices based on Microphone in Real Ear,” Safety and health at work 8(4), 364–370. [DOI] [PMC free article] [PubMed] [Google Scholar]
- Cheng X, Zhang Y, Chen Y, Wu Y, and Yue Y (2017). “Pest identification via deep residual learning in complex background,” Computers and Electronics in Agriculture 141, 351–356. [Google Scholar]
- Cichy RM, Khosla A, Pantazis D, Torralba A, and Oliva A (2016). “Comparison of deep neural networks to spatio-temporal cortical dynamics of human visual object recognition reveals hierarchical correspondence,” Scientific reports 6, 27755. [DOI] [PMC free article] [PubMed] [Google Scholar]
- Copelli F, Behar A, Le TN, and Russo FA (2021). “Field attenuation of foam earplugs,” Safety and health at work 12(2), 184–191. [DOI] [PMC free article] [PubMed] [Google Scholar]
- Davis SK, Calamia PT, Murphy WJ, and Smalt CJ (2019). “In-ear and on-body measurements of impulse-noise exposure,” International journal of audiology 58(sup1), S49–S57. [DOI] [PubMed] [Google Scholar]
- Federman J, Karch SJ, and Duhon C (2020). “How hearing conservation training format impacts personal attenuation ratings in US Marine Corps training recruits,” International Journal of Audiology 1–9. [DOI] [PubMed] [Google Scholar]
- Hager LD et al. (2011). “Fit-testing hearing protectors: An idea whose time has come,” Noise and Health 13(51), 147. [DOI] [PubMed] [Google Scholar]
- Hecht QA, Hammill TL, Calamia PT, Smalt CJ, and Brungart DS (2019). “Characterization of acute hearing changes in United States military populations,” The Journal of the Acoustical Society of America 146(5), 3839–3848. [DOI] [PubMed] [Google Scholar]
- Lee K, and Casali JG (2017). “Development of an auditory situation awareness test battery for advanced hearing protectors and TCAPS: detection subtest of DRILCOM (detection-recognition/identification-localization-communication),” International journal of audiology 56(sup1), 22–33. [DOI] [PubMed] [Google Scholar]
- Lu L, Zheng Y, Carneiro G, and Yang L (2017). “Deep learning and convolutional neural networks for medical image computing,” Advances in Computer Vision and Pattern Recognition. [Google Scholar]
- Michael PL, Kerlin RL, Bienvenue G, Prout J, and Shampan J (1976). “A real-ear field method for the measurement of the noise attenuation of insert-type hearing protectors,” Technical Report 76–181. [Google Scholar]
- Miko lajczyk A, and Grochowski M (2018). “Data augmentation for improving deep learning in image classification problem,” in 2018 international interdisciplinary PhD workshop (IIPhDW), IEEE, pp. 117–122. [Google Scholar]
- Murphy WJ, Stephenson MR, Byrne DC, Witt B, Duran J et al. (2011). “Effects of training on hearing protector attenuation,” Noise and Health 13(51), 132. [DOI] [PubMed] [Google Scholar]
- Murphy WJ, Themann CL, and Murata TK (2016). “Hearing protector fit testing with off-shore oil-rig inspectors in Louisiana and Texas,” International journal of audiology 55(11), 688–698. [DOI] [PMC free article] [PubMed] [Google Scholar]
- Reuther A, Kepner J, Byun C, Samsi S, Arcand W, Bestor D, Bergeron B, Gadepally V, Houle M, Hubbell M et al. (2018). “Interactive supercomputing on 40,000 cores for machine learning and data analysis,” in 2018 IEEE High Performance extreme Computing Conference (HPEC), IEEE, pp. 1–6. [Google Scholar]
- Schulz TY et al. (2011). “Individual fit-testing of earplugs: A review of uses,” Noise and Health 13(51), 152. [DOI] [PubMed] [Google Scholar]
- Smalt CJ, Calamia PT, Dumas AP, Perricone JP, Patel T, Bobrow J, Collins PP, Markey ML, and Quatieri TF (2020). “The effect of hearing-protection devices on auditory situational awareness and listening effort,” Ear and Hearing 41(1), 82–94. [DOI] [PubMed] [Google Scholar]
- Sze V, Chen Y-H, Yang T-J, and Emer JS (2017). “Efficient processing of deep neural networks: A tutorial and survey,” Proceedings of the IEEE 105(12), 2295–2329. [Google Scholar]
- Szegedy C, Toshev A, and Erhan D (2013). “Deep neural networks for object detection,” Advances in neural information processing systems 26, 2553–2561. [Google Scholar]
- Tak S, Davis RR, and Calvert GM (2009). “Exposure to hazardous workplace noise and use of hearing protection devices among US workers-NHANES, 1999–2004,” American journal of industrial medicine 52(5), 358–371. [DOI] [PubMed] [Google Scholar]
- Valueva MV, Nagornov N, Lyakhov PA, Valuev GV, and Chervyakov NI (2020). “Application of the residue number system to reduce hardware costs of the convolutional neural network implementation,” Mathematics and Computers in Simulation 177, 232–243. [Google Scholar]
- Voix J, and Hager LD (2009). “Individual fit testing of hearing protection devices,” International Journal of Occupational Safety and Ergonomics 15(2), 211–219. [DOI] [PubMed] [Google Scholar]
- Voix J, Hager LD, and Zeidan J (2006). “Experimental validation of the objective measurement of individual earplug field performance,” Acta Acustica united with Acustica 92. [Google Scholar]
- Voix J, Smith P, and Berger E (2020). “Field fit-testing and attenuation-estimation procedures,” The Noise Manual. 6th ed. Fairfax (VA): American Industrial Hygiene Association. [Google Scholar]
- Yankaskas K, Hammill T, Packer M, and Zuo J (2017). “Auditory injury-a military perspective.,” Hearing research 349, 1. [DOI] [PubMed] [Google Scholar]
- Zhang C, and Zhang Z (2014). “Improving multiview face detection with multi-task deep convolutional neural networks,” in IEEE Winter Conference on Applications of Computer Vision, IEEE, pp. 1036–1041. [Google Scholar]