

This cohort study describes longitudinal tau positron emission tomography findings using [18F]RO948 across the different clinical stages of Alzheimer disease.
Key Points
Question
Which biomarkers best predict longitudinal tau accumulation at different clinical stages of Alzheimer disease?
Findings
In this cohort study of 343 participants including amyloid-β–positive individuals who were cognitively unimpaired or had mild cognitive impairment, the largest annual increase in [18F]RO948 tau positron emission tomography (PET) was seen across the entorhinal cortex, hippocampus, and amygdala and in temporal cortical regions, respectively. In a power analysis, plasma phosphorylated tau217 with tau PET at baseline in stage I and II, respectively, resulted in sample size reductions.
Meaning
In trials using tau PET as a main outcome, plasma phosphorylated tau217 with tau PET may prove optimal for enrichment in both preclinical and prodromal Alzheimer disease.
Abstract
Importance
There is currently no consensus as to which biomarkers best predict longitudinal tau accumulation at different clinical stages of Alzheimer disease (AD).
Objective
To describe longitudinal [18F]RO948 tau positron emission tomography (PET) findings across the clinical continuum of AD and determine which biomarker combinations showed the strongest associations with longitudinal tau PET and best optimized clinical trial enrichment.
Design, Setting, and Participants
This longitudinal cohort study consecutively enrolled amyloid-β (Aβ)–negative cognitively unimpaired (CU) participants, Aβ-positive CU individuals, Aβ-positive individuals with mild cognitive impairment (MCI), and individuals with AD dementia between September 2017 and November 2020 from the Swedish BioFINDER-2 (discovery cohort) and BioFINDER-1 (validation cohort) studies.
Exposures
Baseline plasma and cerebrospinal fluid Aβ42/Aβ40, tau phosphorylated at threonine-217 (p-tau217), p-tau181 and neurofilament light, magnetic resonance imaging, amyloid PET ([18F]flutemetamol), and tau PET ([18F]RO948 in the BioFINDER-2 study; [18F]flortaucipir in the BioFINDER-1 study).
Main Outcomes and Measures
Baseline tau PET standardized uptake value ratio (SUVR) and annual percent change in tau PET SUVR across regions of interest derived using a data-driven approach combining clustering and event-based modeling. Regression models were used to examine associations between individual biomarkers and longitudinal tau PET and to identify which combinations best predicted longitudinal tau PET. These combinations were then entered in a power analysis to examine how their use as an enrichment strategy would affect sample size in a simulated clinical trial.
Results
Of 343 participants, the mean (SD) age was 72.56 (7.24) years, and 157 (51.1%) were female. The clustering/event-based modeling–based approach identified 5 regions of interest (stages). In Aβ-positive CU individuals, the largest annual increase in tau PET SUVR was seen in stage I (entorhinal cortex, hippocampus, and amygdala; 4.04% [95% CI, 2.67%-5.32%]). In Aβ-positive individuals with MCI and with AD dementia, the greatest increases were seen in stages II (temporal cortical regions; 4.45% [95% CI, 3.41%-5.49%]) and IV (certain frontal regions; 5.22% [95% CI, 3.95%-6.49%]), respectively. In Aβ-negative CU individuals and those with MCI, modest change was seen in stage I (1.38% [95% CI, 0.78%-1.99%] and 1.80% [95% CI, 0.76%-2.84%], respectively). When looking at individual predictors and longitudinal tau PET in the stages that showed most change, plasma p-tau217 (R2 = 0.27, P < .005), tau PET (stage I baseline SUVR; R2 = 0.13, P < .05) and amyloid PET (R2 = 0.10, P < .05) were significantly associated with longitudinal tau PET in stage I in Aβ-positive CU individuals. In Aβ-positive individuals with MCI, plasma p-tau217 (R2 = 0.24, P < .005) and tau PET (stage II baseline SUVR; R2 = 0.44, P < .001) were significantly associated with longitudinal tau PET in stage II. Findings were replicated in BioFINDER-1 using longitudinal [18F]flortaucipir. For the power analysis component, plasma p-tau217 with tau PET resulted in sample size reductions of 43% (95% CI, 34%-46%; P < .005) in Aβ-positive CU individuals and of 68% (95% CI, 61%-73%; P < .001) in Aβ-positive individuals with MCI.
Conclusions and Relevance
In trials using tau PET as the outcome, plasma p-tau217 with tau PET may prove optimal for enrichment in preclinical and prodromal AD. However, plasma p-tau217 was most important in preclinical AD, while tau PET was more important in prodromal AD.
Introduction
Although differing hypotheses exist as to the molecular pathogenesis of Alzheimer disease (AD),1,2,3 a widely held view is that amyloid-β (Aβ) pathology potentiates the spread of tau through the neocortex with tau in turn associated with neurodegeneration, the proximal cause of clinical symptoms.4,5 Experimental and autopsy studies indeed provide support for this pathway, showing that tau tangles correlate strongly with neuronal and synaptic loss and cognitive decline.6,7 Further, using in vivo positron emission tomography (PET) and tau-specific tracers, cross-sectional studies have shown tracer retention to overlap closely with measures of brain hypometabolism and atrophy in AD-specific regions8,9,10,11 and to correlate with cognitive decline.12,13,14,15
Using [18F]flortaucipir, the most widely studied tau PET tracer to date, significant tracer retention has been observed in the basal ganglia, thalamus, and the choroid plexus, regions not shown to exhibit AD-like tau aggregates.16,17,18 As a result, novel tau PET tracers with reduced off-target binding in these regions have been developed,19 including [18F]PI-2620, [18F]GTP1, [18F]MK6240, and [18F]RO948. Longitudinal studies using [18F]flortaucipir20,21,22,23,24 and, more recently, [18F]MK624025 have shown that tau accumulates in medial temporal areas in cognitively unimpaired (CU) individuals before spreading to cortical regions in individuals with cognitive impairment. In these studies, quantification of tau PET signal was performed using regions of interest (ROIs) developed using [18F]flortaucipir that approximate the neuropathology-based Braak staging system for tau neurofibrillary tangles.15,26,27 As yet, there are no published longitudinal findings using [18F]RO948 tau PET.
Increasingly, longitudinal tau PET is used as on outcome in AD clinical trials evaluating disease-modifying therapies. In anti-tau trials, tau PET should be used to determine target engagement, which is an important step already during the early phases of drug development to avoid large-scale phase 3 trials with drugs unlikely to result in a positive clinical outcome.4
Further, longitudinal tau PET is nowadays often used to study the effects of drugs directed against more upstream events in AD, such as Aβ, including whether such therapies can slow the accumulation and spread of tau, which could indicate a positive clinical effect beyond just target engagement.28 However, to use longitudinal tau PET effectively as an outcome in clinical trials, enrichment for individuals likely to show tau accumulation and spread during the trial is key. This increases the statistical power to detect treatment effects. Although sample enrichment can be based on baseline biomarker profiles, there are no studies yet that have systematically addressed which imaging and fluid biomarkers are most strongly associated with longitudinal tau PET at different clinical stages of AD.
Here, we aimed to describe longitudinal tau PET findings using [18F]RO948 across the different clinical stages of AD. Next, we determined the association between baseline fluid and imaging AD biomarkers for Aβ, tau, and neurodegeneration29,30 and longitudinal tau PET. Findings from this step were then entered in a power analysis to determine how biomarker driven enrichment would affect sample size in a simulated clinical trial using a 30% reduction in annual change in tau PET as outcome. A data set with longitudinal [18F]flortaucipir (BioFINDER-1) was also included as an independent validation cohort.
Methods
Participants
We included participants from the prospective and longitudinal Swedish BioFINDER-2 study (NCT03174938), including CU individuals and patients with mild cognitive impairment (MCI) and AD dementia. Participants were enrolled between September 2017 and November 2020. Inclusion/exclusion criteria have been described elsewhere (eMethods 1 in the Supplement).31,32 CU individuals were 60 years or older and did not have MCI or dementia.31,32 Exclusion criteria included presence of objective cognitive impairment, severe somatic disease, and current alcohol/substance misuse. Patients with MCI fulfilled the Diagnostic and Statistical Manual of Mental Disorders (Fifth Edition) criteria for mild neurocognitive disorder while patients with AD dementia fulfilled the Diagnostic and Statistical Manual of Mental Disorders (Fifth Edition) criteria for major cognitive impairment due to AD.33 Aβ status was defined using amyloid PET and a previous established threshold (Centiloid ≥19) beyond which amyloid PET has been shown to reliably increase.33 Sensitivity analyses using all CU individuals and individuals with MCI regardless of Aβ status are reported in eTables 1-3 in the Supplement. All participants gave written informed consent. Ethical approval was given by the Regional Ethical Committee in Lund, Sweden. Approval for PET imaging was obtained from the Swedish Medicines and Products Agency and the local Radiation Safety Committee at Skåne University Hospital in Sweden.
Plasma and Cerebrospinal Fluid Biomarkers
Plasma Aβ42/Aβ40 was measured using a mass spectrometry-based assay (Araclon Biotech).34 Phosphorylated tau (p-tau)217 (cerebrospinal fluid [CSF] and plasma) was measured on a Meso Scale Discovery platform, using an assay developed by Eli Lilly.35,36 Plasma neurofilament light was analyzed using a Simoa-based assay.37 CSF Aβ42/40 and neurofilament light were measured using the Elecsys platform (Roche).38 Main analyses were performed using plasma biomarkers with findings using CSF-based biomarkers reported in eTables 3 to 5 in the Supplement. Sensitivity analyses were also performed using p-tau181, measured at Eli Lilly using the Meso Scale Discovery platform (CSF)35 and an in-house Simoa-based immunoassay at the Clinical Neurochemistry Laboratory in Gothenburg (plasma).39
Image Acquisition and Processing
T1-weighted magnetic resonance images were acquired on a 3-T MAGNETOM Prisma scanner (Siemens Healthineers) for PET image coregistration and template normalization. FreeSurfer version 6.0 was used to extract hippocampal volume and cortical thickness within a meta-ROI encompassing temporal regions with known susceptibility in AD (AD cortex: mean thickness in bilateral entorhinal, inferior temporal, middle temporal, and fusiform cortices).40
[18F]RO948 PET was performed 70 to 90 minutes postinjection (list-mode acquisition), as described previously.31 Standardized uptake value ratio (SUVR) images were created using the inferior cerebellar cortex as reference region. To extract mean regional SUVR values, FreeSurfer-based parcellation of the T1-weighted magnetic resonance imaging scan was applied to the [18F]RO948 data transformed to participants’ native T1 space. As some off-target binding in the choroid plexus has been described for [18F]RO948,41 analyses were performed using partial-volume–corrected (Geometric Transfer Matrix) data.42 For [18F]flutemetamol PET, data were acquired 90 to 110 minutes postinjection, as detailed elsewhere.43 After coregistration to their corresponding magnetic resonance imaging, [18F]flutemetamol images were spatially normalized to template space. SUVR values were then obtained using a neocortical meta-ROI and the whole cerebellum as reference and converted to Centiloids using the Computational Analysis of PET from AIBL (CapAIBL) pipeline.44
Tau PET ROI Definition
As the properties of [18F]RO948 differ from those of [18F]flortaucipir,41 we derived [18F]RO948-specific ROIs using a data-driven approach combining clustering and event-based modeling (EBM),45,46 an approach that allows for the ordering of biomarker changes and that has previously been applied to [18F]flortaucipir.47 Primary analyses were performed using clustering/EBM–derived ROIs (eFigure in the Supplement). For the clustering component, where the aim was to determine stable patterns of [18F]RO948 signal covariance, a 2-component Gaussian mixture model was first applied to [18F]RO948 SUVR data for each of the bilateral FreeSurfer ROIs using all available baseline scans in BioFINDER-2 (464 CU, 196 MCI, 150 AD dementia, and 216 non-AD). The predicted probability of the abnormal component was calculated for each sample, effectively converting regional SUVR values to regional tau-positive probabilities (ie, the probability that a participant’s SUVR value falls within the rightmost portion of the Gaussian distribution,47 representing abnormal [18F]RO948 signal). An unsupervised consensus clustering algorithm (bootstrap analysis of stable clusters) was then applied to cluster the data,48,49 with a 5-cluster solution adopted based on silhouette scores. Next, we used EBM to derive the order in which each of the 5 clusters become abnormal. In EBM, an event represents the transition from a normal to an abnormal state, with the EBM determining the event sequence that maximizes the data likelihood (ie, the most likely ordering of the events). Regional tau-positive probabilities were averaged within cluster-derived ROIs and submitted to EBM, using 10 000 Monte-Carlo simulations to derivate uncertainty in event ordering.
A sensitivity analysis was performed using [18F]flortaucipir–derived Braak ROIs.26 Further, as the transentorhinal cortex (Brodmann area 35) is considered the earliest site of tau pathology on the basis of postmortem data,50,51,52 an additional analysis was performed using baseline SUVR in this region53 as the predictor of EBM-based change in Aβ-positive CU individuals.
Independent Validation Cohort
Eighty-five participants with available [18F]flutemetamol PET, magnetic resonance imaging and fluid biomarkers, as well as longitudinal [18F]flortaucipir PET, were included from the Swedish BioFINDER-1 study as a validation cohort. Inclusion and exclusion criteria are described elsewhere54 (eMethods 2 in the Supplement). As p-tau217 was not available in these participants, p-tau181 measured with an immunoassay developed by Lilly Research Laboratories35 was used. CSF Aβ42/40 was measured using the Euroimmun assay,55 while plasma Aβ42/40 and neurofilament light (CSF and plasma) were measured using Roche Elecsys platform.
Statistical Analyses
All analyses were performed in R version 4.0.4 (R Foundation). Two-sided P < .05 indicated statistical significance. First, annual change in tau PET SUVR was determined between baseline and follow-up within EBM-based ROIs. This was calculated as the difference between follow-up and baseline, divided by baseline uptake and multiplied by the time interval between scans in years: ([follow-up SUVR – baseline SUVR] / baseline SUVR) × 100 / ∆time.
Having calculated longitudinal change in tau PET, regression models were used to examine whether individual biomarkers (plasma Aβ42/40, amyloid PET, plasma p-tau217, baseline tau PET in the outcome EBM stage, plasma neurofilament light, hippocampal volume, and AD cortex) were significantly associated with change in [18F]RO948 SUVR. This analysis was performed groupwise (ie, Aβ-positive CU and Aβ-positive MCI) using annual percent change in the EBM ROI that showed the highest change in tau PET SUVR for a given group as the response variable. Models were compared using coefficient of determination (R2) and Akaike information criterion (AIC; lower indicates better) values relative to a demographics only model (age and sex).
In addition to testing individual predictors, we used a backward stepwise model selection approach to identify the best combination of biomarkers. Here, the best-fitting model (ie, best combination) was that which included the fewest predictors among the models within 2 points of the lowest AIC value; this procedure is well established for selecting the most parsimonious model based on AIC values.56,57 Lastly, the best biomarker combination was used in a regression-based power analysis to calculate the reduction in sample size needed to observe a 30% reduction in the annual percentage change in tau PET SUVR. Model fit was assessed using change in AIC relative to inclusion of all participants (ie, no enrichment), assuming selection of individuals with biomarker z scores of 2 or higher (z score transformed using Aβ-negative CU individuals; eTable 6 in the Supplement).
Results
Participant Characteristics and Change in Tau PET
A total of 343 participants with longitudinal tau PET were included (137 Aβ-negative CU individuals [40.0%], 49 Aβ-positive CU individuals [14.3%], 36 Aβ-negative individuals with MCI [10.5%], 58 Aβ-positive individuals with MCI [16.9%], and 63 individuals with AD dementia [18.4%]). Across all participants, the mean (SD) age was 72.56 (7.24) years, and 157 (51.1%) were female. Participant characteristics are summarized in Table 1 and eTable 1 in the Supplement (for Aβ-negative individuals with MCI and for all CU individuals and those with MCI regardless of Aβ status). The 5 EBM-based clusters (stages) are shown in Figure 1A. In Aβ-positive CU individuals, the largest annual increase in [18F]RO948 SUVR was seen in stage I (entorhinal cortex, hippocampus, and amygdala: 4.04% [95% CI, 2.76%-5.32%]); in Aβ-positive individuals with MCI, the greatest change was seen in stage II (temporal cortical regions: 4.45% [95% CI, 3.41%-5.49%]), while in individuals with AD dementia, the greatest change was seen in stage IV (certain frontal regions: 5.22% [95% CI, 3.95%-6.49%]) (Figure 1B). Modest change was seen in Aβ-negative CU and MCI groups using stage I (1.38% [95% CI, 0.80%-1.96%] and 1.80% [95% CI, 0.76%-2.84%], respectively). Using 1-sample t tests, changes across EBM-based ROIs were significant except for stages II through V in the Aβ-negative CU and MCI groups. These findings, along with minimum and maximum percentage change values are summarized in eTable 7 in the Supplement. Findings using Braak ROIs (eTable 8 in the Supplement) were similar to those using EBM-based ROIs. Findings in all CU individuals and individuals with MCI regardless of Aβ status are reported in eTable 8 in the Supplement.
Table 1. Participant Characteristics Including A/T/N Biomarkers and Longitudinal Tau PET.
| Characteristic | Mean (SD) | |||
|---|---|---|---|---|
| Aβ- CU individuals | Aβ+ CU individuals | Aβ+ individuals with MCI | Individuals with AD dementia | |
| No. | 137 | 49 | 58 | 63 |
| Age, y | 72.57 (7.33) | 72.83 (7.52) | 71.79 (7.97) | 73.06 (6.90) |
| Female, No. (%) | 64 (47) | 26 (53) | 32 (55) | 35 (56) |
| Male, No. (%) | 73 (53) | 23 (47) | 26 (45) | 28 (44) |
| Education, y | 12.78 (3.25) | 12.15 (4.07) | 13.15 (5.24) | 11.92 (4.65) |
| MMSE score | 28.98 (1.21) | 28.67 (1.30) | 26.69 (1.91) | 19.74 (4.23) |
| APOE ε4 carrier, No. (%) | 52 (37) | 41 (84) | 37 (63) | 40 (63) |
| Tau PET, scan interval, mean (SD) [95% CI], y | 1.79 (0.19) [1.12 to 2.07] | 1.78 (0.19) [0.85 to 1.95] | 1.72 (0.24) [0.85 to 2.11] | 1.54 (0.32) [0.73 to 2.06] |
| Baseline tau PET, SUVR | ||||
| EBM stage | ||||
| I | 0.97 (0.13) | 1.17 (0.21) | 1.38 (0.32) | 1.71 (0.36) |
| II | 1.27 (0.11) | 1.42 (0.39) | 1.61 (0.45) | 2.62 (0.94) |
| III | 1.26 (0.12) | 1.35 (0.36) | 1.55 (0.54) | 2.37 (0.91) |
| IV | 1.13 (0.11) | 1.16 (0.17) | 1.20 (0.18) | 1.69 (0.86) |
| V | 1.18 (0.11) | 1.19 (0.12) | 1.20 (0.14) | 1.52 (0.43) |
| Annual change tau PET SUVR, mean (95% CI), % | ||||
| EBM stage | ||||
| I | 1.38 (0.80 to 1.96) | 4.04 (2.76 to 5.32) | 3.97 (2.97 to 4.97) | 3.98 (2.92 to 5.04) |
| II | 0.18 (−0.14 to 0.49) | 2.31 (1.33 to 2.83) | 4.45 (3.41 to 5.49) | 4.81 (3.54 to 6.08) |
| III | 0.17 (−0.26 to 0.60) | 2.21 (1.38 to 3.04) | 3.87 (2.63 to 5.09) | 5.18 (3.94 to 6.42) |
| IV | 0.19 (−0.18 to 0.56) | 2.17 (1.25 to 3.09) | 2.45 (1.44 to 3.46) | 5.22 (3.95 to 6.49) |
| V | 0.13 (−0.19 to 0.65) | 1.67 (0.71 to 2.63) | 2.61 (1.55 to 3.67) | 4.02 (2.87 to 5.17) |
| A/T/N variables | ||||
| Aβ42/40 | ||||
| Plasma | 0.22 (0.03) | 0.20 (0.03) | 0.18 (0.04) | 0.19 (0.04) |
| CSF | 0.11 (0.02) | 0.05 (0.01) | 0.02 (0.03) | 0.04 (0.01) |
| Amyloid PET, Centiloids | −8.11 (6.33) | 50.72 (21.27) | 60.88 (25.44) | NAa |
| P-tau217, pg/mL | ||||
| Plasma | 1.29 (2.67) | 3.22 (2.39) | 3.81 (2.14) | 8.01 (4.38) |
| CSF | 42.69 (27.21) | 245.40 (93.30) | 258.63 (133.92) | 599.49 (320.36) |
| NfL, pg/mL | ||||
| Plasma | 12.40 (7.38) | 17.65 (5.71) | 18.91 (9.80) | 28.47 (36.10) |
| CSF | 108.50 (51.93) | 201.70 (143.16) | 197.90 (94.37) | 315.04 (284.61) |
| Hippocampal volume, mm3 | 3874.64 (437.76) | 3636.59 (513.74) | 3268.75 (520.90) | 2799.20 (421.44) |
| AD cortex thickness, mm | 2.76 (0.12) | 2.62 (0.16) | 2.52 (0.15) | 2.38 (0.20) |
Abbreviations: Aβ, amyloid-β; Aβ42/40, ratio of amyloid-β42 to amyloid-β40; AD, Alzheimer disease; AD cortex, cortical thickness in a temporal meta region of interest encompassing temporal regions with known susceptibility in Alzheimer disease; APOE, apolipoprotein E; A/T/N, amyloid/tau/neurodegeneration; EBM, event-based modeling; CSF, cerebrospinal fluid; CU, cognitively unimpaired; MCI, mild cognitive impairment; MMSE, Mini-Mental State Examination; NA, not applicable; NfL, neurofilament light; PET, positron emission tomography; p-tau217, tau phosphorylated at threonine 217; SUVR, standardized uptake value ratio.
In BioFINDER-2, amyloid PET is by design performed only in individuals without cognitive impairment and those with MCI.
Figure 1. EBM-Based Regions of Interest and Annual Percent Change in Tau PET Standardized Uptake Value by EBM Stage.
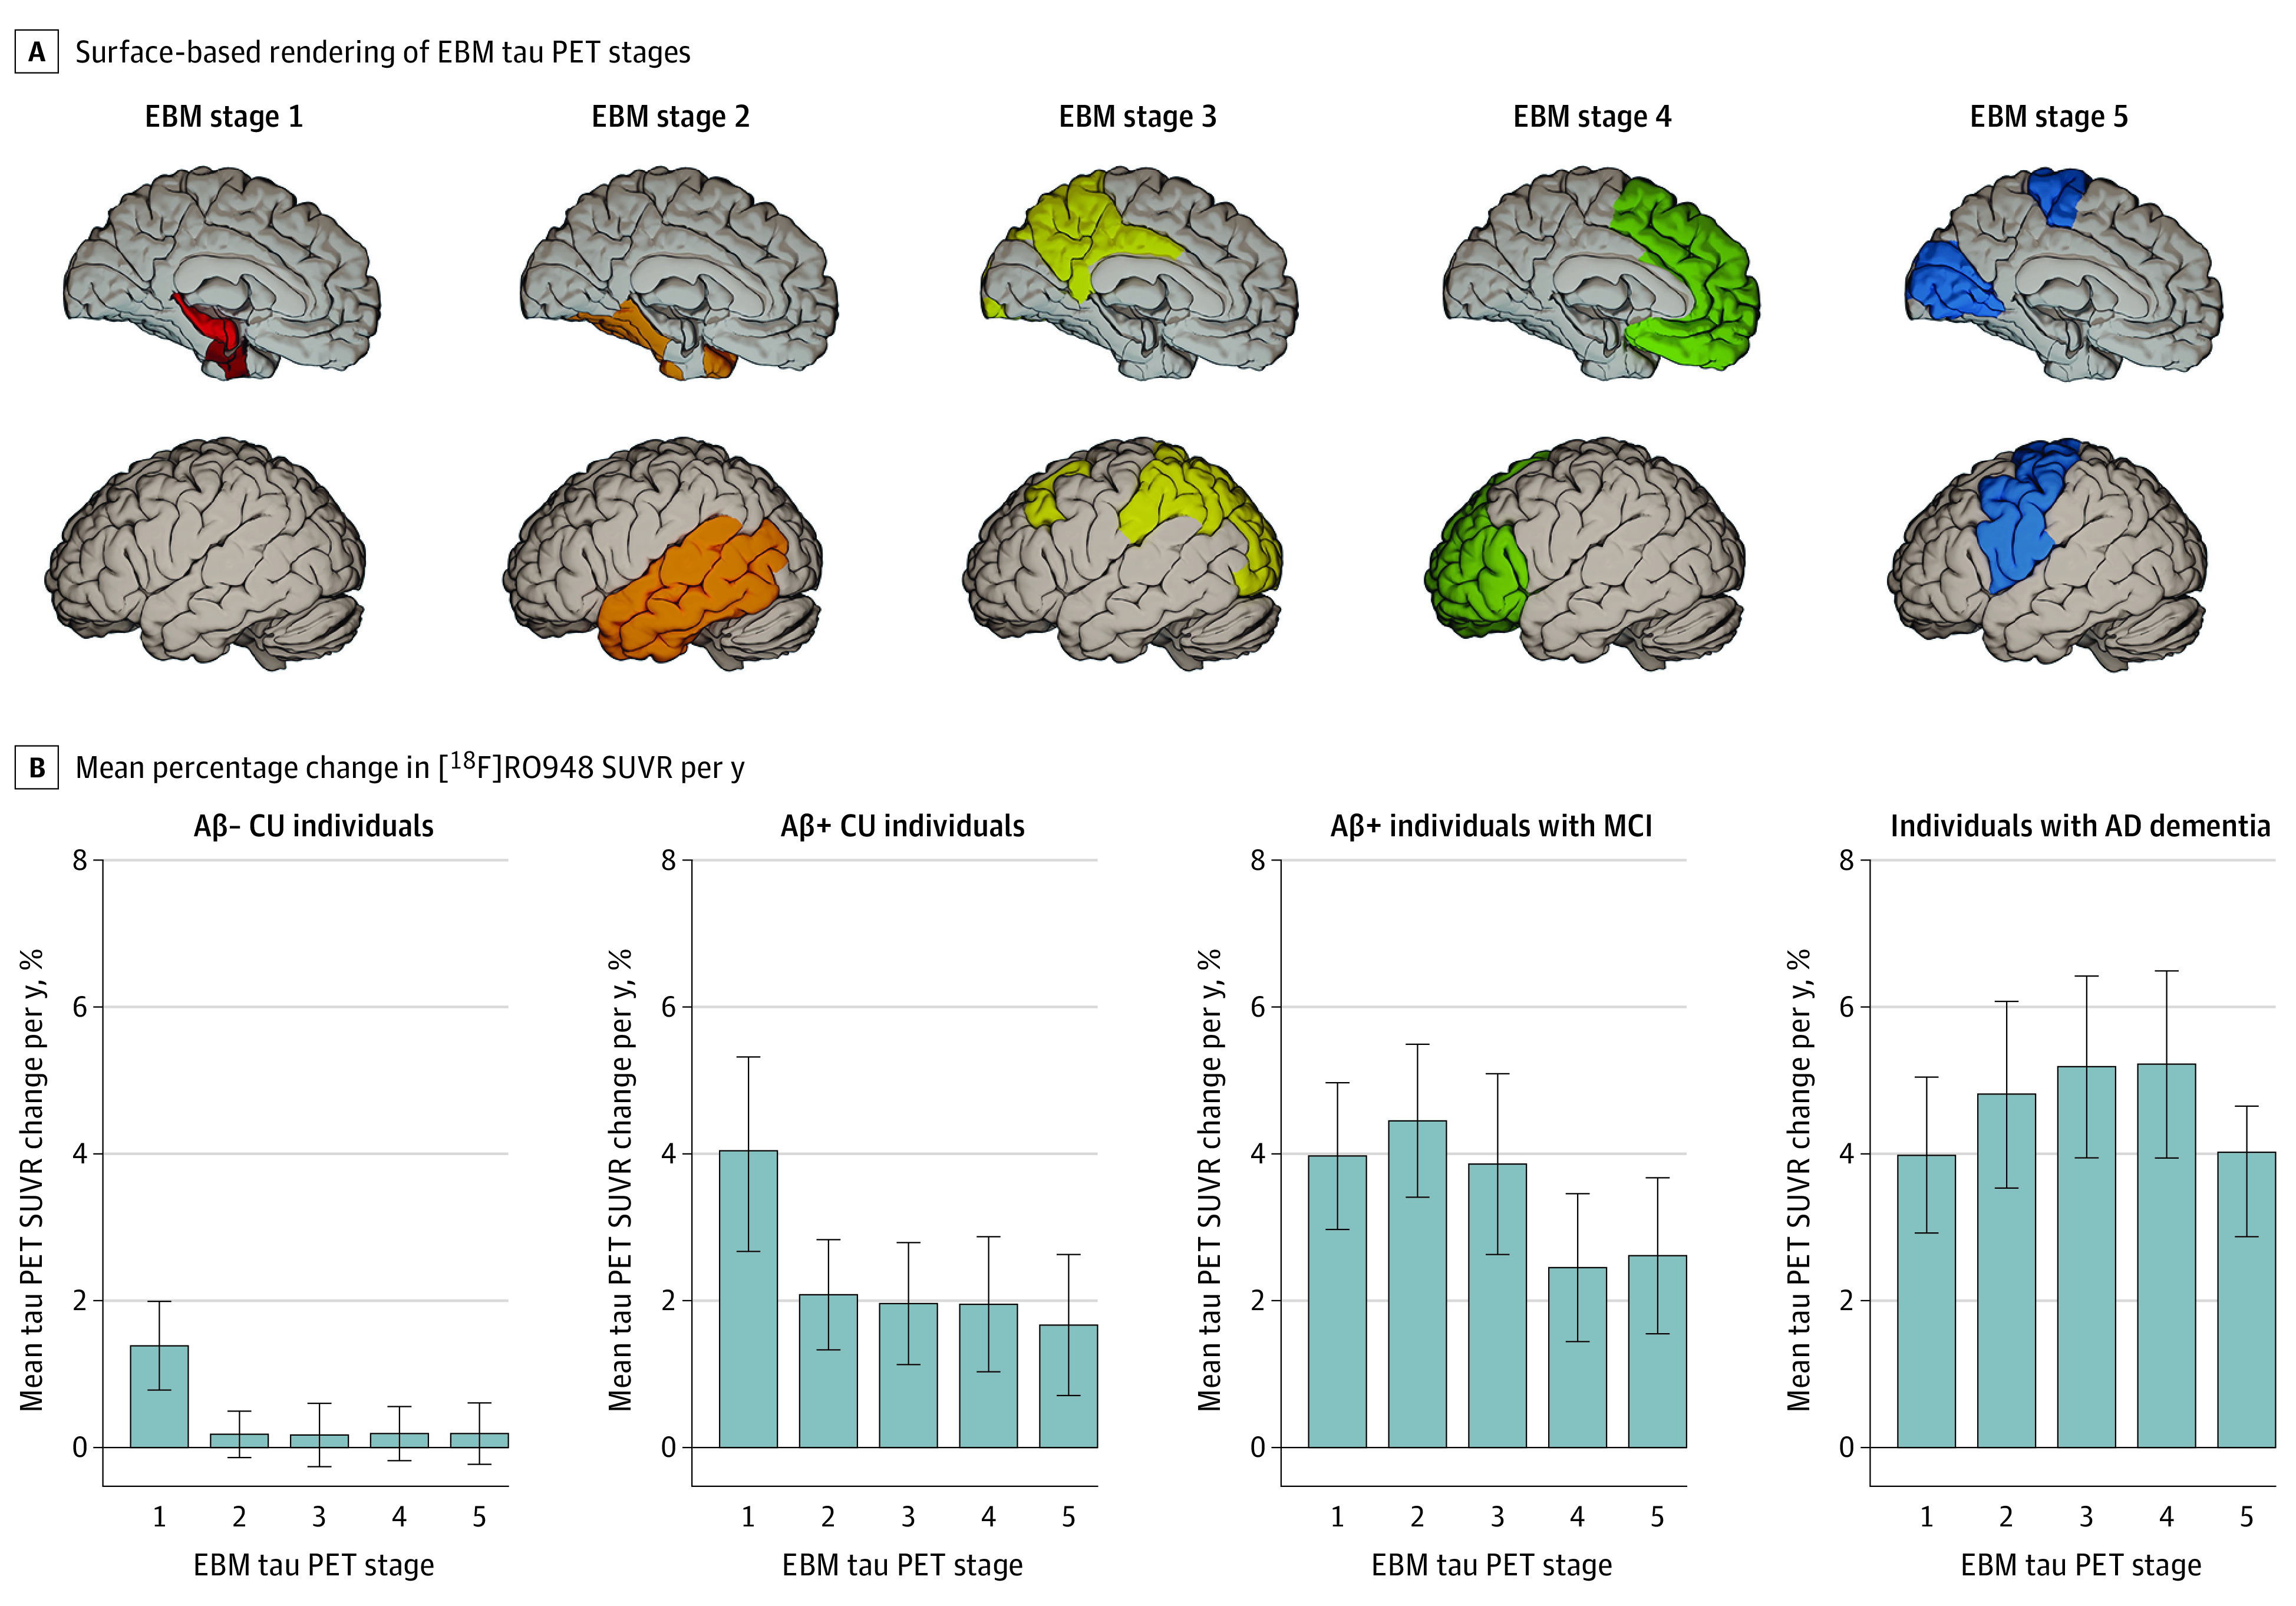
A, Surface-based rendering of event-based modeling (EBM) tau positron emission tomography (PET) stages (I through V, left to right). B, Mean percent change in [18F]RO948 standardized uptake value ratio per year along with 95% CIs. Aβ indicates amyloid-β; CU, cognitively unimpaired; MCI, mild cognitive impairment; p-tau, phosphorylated tau
Modeling Change in Tau PET Using Individual Predictors
Next, we tested whether individual biomarkers were significantly associated with annual change in [18F]RO948 tau PET SUVR (Table 2). These analyses were performed in Aβ-positive CU individuals and those with MCI as these populations are of primary interest for AD clinical trials. In Aβ-positive CU individuals, plasma p-tau217 (R2 = 0.27; P < .005; ΔAIC = −10), tau PET (baseline SUVR in stage I, R2 = 0.13; P < .05; ΔAIC = −3) and amyloid PET (R2 = 0.10; P < .05; ΔAIC = −2) showed significant associations with annual change in [18F]RO948 SUVR in stage I. In Aβ-positive individuals with MCI, plasma p-tau217 (R2 = 0.24; P < .001; ΔAIC = −10) and tau PET (baseline SUVR in stage II, R2 = 0.33; P < .001; ΔAIC = −25) were significantly associated with annual changes in [18F]RO948 SUVR in stage II. Similar findings were seen when using CSF instead of plasma-based biomarkers (eTable 4 in the Supplement) and when using p-tau181 instead of p-tau217 (eTables 9 and 10 in the Supplement). Results were consistent with EBM-based findings when using Braak ROIs (eTable 11 in the Supplement) and when using baseline SUVR in Brodmann area 35 instead of the stage I ROI in Aβ-positive CU individuals (eTable 12 in the Supplement). Findings in all CU individuals and those with MCI regardless of Aβ status are reported in eTables 2 and 3 in the Supplement. Findings for AD dementia, where plasma p-tau217, CSF p-tau217, and tau PET (baseline SUVR in stage IV) were significantly associated with annual changes in [18F]RO948 SUVR in stage IV are summarized in eTables 5 and 13 in the Supplement.
Table 2. Associations Between Individual Variables and Longitudinal Tau PET in CU Individuals and Individuals With MCI With Evidence of Aβ Pathology.
| Group | Variable | Coefficient | Adjusted R2 (95% CI) | P value | ∆AIC |
|---|---|---|---|---|---|
| Aβ+ CU individualsa,b | Plasma Aβ42/40 | −0.03 | 0.00 (−0.02 to 0.02) | .86 | 2 |
| Amyloid PET | 0.32 | 0.10 (−0.07 to 0.27) | .047 | −2 | |
| Plasma p-tau217 | 0.53 | 0.27 (0.04 to 0.49) | <.005 | −10 | |
| Tau PET | 0.36 | 0.13 (−0.06 to 0.31) | .03 | −3 | |
| Plasma NFL | 0.10 | 0.01 (−0.05 to 0.07) | .57 | 2 | |
| Hippocampal volume | 0.06 | 0.00 (−0.03 to 0.04) | .72 | 2 | |
| AD cortex | −0.07 | 0.01 (−0.04 to 0.05) | .67 | 2 | |
| Aβ+ individuals with MCIc,b | Plasma Aβ42/40 | −0.24 | 0.05 (−0.06 to 0.17) | .12 | −1 |
| Amyloid PET | 0.16 | 0.02 (−0.06 to 0.11) | .30 | 1 | |
| Plasma p-tau217 | 0.49 | 0.24 (0.04 to 0.44) | <.001 | −10 | |
| Tau PET | 0.67 | 0.44 (0.16 to 0.57) | <.001 | −25 | |
| Plasma NFL | −0.07 | 0.00 (−0.03 to 0.04) | .67 | 2 | |
| Hippocampal volume | −0.18 | 0.03 (−0.06 to 0.13) | .23 | 0 | |
| AD cortex | −0.16 | 0.02 (−0.06 to 0.11) | .31 | 1 |
Abbreviations: ∆AIC, change in Akaike information criterion relative to a demographics only model (age and sex); Aβ, amyloid-β; Aβ42/40, ratio of amyloid-β42 to amyloid-β40; AD cortex, cortical thickness in a temporal meta region of interest encompassing temporal regions with known susceptibility in Alzheimer disease; CU, cognitively unimpaired; MCI, mild cognitive impairment; NfL, neurofilament light; PET, positron emission tomography; p-tau217, tau phosphorylated at threonine 217.
Tau PET refers to [18F]RO948 standardized uptake value ratio at baseline in the event-based modeling stage I region of interest.
Amyloid PET refers to the standardized uptake value ratio at baseline in a neocortical meta region of interest, expressed in Centiloids.
Tau PET refers to [18F]RO948 standardized uptake value ratio at baseline in the event-based modeling stage II region of interest.
Power Analysis for Theoretical Clinical Trial
Lastly, we tested which biomarker combinations were most strongly associated with annual increases in [18F]RO948 SUVR and their association with sample size when used for population enrichment of participants that will exhibit a more positive slope in tau PET over time. Basing selection on the most parsimonious model (ie, including the least number of biomarkers and having an AIC within 2 points of the lowest AIC value), a model combining plasma p-tau217 and baseline tau PET proved best in Aβ-positive CU individuals (R2 = 0.31, AIC = 100) and in Aβ-positive individuals with MCI (R2 = 0.46, AIC = 111) (Table 3). Applying these models for population enrichment in a clinical trial context resulted in sample size reductions of 43% (95% CI, 34%-47%; P < .005; ∆AIC = −2) in Aβ-positive CU individuals and 68% (95% CI, 60%-73%; P < .001; AIC = −10) in Aβ-positive individuals with MCI (Figure 2). When examining the importance of individual predictors, sample size reductions were larger using plasma p-tau217 (31% [95% CI, 24%-39%]; P < .005; ∆AIC = −5) compared with tau PET (22% [95% CI, 16%-29%]; P < .05; ∆AIC = −2) in Aβ-positive CU individuals, and larger using tau PET (47% [95% CI, 37%-56%]; P < .001; ∆AIC = −10) compared with plasma p-tau217 (28% [95% CI, 30%-37%]; P < .05; ∆AIC = −2) in Aβ-positive individuals with MCI. Results using all CU and MCI independent of Aβ status are reported in eTables 14 and 15 in the Supplement. Results for AD dementia are summarized in eTables 16 and 17 in the Supplement.
Table 3. Summary of Model Selection Approach for Variables Using Longitudinal Tau PET as Outcome.
| Group | Model | Removed from model | R2 | AIC |
|---|---|---|---|---|
| Aβ+ CU individualsa | Plasma Aβ42/40, amyloid PET, plasma p-tau217, tau PET, plasma NFL, hippocampal volume, AD cortex | NA | 0.33 | 108 |
| Plasma Aβ42/40, amyloid PET, plasma p-tau217, tau PET, hippocampal volume, AD cortex | Plasma NFL | 0.33 | 106 | |
| Plasma Aβ42/40, amyloid PET, plasma p-tau217, tau PET, AD cortex | Hippocampal volume | 0.33 | 104 | |
| Plasma Aβ42/40, amyloid PET, plasma p-tau217, tau PET | AD cortex | 0.33 | 102 | |
| Plasma Aβ42/40, tau PET, plasma p-tau217 | Amyloid PET | 0.32 | 101 | |
| Tau PET, plasma p-tau217 | Plasma Aβ42/40 | 0.31 | 100 | |
| Plasma p-tau217 | Tau PET | 0.29 | 103 | |
| Aβ+ individuals with MCIb | Plasma Aβ42/40, amyloid PET, plasma p-tau217, tau PET, plasma NFL, hippocampal volume, AD cortex | NA | 0.48 | 120 |
| Plasma Aβ42/40, amyloid PET, plasma p-tau217, tau PET, plasma NFL, hippocampal volume | AD cortex | 0.48 | 118 | |
| Plasma Aβ42/40, amyloid PET, plasma p-tau217, tau PET, plasma NFL | Hippocampal volume | 0.48 | 116 | |
| Plasma Aβ42/40, amyloid PET, plasma p-tau217, tau PET | Plasma NFL | 0.48 | 115 | |
| Plasma Aβ42/40, plasma P-tau217, tau PET | Amyloid PET | 0.46 | 113 | |
| Plasma p-tau217, tau PET | Plasma Aβ42/40 | 0.46 | 111 | |
| Tau PET | Plasma p-tau217 | 0.45 | 114 |
Abbreviations: Aβ, amyloid-β; AD cortex, cortical thickness in a temporal meta region of interest encompassing temporal regions with known susceptibility in Alzheimer disease; AIC, Akaike information criterion; Aβ42/40, ratio of amyloid-β42 to amyloid-β40; CU, cognitively unimpaired; MCI, mild cognitive impairment; NA, not applicable; NfL, neurofilament light; PET, positron emission tomography; p-tau217, tau phosphorylated at threonine 217.
Tau PET refers to [18F]RO948 standardized uptake value ratio at baseline in the event-based modeling stage I region of interest.
Tau PET refers to [18F]RO948 standardized uptake value ratio at baseline in the event-based modeling stage II region of interest.
Figure 2. Power Enrichment Analysis of Plasma Biomarkers in a Theoretical Clinical Trial Using Tau PET as End Point.

Mean percent sample size reductions along with 95% CIs are shown for individual biomarkers and combined in Aβ-positive CU individuals (A) and in Aβ-positive individuals with MCI (B). Aβ indicates amyloid-β; AD, Alzheimer disease; CU, cognitively unimpaired; EBM, event-based modeling; MCI, mild cognitive impairment; PET, positron emission tomography; SUVR, standardized uptake value..
Independent Validation Cohort
Among 85 study participants (12 Aβ-negative CU individuals, 27 Aβ-positive CU individuals, 10 Aβ-negative individuals with MCI, 16 Aβ-positive individuals with MCI, and 20 individuals with AD dementia) in the independent validation cohort, the mean (SD) age was 77.18 (7.74) years and 41 (48.32%) were female. Demographic and biomarker characteristics are shown in eTable 18 in the Supplement.
Similar to findings in BioFINDER-2, the largest annual increase in [18F]flortaucipir SUVR was seen in stage I (3.44% [95% CI, 2.96%-4.84%]) in Aβ-positive CU individuals, with Aβ-positive individuals with MCI and AD dementia showing the largest increases in stages II (4.35% [95% CI, 3.92%-4.78%]) and IV (4.21% [95% CI, 3.82%-4.60%]), respectively (eTable 18 in the Supplement). In Aβ-negative CU individuals, modest change was seen in stage I (1.39% [95% CI, 1.07%-1.71%]). When examining the associations between individual biomarkers and annual change in tau PET SUVR, plasma p-tau181 (R2 = 0.21; P < .05; ΔAIC = −5), tau PET (R2 = 0.14; P < .05; ΔAIC = −2), and amyloid PET (R2 = 0.13; P < .05; ΔAIC = −2) showed significant associations with annual change in [18F]flortaucipir SUVR in stage I (eTable 19 in the Supplement). In Aβ-positive individuals with MCI, plasma p-tau181 (R2 = 0.16; P < .05; ΔAIC = −2) and tau PET (R2 = 0.44; P < .005; ΔAIC = −6) were significantly associated with annual change in [18F]flortaucipir SUVR in stage II (eTable 19 in the Supplement). Similar results were obtained when using CSF p-tau181 (eTable 20 in the Supplement).
Discussion
Using a novel data-driven approach (EBM), we identified target ROIs that were broadly consistent with widely used Braak-like stages.15,26,27 Overall, these results support earlier work using [18F]flortaucipir14,22,58,59,60—and, more recently, [18F]MK624025—showing that the accumulation of pathological tau was seen mainly in the medial temporal lobe early in the disease process (ie, Aβ-positive CU individuals) and primarily in neocortical areas in Aβ-positive individuals with cognitive impairment. The EBM-based stage I ROI encompassed the entorhinal cortex, the hippocampus, and the amygdala. In head-to-head work comparing [18F]RO948 and [18F]flortaucipir,41 [18F]RO948 showed higher signal in the entorhinal cortex and less off-target binding in the choroid plexus, making the hippocampus a region more suitable for use with [18F]RO948 compared with [18F]flortaucipir. The inclusion of the amygdala in the stage I ROI is consistent with previous work using [18F]flortaucipir61—and, more recently, [18F]RO94862 and [18F]MK624063—identifying it as a site of early tau accumulation. The levels of annual change in tau PET SUVR in the stage I ROI were similar across Aβ-positive groups. Consistent with the Braak model of tau pathology in AD,51 this suggests that tau continues to accumulate in areas involved early on even after spreading into later regions.24,64,65 As elevated rates of tau accumulation in the neocortex were only seen in the presence of abnormal Aβ, our findings are consistent with earlier cross-sectional findings showing that abnormal [18F]RO948 SUVR levels were only seen in the context of elevated Aβ31 and support the idea that amyloidosis is an upstream driver of tau accumulation.5,24,25,58 However, findings in Aβ-negative CU, where a modest increase in medial temporal signal (stage I) was seen, suggest that [18F]RO948 may be able to detect primary age-related tauopathy.2,66
In Aβ-positive CU individuals, plasma p-tau217 was the predictor most strongly associated with longitudinal change in tau PET, followed by baseline tau PET and amyloid PET. Recent cross-sectional work examining plasma p-tau217 in CU persons showed that levels are elevated in individuals with signs of Aβ pathology,32 with high levels at baseline associated with larger increases in tau PET signal in the medial temporal lobe,67 and largely mediated the association between amyloid and tau PET.67,68 Similar findings have also been reported for CSF p-tau217.69 On the basis of these findings, it has been proposed that Aβ pathology is associated with an increase in the release and phosphorylation of tau. This disruption in the metabolism of soluble tau is reflected in elevated CSF and plasma p-tau and might be associated with the subsequent accumulation of tau aggregates. This scenario, whereby elevated Aβ levels result in increased plasma p-tau and subsequent accumulation of tau aggregates over time would account for the significant associations seen between longitudinal tau PET, and baseline plasma p-tau217, amyloid PET, and tau PET. In the combination analysis, plasma p-tau217 and tau PET proved the best combination, but baseline [18F]RO948 SUVR in stage I only showed a slightly stronger association to longitudinal tau PET than amyloid PET. This finding is in line with recent work that also showed a very similar degree of association between amyloid PET and tau PET with tau accumulation rates in CU individuals.70 In prodromal AD (ie, Aβ-positive individuals with MCI), baseline tau PET followed by plasma p-tau217 were the predictors most strongly associated with longitudinal tau PET. Our findings for tau PET align with previous findings showing a strong association between neocortical tau PET increase and baseline tau burden in Aβ-positive individuals with MCI.22 Once outside the medial temporal lobe, the baseline burden of tau aggregates appears to be the strongest predictor of future increases. The significant association of plasma p-tau217 with longitudinal tau PET at this stage, coupled with continued associations with tau PET in AD dementia, suggest that the disruption of soluble tau, as reflected by elevated plasma p-tau217 levels, may roughly parallel tau accumulation across the symptomatic course of AD.69,71 Although we were not able to assess other p-tau variants such as p-tau231,72 we observed very similar results between p-tau181 and p-tau217, consistent with recent work showing that both variants perform similarly when differentiating individuals based on tau PET status.73
Having established which biomarkers best predicted tau accumulation in Aβ-positive CU individuals and those with MCI, we assessed their association as enrichment approaches in the context of inclusion in clinical trials where longitudinal tau PET is used as a main outcome to detect either target engagement or clinical efficacy. Although our findings suggest that plasma p-tau217 and tau PET could be used as straightforward approaches to identify CU individuals and those with MCI, respectively, who are more likely to have high rates of tau accumulation, the greater sample size reductions seen when combining plasma p-tau217 with tau PET suggest that this approach may be favorable. This may prove cost-effective in trials involving preclinical and prodromal AD given that a baseline tau PET scan would anyway be required if using longitudinal tau PET as an end point and that plasma p-tau217 is comparatively easy and inexpensive to measure. While biomarker-based enrichment in clinical trials may increase statistical power, it also increases the number of screening failures. The cost associated with excluding individuals based on their baseline biomarker findings (ie, screening failures) may be justified by the risk of including participants who do not show longitudinal increase in tau PET. Future cost-focused studies are required to address these and related trade-offs.
Strengths and Limitations
Strengths of this study include that we directly compared the predictive ability of many relevant imaging and fluid-based AD biomarkers, which has not been done before. Further, tau accumulation was measured longitudinally and compared using data (EBM) and postmortem-based (Braak) approaches. In addition to our study covering the clinical continuum of AD, our follow-up interval was comparatively long and similar across group, with Aβ status defined using Centiloids and a well-determined cut point. Importantly, we replicated our main findings using longitudinal [18F]flortaucipir PET in an independent cohort (BioFINDER-1). Limitations include the modest number of participants in the AD dementia and Aβ-positive groups and the fact that amyloid PET was not available for participants with AD dementia. An additional limitation specific to our power analysis was that we could not estimate within-participant measurement error because participants only had 2 tau PET scans. Although our focus was on establishing which biomarkers best predicted longitudinal change in the pre- and early symptomatic stages of AD, there remains interest in the testing of anti-tau compounds in patients with mild dementia due to AD.74 In addition, we cannot exclude that Aβ, tau, and neurodegeneration biomarkers or model types, including those incorporating nonlinear relationships and interactions between biomarkers, other than those investigated here may have resulted in better model fits. Lastly, future studies must address the importance of cutoff selection and relevant variables such as age. Younger participants, for instance, may be excluded owing to low or borderline levels of p-tau217 and baseline tau PET yet be on the verge of showing significant increases in tau levels.
Conclusions
Although further work addressing optimal biomarker combinations is required, our results indicate that plasma p-tau217 and tau PET may significantly reduce sample sizes in preclinical and prodromal AD clinical trials using tau PET as one of the main outcomes. Although their combination provided the greatest sample size reduction, plasma p-tau217 was more important in preclinical AD, while tau PET was more important in prodromal AD.
eMethods 1. Inclusion and exclusion criteria for the Swedish BioFINDER-2 study.
eMethods 2. Inclusion and exclusion criteria for the Swedish BioFINDER-1 study.
eFigure. Overview of the steps involved in the clustering and EBM derived ROIs.
eTable 1. Participant characteristics including A/T/N biomarkers and longitudinal.
tau PET in Aβ-negative MCI and CU and MCI regardless of Aβ status.
eTable 2. Relationship between individual biomarkers and tau PET using EBM ROIs and plasma biomarkers in all CU and MCI independent of Aβ status.
eTable 3. Relationship between individual biomarkers and tau PET using EBM ROIs and CSF biomarkers in all CU and MCI independent of Aβ status.
eTable 4. Relationship between individual biomarkers and tau PET using CSF biomarkers.
eTable 5. Relationship between individual biomarkers and tau PET using EBM ROIs and CSF biomarkers in AD dementia.
eTable 6. Characteristics of Aβ-negative CU individuals used for z-score transformation.
eTable 7. Range of annual percent change values and results of one-sample t-tests across groups and EBM ROIs.
eTable 8. Mean annual percent change in tau PET SUVR using Braak ROIs.
eTable 9. Relationship between individual biomarkers and tau PET using plasma p-tau181.
eTable 10. Relationship between individual biomarkers and tau PET using CSF p-tau181.
eTable 11. Relationship between individual biomarkers and tau PET using Braak I ROI for Aβ-positive CU and Braak III ROI in Aβ-positive MCI.
eTable 12. Relationship between individual biomarkers and tau PET in Aβ-positive CU using transentorhinal SUVR at baseline instead of EBM I baseline SUVR.
eTable 13. Relationship between individual biomarkers and tau PET using EBM ROIs and plasma biomarkers in AD dementia.
eTable 14. Summary of model selection approach for predictors (plasma and imaging) using longitudinal tau PET as outcome in all CU and MCI independent of Aβ status.
eTable 15. Power enrichment analysis of plasma biomarkers in a theoretical clinical trial using tau PET as end point in all CU and MCI independent of Aβ status.
eTable 16. Summary of model selection approach for predictors (plasma and imaging) using longitudinal tau PET as outcome in AD dementia.
eTable 17. Power enrichment analysis of plasma biomarkers in a theoretical clinical trial using tau PET as end point in AD dementia.
eTable 18. BioFINDER-1 participant characteristics including A/T/N biomarkers and longitudinal tau PET.
eTable 19. Relationship between individual biomarkers and tau PET using EBM ROIs and plasma biomarkers in Aβ-positive CU and Aβ-positive MCI from BioFINDER-1.
eTable 20. Relationship between individual biomarkers and tau PET using EBM ROIs and CSF biomarkers in Aβ-positive CU and Aβ-positive MCI from BioFINDER-1.
eReferences.
References
- 1.Duyckaerts C. Tau pathology in children and young adults: can you still be unconditionally Baptist? Acta Neuropathol. 2011;121(2):145-147. doi: 10.1007/s00401-010-0794-7 [DOI] [PubMed] [Google Scholar]
- 2.Duyckaerts C, Braak H, Brion JP, et al. PART is part of Alzheimer disease. Acta Neuropathol. 2015;129(5):749-756. doi: 10.1007/s00401-015-1390-7 [DOI] [PMC free article] [PubMed] [Google Scholar]
- 3.Chételat G. Alzheimer disease: Aβ-independent processes-rethinking preclinical AD. Nat Rev Neurol. 2013;9(3):123-124. doi: 10.1038/nrneurol.2013.21 [DOI] [PMC free article] [PubMed] [Google Scholar]
- 4.Hansson O. Biomarkers for neurodegenerative diseases. Nat Med. 2021;27(6):954-963. doi: 10.1038/s41591-021-01382-x [DOI] [PubMed] [Google Scholar]
- 5.Jack CR Jr, Holtzman DM. Biomarker modeling of Alzheimer’s disease. Neuron. 2013;80(6):1347-1358. doi: 10.1016/j.neuron.2013.12.003 [DOI] [PMC free article] [PubMed] [Google Scholar]
- 6.Spires-Jones TL, Hyman BT. The intersection of amyloid beta and tau at synapses in Alzheimer’s disease. Neuron. 2014;82(4):756-771. doi: 10.1016/j.neuron.2014.05.004 [DOI] [PMC free article] [PubMed] [Google Scholar]
- 7.Nelson PT, Alafuzoff I, Bigio EH, et al. Correlation of Alzheimer disease neuropathologic changes with cognitive status: a review of the literature. J Neuropathol Exp Neurol. 2012;71(5):362-381. doi: 10.1097/NEN.0b013e31825018f7 [DOI] [PMC free article] [PubMed] [Google Scholar]
- 8.Sintini I, Graff-Radford J, Senjem ML, et al. Longitudinal neuroimaging biomarkers differ across Alzheimer’s disease phenotypes. Brain. 2020;143(7):2281-2294. doi: 10.1093/brain/awaa155 [DOI] [PMC free article] [PubMed] [Google Scholar]
- 9.Harrison TM, Du R, Klencklen G, Baker SL, Jagust WJ. Distinct effects of beta-amyloid and tau on cortical thickness in cognitively healthy older adults. Alzheimers Dement. 2021;17(7):1085-1096. [DOI] [PMC free article] [PubMed] [Google Scholar]
- 10.Iaccarino L, La Joie R, Edwards L, et al. Spatial relationships between molecular pathology and neurodegeneration in the Alzheimer’s disease continuum. Cereb Cortex. 2021;31(1):1-14. doi: 10.1093/cercor/bhaa184 [DOI] [PMC free article] [PubMed] [Google Scholar]
- 11.Ossenkoppele R, Schonhaut DR, Schöll M, et al. Tau PET patterns mirror clinical and neuroanatomical variability in Alzheimer’s disease. Brain. 2016;139(Pt 5):1551-1567. doi: 10.1093/brain/aww027 [DOI] [PMC free article] [PubMed] [Google Scholar]
- 12.Bejanin A, Schonhaut DR, La Joie R, et al. Tau pathology and neurodegeneration contribute to cognitive impairment in Alzheimer’s disease. Brain. 2017;140(12):3286-3300. doi: 10.1093/brain/awx243 [DOI] [PMC free article] [PubMed] [Google Scholar]
- 13.Ossenkoppele R, Smith R, Ohlsson T, et al. Associations between tau, Aβ, and cortical thickness with cognition in Alzheimer disease. Neurology. 2019;92(6):e601-e612. doi: 10.1212/WNL.0000000000006875 [DOI] [PMC free article] [PubMed] [Google Scholar]
- 14.Johnson KA, Schultz A, Betensky RA, et al. Tau positron emission tomographic imaging in aging and early Alzheimer disease. Ann Neurol. 2016;79(1):110-119. doi: 10.1002/ana.24546 [DOI] [PMC free article] [PubMed] [Google Scholar]
- 15.Schöll M, Lockhart SN, Schonhaut DR, et al. PET imaging of tau deposition in the aging human brain. Neuron. 2016;89(5):971-982. doi: 10.1016/j.neuron.2016.01.028 [DOI] [PMC free article] [PubMed] [Google Scholar]
- 16.Lowe VJ, Curran G, Fang P, et al. An autoradiographic evaluation of AV-1451 Tau PET in dementia. Acta Neuropathol Commun. 2016;4(1):58. doi: 10.1186/s40478-016-0315-6 [DOI] [PMC free article] [PubMed] [Google Scholar]
- 17.Marquié M, Normandin MD, Vanderburg CR, et al. Validating novel tau positron emission tomography tracer [F-18]-AV-1451 (T807) on postmortem brain tissue. Ann Neurol. 2015;78(5):787-800. doi: 10.1002/ana.24517 [DOI] [PMC free article] [PubMed] [Google Scholar]
- 18.Sander K, Lashley T, Gami P, et al. Characterization of tau positron emission tomography tracer [18F]AV-1451 binding to postmortem tissue in Alzheimer’s disease, primary tauopathies, and other dementias. Alzheimers Dement. 2016;12(11):1116-1124. doi: 10.1016/j.jalz.2016.01.003 [DOI] [PubMed] [Google Scholar]
- 19.Leuzy A, Chiotis K, Lemoine L, et al. Tau PET imaging in neurodegenerative tauopathies-still a challenge. Mol Psychiatry. 2019;24(8):1112-1134. doi: 10.1038/s41380-018-0342-8 [DOI] [PMC free article] [PubMed] [Google Scholar]
- 20.Harrison TM, La Joie R, Maass A, et al. Longitudinal tau accumulation and atrophy in aging and Alzheimer disease. Ann Neurol. 2019;85(2):229-240. doi: 10.1002/ana.25406 [DOI] [PMC free article] [PubMed] [Google Scholar]
- 21.Cho H, Choi JY, Lee HS, et al. Progressive tau accumulation in Alzheimer disease: 2-year follow-up study. J Nucl Med. 2019;60(11):1611-1621. doi: 10.2967/jnumed.118.221697 [DOI] [PMC free article] [PubMed] [Google Scholar]
- 22.Pontecorvo MJ, Devous MD, Kennedy I, et al. A multicentre longitudinal study of flortaucipir (18F) in normal ageing, mild cognitive impairment and Alzheimer’s disease dementia. Brain. 2019;142(6):1723-1735. doi: 10.1093/brain/awz090 [DOI] [PMC free article] [PubMed] [Google Scholar]
- 23.Hanseeuw BJ, Betensky RA, Jacobs HIL, et al. Association of amyloid and tau with cognition in preclinical Alzheimer disease: a longitudinal study. JAMA Neurol. 2019;76(8):915-924. doi: 10.1001/jamaneurol.2019.1424 [DOI] [PMC free article] [PubMed] [Google Scholar]
- 24.Jack CR Jr, Wiste HJ, Schwarz CG, et al. Longitudinal tau PET in ageing and Alzheimer’s disease. Brain. 2018;141(5):1517-1528. doi: 10.1093/brain/awy059 [DOI] [PMC free article] [PubMed] [Google Scholar]
- 25.Pascoal TA, Benedet AL, Tudorascu DL, et al. Longitudinal 18F-MK-6240 tau tangles accumulation follows Braak stages. Brain. 2021;awab248. doi: 10.1093/brain/awab248 [DOI] [PMC free article] [PubMed] [Google Scholar]
- 26.Cho H, Choi JY, Hwang MS, et al. In vivo cortical spreading pattern of tau and amyloid in the Alzheimer disease spectrum. Ann Neurol. 2016;80(2):247-258. doi: 10.1002/ana.24711 [DOI] [PubMed] [Google Scholar]
- 27.Schwarz AJ, Yu P, Miller BB, et al. Regional profiles of the candidate tau PET ligand 18F-AV-1451 recapitulate key features of Braak histopathological stages. Brain. 2016;139(Pt 5):1539-1550. doi: 10.1093/brain/aww023 [DOI] [PubMed] [Google Scholar]
- 28.Mintun MA, Lo AC, Duggan Evans C, et al. Donanemab in early Alzheimer’s disease. N Engl J Med. 2021;384(18):1691-1704. doi: 10.1056/NEJMoa2100708 [DOI] [PubMed] [Google Scholar]
- 29.Jack CR Jr, Bennett DA, Blennow K, et al. ; Contributors . NIA-AA research framework: toward a biological definition of Alzheimer’s disease. Alzheimers Dement. 2018;14(4):535-562. doi: 10.1016/j.jalz.2018.02.018 [DOI] [PMC free article] [PubMed] [Google Scholar]
- 30.Jack CR Jr, Bennett DA, Blennow K, et al. A/T/N: an unbiased descriptive classification scheme for Alzheimer disease biomarkers. Neurology. 2016;87(5):539-547. doi: 10.1212/WNL.0000000000002923 [DOI] [PMC free article] [PubMed] [Google Scholar]
- 31.Leuzy A, Smith R, Ossenkoppele R, et al. Diagnostic performance of RO948 F 18 tau positron emission tomography in the differentiation of Alzheimer disease from other neurodegenerative disorders. JAMA Neurol. 2020;77(8):955-965. doi: 10.1001/jamaneurol.2020.0989 [DOI] [PMC free article] [PubMed] [Google Scholar]
- 32.Palmqvist S, Janelidze S, Quiroz YT, et al. Discriminative accuracy of plasma phospho-tau217 for Alzheimer disease vs other neurodegenerative disorders. JAMA. 2020;324(8):772-781. doi: 10.1001/jama.2020.12134 [DOI] [PMC free article] [PubMed] [Google Scholar]
- 33.Jack CR Jr, Wiste HJ, Weigand SD, et al. Defining imaging biomarker cut points for brain aging and Alzheimer’s disease. Alzheimers Dement. 2017;13(3):205-216. doi: 10.1016/j.jalz.2016.08.005 [DOI] [PMC free article] [PubMed] [Google Scholar]
- 34.Pérez-Grijalba V, Fandos N, Canudas J, et al. Validation of immunoassay-based tools for the comprehensive quantification of Aβ40 and Aβ42 peptides in plasma. J Alzheimers Dis. 2016;54(2):751-762. doi: 10.3233/JAD-160325 [DOI] [PMC free article] [PubMed] [Google Scholar]
- 35.Janelidze S, Mattsson N, Palmqvist S, et al. Plasma P-tau181 in Alzheimer’s disease: relationship to other biomarkers, differential diagnosis, neuropathology and longitudinal progression to Alzheimer’s dementia. Nat Med. 2020;26(3):379-386. doi: 10.1038/s41591-020-0755-1 [DOI] [PubMed] [Google Scholar]
- 36.Janelidze S, Stomrud E, Smith R, et al. Cerebrospinal fluid p-tau217 performs better than p-tau181 as a biomarker of Alzheimer’s disease. Nat Commun. 2020;11(1):1683. doi: 10.1038/s41467-020-15436-0 [DOI] [PMC free article] [PubMed] [Google Scholar]
- 37.Mattsson N, Cullen NC, Andreasson U, Zetterberg H, Blennow K. Association between longitudinal plasma neurofilament light and neurodegeneration in patients with Alzheimer disease. JAMA Neurol. 2019;76(7):791-799. doi: 10.1001/jamaneurol.2019.0765 [DOI] [PMC free article] [PubMed] [Google Scholar]
- 38.Van Hulle C, Jonaitis EM, Betthauser TJ, et al. An examination of a novel multipanel of CSF biomarkers in the Alzheimer’s disease clinical and pathological continuum. Alzheimers Dement. 2021;17(3):431-445. [DOI] [PMC free article] [PubMed] [Google Scholar]
- 39.Karikari TK, Pascoal TA, Ashton NJ, et al. Blood phosphorylated tau 181 as a biomarker for Alzheimer’s disease: a diagnostic performance and prediction modelling study using data from four prospective cohorts. Lancet Neurol. 2020;19(5):422-433. doi: 10.1016/S1474-4422(20)30071-5 [DOI] [PubMed] [Google Scholar]
- 40.Jack CR Jr, Wiste HJ, Weigand SD, et al. Different definitions of neurodegeneration produce similar amyloid/neurodegeneration biomarker group findings. Brain. 2015;138(Pt 12):3747-3759. doi: 10.1093/brain/awv283 [DOI] [PMC free article] [PubMed] [Google Scholar]
- 41.Smith R, Schöll M, Leuzy A, et al. Head-to-head comparison of tau positron emission tomography tracers [18F]flortaucipir and [18F]RO948. Eur J Nucl Med Mol Imaging. 2020;47(2):342-354. doi: 10.1007/s00259-019-04496-0 [DOI] [PMC free article] [PubMed] [Google Scholar]
- 42.Rousset OG, Ma Y, Evans AC. Correction for partial volume effects in PET: principle and validation. J Nucl Med. 1998;39(5):904-911. [PubMed] [Google Scholar]
- 43.Mattsson N, Insel PS, Palmqvist S, et al. Increased amyloidogenic APP processing in APOE ɛ4-negative individuals with cerebral β-amyloidosis. Nat Commun. 2016;7:10918. doi: 10.1038/ncomms10918 [DOI] [PMC free article] [PubMed] [Google Scholar]
- 44.Bourgeat P, Doré V, Fripp J, et al. ; AIBL research group . Implementing the centiloid transformation for 11C-PiB and β-amyloid 18F-PET tracers using CapAIBL. Neuroimage. 2018;183:387-393. doi: 10.1016/j.neuroimage.2018.08.044 [DOI] [PubMed] [Google Scholar]
- 45.Young AL, Oxtoby NP, Daga P, et al. ; Alzheimer’s Disease Neuroimaging Initiative . A data-driven model of biomarker changes in sporadic Alzheimer’s disease. Brain. 2014;137(Pt 9):2564-2577. doi: 10.1093/brain/awu176 [DOI] [PMC free article] [PubMed] [Google Scholar]
- 46.Fonteijn HM, Modat M, Clarkson MJ, et al. An event-based model for disease progression and its application in familial Alzheimer’s disease and Huntington’s disease. Neuroimage. 2012;60(3):1880-1889. doi: 10.1016/j.neuroimage.2012.01.062 [DOI] [PubMed] [Google Scholar]
- 47.Vogel JW, Iturria-Medina Y, Strandberg OT, et al. ; Alzheimer’s Disease Neuroimaging Initiative; Swedish BioFinder Study . Spread of pathological tau proteins through communicating neurons in human Alzheimer’s disease. Nat Commun. 2020;11(1):2612. doi: 10.1038/s41467-020-15701-2 [DOI] [PMC free article] [PubMed] [Google Scholar]
- 48.Vogel JW, Mattsson N, Iturria-Medina Y, et al. ; Alzheimer’s Disease Neuroimaging Initiative; Swedish BioFINDER Study . Data-driven approaches for tau-PET imaging biomarkers in Alzheimer’s disease. Hum Brain Mapp. 2019;40(2):638-651. doi: 10.1002/hbm.24401 [DOI] [PMC free article] [PubMed] [Google Scholar]
- 49.Bellec P, Rosa-Neto P, Lyttelton OC, Benali H, Evans AC. Multi-level bootstrap analysis of stable clusters in resting-state fMRI. Neuroimage. 2010;51(3):1126-1139. doi: 10.1016/j.neuroimage.2010.02.082 [DOI] [PubMed] [Google Scholar]
- 50.Braak H, Alafuzoff I, Arzberger T, Kretzschmar H, Del Tredici K. Staging of Alzheimer disease-associated neurofibrillary pathology using paraffin sections and immunocytochemistry. Acta Neuropathol. 2006;112(4):389-404. doi: 10.1007/s00401-006-0127-z [DOI] [PMC free article] [PubMed] [Google Scholar]
- 51.Braak H, Braak E. Neuropathological stageing of Alzheimer-related changes. Acta Neuropathol. 1991;82(4):239-259. doi: 10.1007/BF00308809 [DOI] [PubMed] [Google Scholar]
- 52.Braak H, Thal DR, Ghebremedhin E, Del Tredici K. Stages of the pathologic process in Alzheimer disease: age categories from 1 to 100 years. J Neuropathol Exp Neurol. 2011;70(11):960-969. doi: 10.1097/NEN.0b013e318232a379 [DOI] [PubMed] [Google Scholar]
- 53.Xie L, Wisse LEM, Pluta J, et al. ; Alzheimer’s Disease Neuroimaging Initiative . Automated segmentation of medial temporal lobe subregions on in vivo T1-weighted MRI in early stages of Alzheimer’s disease. Hum Brain Mapp. 2019;40(12):3431-3451. doi: 10.1002/hbm.24607 [DOI] [PMC free article] [PubMed] [Google Scholar]
- 54.Palmqvist S, Janelidze S, Stomrud E, et al. Performance of fully automated plasma assays as screening tests for Alzheimer disease-related β-amyloid status. JAMA Neurol. 2019;76(9):1060-1069. doi: 10.1001/jamaneurol.2019.1632 [DOI] [PMC free article] [PubMed] [Google Scholar]
- 55.Janelidze S, Teunissen CE, Zetterberg H, et al. Head-to-head comparison of 8 plasma amyloid-β 42/40 assays in Alzheimer disease. JAMA Neurol. 2021. doi: 10.1001/jamaneurol.2021.3180 [DOI] [PMC free article] [PubMed] [Google Scholar]
- 56.Akaike H. Likelihood of a model and information criteria. J Econometrics. 1981;16(1):3-14. doi: 10.1016/0304-4076(81)90071-3 [DOI] [Google Scholar]
- 57.Burnham KP, Anderson DR. Model Selection and Multimodel Inference. Springer; 2002. [Google Scholar]
- 58.Pontecorvo MJ, Devous MD Sr, Navitsky M, et al. ; 18F-AV-1451-A05 investigators . Relationships between flortaucipir PET tau binding and amyloid burden, clinical diagnosis, age and cognition. Brain. 2017;140(3):748-763. doi: 10.1093/brain/aww334 [DOI] [PMC free article] [PubMed] [Google Scholar]
- 59.Lowe VJ, Wiste HJ, Senjem ML, et al. Widespread brain tau and its association with ageing, Braak stage and Alzheimer’s dementia. Brain. 2018;141(1):271-287. doi: 10.1093/brain/awx320 [DOI] [PMC free article] [PubMed] [Google Scholar]
- 60.Sanchez JS, Becker JA, Jacobs HIL, et al. The cortical origin and initial spread of medial temporal tauopathy in Alzheimer’s disease assessed with positron emission tomography. Sci Transl Med. 2021;13(577):eabc0655. doi: 10.1126/scitranslmed.abc0655 [DOI] [PMC free article] [PubMed] [Google Scholar]
- 61.Insel PS, Mormino EC, Aisen PS, Thompson WK, Donohue MC. Neuroanatomical spread of amyloid β and tau in Alzheimer's disease: implications for primary prevention. Brain Commun. 2020;2(1):fcaa007. doi: 10.1093/braincomms/fcaa007 [DOI] [PMC free article] [PubMed] [Google Scholar]
- 62.Berron D, Vogel JW, Insel PS, et al. Early stages of tau pathology and its associations with functional connectivity, atrophy and memory. Brain. 2021;144(9):2771-2783. doi: 10.1093/brain/awab114 [DOI] [PMC free article] [PubMed] [Google Scholar]
- 63.Krishnadas N, Dore V, Mulligan R, et al. 18F-MK6240 longitudinal tau PET in ageing and Alzheimer's disease. J Nuclear Med. 2021;62(suppl 1):105. [Google Scholar]
- 64.de Calignon A, Polydoro M, Suárez-Calvet M, et al. Propagation of tau pathology in a model of early Alzheimer’s disease. Neuron. 2012;73(4):685-697. doi: 10.1016/j.neuron.2011.11.033 [DOI] [PMC free article] [PubMed] [Google Scholar]
- 65.Liu L, Drouet V, Wu JW, et al. Trans-synaptic spread of tau pathology in vivo. PLoS One. 2012;7(2):e31302. doi: 10.1371/journal.pone.0031302 [DOI] [PMC free article] [PubMed] [Google Scholar]
- 66.Crary JF, Trojanowski JQ, Schneider JA, et al. Primary age-related tauopathy (PART): a common pathology associated with human aging. Acta Neuropathol. 2014;128(6):755-766. doi: 10.1007/s00401-014-1349-0 [DOI] [PMC free article] [PubMed] [Google Scholar]
- 67.Janelidze S, Berron D, Smith R, et al. Associations of plasma phospho-tau217 levels with tau positron emission tomography in early Alzheimer disease. JAMA Neurol. 2021;78(2):149-156. doi: 10.1001/jamaneurol.2020.4201 [DOI] [PMC free article] [PubMed] [Google Scholar]
- 68.Mattsson-Carlgren N, Janelidze S, Bateman RJ, et al. Soluble P-tau217 reflects amyloid and tau pathology and mediates the association of amyloid with tau. EMBO Mol Med. 2021;13(6):e14022. doi: 10.15252/emmm.202114022 [DOI] [PMC free article] [PubMed] [Google Scholar]
- 69.Mattsson-Carlgren N, Andersson E, Janelidze S, et al. Aβ deposition is associated with increases in soluble and phosphorylated tau that precede a positive Tau PET in Alzheimer’s disease. Sci Adv. 2020;6(16):eaaz2387. doi: 10.1126/sciadv.aaz2387 [DOI] [PMC free article] [PubMed] [Google Scholar]
- 70.Jack CR, Wiste HJ, Weigand SD, et al. Predicting future rates of tau accumulation on PET. Brain. 2020;143(10):3136-3150. doi: 10.1093/brain/awaa248 [DOI] [PMC free article] [PubMed] [Google Scholar]
- 71.Sato C, Barthélemy NR, Mawuenyega KG, et al. Tau kinetics in neurons and the human central nervous system. Neuron. 2018;97(6):1284-1298.e7. doi: 10.1016/j.neuron.2018.02.015 [DOI] [PMC free article] [PubMed] [Google Scholar]
- 72.Ashton NJ, Pascoal TA, Karikari TK, et al. Plasma p-tau231: a new biomarker for incipient Alzheimer’s disease pathology. Acta Neuropathol. 2021;141(5):709-724. doi: 10.1007/s00401-021-02275-6 [DOI] [PMC free article] [PubMed] [Google Scholar]
- 73.Thijssen EH, La Joie R, Strom A, et al. ; Advancing Research and Treatment for Frontotemporal Lobar Degeneration investigators . Plasma phosphorylated tau 217 and phosphorylated tau 181 as biomarkers in Alzheimer’s disease and frontotemporal lobar degeneration: a retrospective diagnostic performance study. Lancet Neurol. 2021;20(9):739-752. doi: 10.1016/S1474-4422(21)00214-3 [DOI] [PMC free article] [PubMed] [Google Scholar]
- 74.Hoskin JL, Sabbagh MN, Al-Hasan Y, Decourt B. Tau immunotherapies for Alzheimer’s disease. Expert Opin Investig Drugs. 2019;28(6):545-554. doi: 10.1080/13543784.2019.1619694 [DOI] [PMC free article] [PubMed] [Google Scholar]
- 75.American Psychiatric Association . Diagnostic and Statistical Manual of Mental Disorders. 4th ed. American Psychiatric Association; 1994. [Google Scholar]
Associated Data
This section collects any data citations, data availability statements, or supplementary materials included in this article.
Supplementary Materials
eMethods 1. Inclusion and exclusion criteria for the Swedish BioFINDER-2 study.
eMethods 2. Inclusion and exclusion criteria for the Swedish BioFINDER-1 study.
eFigure. Overview of the steps involved in the clustering and EBM derived ROIs.
eTable 1. Participant characteristics including A/T/N biomarkers and longitudinal.
tau PET in Aβ-negative MCI and CU and MCI regardless of Aβ status.
eTable 2. Relationship between individual biomarkers and tau PET using EBM ROIs and plasma biomarkers in all CU and MCI independent of Aβ status.
eTable 3. Relationship between individual biomarkers and tau PET using EBM ROIs and CSF biomarkers in all CU and MCI independent of Aβ status.
eTable 4. Relationship between individual biomarkers and tau PET using CSF biomarkers.
eTable 5. Relationship between individual biomarkers and tau PET using EBM ROIs and CSF biomarkers in AD dementia.
eTable 6. Characteristics of Aβ-negative CU individuals used for z-score transformation.
eTable 7. Range of annual percent change values and results of one-sample t-tests across groups and EBM ROIs.
eTable 8. Mean annual percent change in tau PET SUVR using Braak ROIs.
eTable 9. Relationship between individual biomarkers and tau PET using plasma p-tau181.
eTable 10. Relationship between individual biomarkers and tau PET using CSF p-tau181.
eTable 11. Relationship between individual biomarkers and tau PET using Braak I ROI for Aβ-positive CU and Braak III ROI in Aβ-positive MCI.
eTable 12. Relationship between individual biomarkers and tau PET in Aβ-positive CU using transentorhinal SUVR at baseline instead of EBM I baseline SUVR.
eTable 13. Relationship between individual biomarkers and tau PET using EBM ROIs and plasma biomarkers in AD dementia.
eTable 14. Summary of model selection approach for predictors (plasma and imaging) using longitudinal tau PET as outcome in all CU and MCI independent of Aβ status.
eTable 15. Power enrichment analysis of plasma biomarkers in a theoretical clinical trial using tau PET as end point in all CU and MCI independent of Aβ status.
eTable 16. Summary of model selection approach for predictors (plasma and imaging) using longitudinal tau PET as outcome in AD dementia.
eTable 17. Power enrichment analysis of plasma biomarkers in a theoretical clinical trial using tau PET as end point in AD dementia.
eTable 18. BioFINDER-1 participant characteristics including A/T/N biomarkers and longitudinal tau PET.
eTable 19. Relationship between individual biomarkers and tau PET using EBM ROIs and plasma biomarkers in Aβ-positive CU and Aβ-positive MCI from BioFINDER-1.
eTable 20. Relationship between individual biomarkers and tau PET using EBM ROIs and CSF biomarkers in Aβ-positive CU and Aβ-positive MCI from BioFINDER-1.
eReferences.