

Abstract
The severe acute respiratory syndrome coronavirus 2 (SARS-CoV-2) is responsible for millions of deaths around the world. To help contribute to the understanding of crucial knowledge and to further generate new hypotheses relevant to SARS-CoV-2 and human protein interactions, we make use of the information abundant Biomine probabilistic database and extend the experimentally identified SARS-CoV-2-human protein–protein interaction (PPI) network in silico. We generate an extended network by integrating information from the Biomine database, the PPI network and other experimentally validated results. To generate novel hypotheses, we focus on the high-connectivity sub-communities that overlap most with the integrated experimentally validated results in the extended network. Therefore, we propose a new data analysis pipeline that can efficiently compute core decomposition on the extended network and identify dense subgraphs. We then evaluate the identified dense subgraph and the generated hypotheses in three contexts: literature validation for uncovered virus targeting genes and proteins, gene function enrichment analysis on subgraphs and literature support on drug repurposing for identified tissues and diseases related to COVID-19. The major types of the generated hypotheses are proteins with their encoding genes and we rank them by sorting their connections to the integrated experimentally validated nodes. In addition, we compile a comprehensive list of novel genes, and proteins potentially related to COVID-19, as well as novel diseases which might be comorbidities. Together with the generated hypotheses, our results provide novel knowledge relevant to COVID-19 for further validation.
Keywords: COVID-19, Core Decomposition, Network Inference, Data Mining, Graph Theory
1 Introduction
The COVID-19 pandemic, caused by severe acute respiratory syndrome coronavirus 2 (SARS-CoV-2), is a grave threat to public health and the global economy. It has led to more than 224 million confirmed cases and 4.62 million deaths worldwide as of 12 September 2021. SARS-CoV-2 is a newly discovered positive-sense single-stranded RNA virus and belongs to the member of the Coronaviridae (CoV) family [1]. It shares 89.1% and 50% nucleotide similarity to other previously detected human coronaviruses SARS-CoV and Middle East respiratory syndrome coronavirus (MERS-CoV) [2–4], respectively. Previous studies have also shown that they share stronger similarities with respect to their structures and pathogenicity [4]. These provide valuable knowledge to facilitate our understanding of the pathophysiology of SARS-CoV-2. Particularly, we now know that SARS-CoV-2 mainly enters human cells via binding of its spike protein to the angiotensin-converting enzyme 2 (ACE2) receptor [5] and is associated with an extensive immune reaction referred to as ‘cytokine storm’ triggered by the excessive production of interleukin 1 beta (IL-1b), interleukin 6 (IL-6) and others. However, much remains to be explored about how these critical human proteins are involved in the infection and the associated COVID-19 pathology [2], critical toward devising therapeutic strategies to counteract SARS-CoV-2 infection.
In order to investigate the complications and comorbidities of SARS-CoV-2 and to facilitate the search for effective treatment, many studies have been conducted to investigate the host dependencies of the SARS-CoV-2 virus from a systems level. For example, Blanco-Melo et al. performed a comparative transcriptional analysis of COVID-19 patients responding to SARS-CoV-2 and other respiratory viruses, which revealed reduced innate antiviral defenses coupled with exuberant inflammatory cytokine production as the defining and driving features of COVID-19 [6]. Bojkova et al. conducted proteomic analysis to identify the host cell pathways that are modulated by SARS-CoV-2 and showed that inhibition of these pathways prevents viral replication in human cells [7]. Gordon et al. systematically mapped the interaction landscape between SARS-CoV-2 proteins and human proteins using affinity-purification mass spectrometry [8]. They identified 332 high-confidence protein interactions between SARS-CoV-2 viral proteins and human proteins related to various complexes and biological processes (about 40% of human proteins identified to interact with SARS-CoV-2 were associated with endomembrane system or membrane vesicle trafficking). From the presented SARS-CoV-2-human protein–protein interaction (PPI) network the authors identified 62 druggable SARS-CoV-2-interacting human proteins with 69 targeting ligands (drugs). Wei et al. [9] recently conducted genome-wide CRISPR screening and experimentally identified lists of pro/anti-SARS-CoV-2 genes. Stukalov et al. [10] profiled the interactomes of SARS-CoV and SARS-CoV-2 using A549 lung carcinoma cells. Li et al. [11] used genome-wide proteomic screening to identify cellular proteins that interact with SARS-CoV-2 proteins. The works by Gordon et al., Stukalov et al. and Li et al. have been reviewed in [12]. All these studies contributed to a better understanding of the SARS-CoV-2 and host protein interactome, providing insights for the development of therapies for the treatment of COVID-19. However, these studies only revealed different aspects of the potential mechanisms behind SARS-CoV-2 infection at specific conditions and do not bring out into open the comorbidities-, cell- and organ-type-specific human-viral interaction architecture.
To generate new knowledge, various computational approaches were applied to integrate the above experimental results with other information. Perrin-Cocon et al. [13] selected 112 publications including [8] that explicitly reported physical interactions between coronavirus viral and host proteins, and assembled a coronavirus-host interactome. Krämer et al. [14] started from the PPI network identified by Gordon et al. and constructed 70 hypothesis networks using a machine learning algorithm. Gysi et al. [15] conducted research on identifying possible repurposing drugs for COVID-19 through predictive methods and they also retrieved PPIs from [8] and assembled a large human interactome during the process. Sadegh et al. [16] integrated SARS-CoV and SARS-CoV-2 virus–host interaction data from several sources including [8] and developed an online platform that implemented systems medicine algorithms for network-based prediction of drug candidates. As a common integration approach, integrative network analysis provides an efficient way to enable discovery and evaluation of (unknown) connections spanning multiple types of relationships inferred from different omics studies. Khorsand et al. [17] started from the most similar Alpha-influenzavirus proteins to SARS-CoV-2 proteins and constructed a weighted SARS-CoV-2-human PPI network. Messina et al. [18] constructed interactomes for SARS-CoV, MERS-CoV and HCoV-229E and employed random walk with restart (RWR) algorithm to identify the top 200 closest proteins for the selected three human coronaviruses. Zhou et al. [19] and Kumar et al. [20] have applied similar ideas to perform the integrative network analysis for elucidating the molecular mechanisms of SARS-CoV-2 pathogenesis.
To generate new hypotheses, we present a data analysis pipeline of integrative network analysis. Our work is different from most of the other methods, because we integrate experimentally validated results with a ‘large’ ‘probabilistic’ network. Analyzing ‘probabilistic’ networks increased the difficulty of the algorithm, but it can better incorporate the uncertainty in real world. To make sense of a ‘large’ network, we need to focus on a small subset of important nodes and discard the rest of the nodes. In this work, we aim to identify high-connectivity sub-communities (connected to the experimentally validated results) from the integrated dataset since our fundamental assumption is that members in such sub-communities play more important roles in the network [20]. Specifically, in this work, we integrate the SARS-CoV-2 viral-human protein interaction (PPI) network [8], experimentally identified lists of pro/anti-SARS-CoV-2 genes [9], and a large probabilistic biological network called Biomine [21, 22]. Biomine integrates several databases including PubMed [23], UniProt [24], STRING [25], Entrez Gene [23, 26] and InterPro [27]. Many biological networks can be represented using probabilistic graph structures due to the intrinsic uncertainty present in their measurements. For instance, the edges in PPI networks obtained through laboratory experiments are often prone to measurement errors. The edges are often labeled with uncertainty levels that can be interpreted as probabilities. We aim to mine these probabilistic graphs to enhance our understanding of the SARS-CoV-2 and human protein interactions and to further aid the discovery of the essential/unknown knowledge relevant to the interactions between hosts and SARS-CoV-2 virus. The crux of our approach is to use a core decomposition strategy that detects highly connected sub-communities. Unlike other notions of cohesive subgraphs, e.g. cliques, n-cliques, k-plexes, which are all NP-hard to compute, k-core can be computed in polynomial time [28–30]. The goal of k-core computation is to identify the largest induced subgraph of a graph G in which each vertex is connected to at least k other vertices. The set of all k-cores of G forms the core decomposition of G [31]. The coreness (core number) of a vertex v in G is defined as the maximum k such that there is a k-core of G containing v. For an example of core decomposition, see Figure 1. For probabilistic graphs, the notion of core decomposition evolves into the more challenging probabilistic core decomposition. In this study, we connect the Biomine network to the small PPI network identified by Gordon et al. [8] and we integrate our previously proposed graph peeling algorithm [30] for probabilistic core decomposition and proposed an analysis pipeline to detect the probabilistic coreness in data, finding the high-connectivity sub-communities, and generate hypotheses on COVID-19 relevant bio-networks. The proposed analysis pipeline also supports integrating other experimentally validated results.
Figure 1 .

Core decomposition for an example graph.
Specifically, from the results, we are particularly interested in dense cores (cores with high core number) in the Biomine database that overlap with the PPI network (and other integrated experimentally validated results) as much as possible. The dense cores in a different region of the Biomine network that do not overlap with the experimentally validated results are not of interest to us.
In short, our contributions are as follows.
Pipeline on k-core decomposition and bio-network analysis. A two-stage data screening procedure was added to the peeling algorithm (PA), making it focus more on cores with higher density. Overall, the pipeline consists of three steps: data preprocessing, PA and functional enrichment analysis on the generated networks.
Evaluation through literature mining and gene set enrichment analysis. We evaluated the extended COVID-19 biological network in three contexts: literature support for identified tissues and diseases related to COVID-19, literature validation for uncovered SARS-CoV-2 targeting genes and proteins and gene ontology (GO) over-representation test on the selected network for biological processes linked with RNA processing and viral transcription.
COVID-19 hypotheses generation. We discovered novel diseases that might be comorbidities, genes and proteins that could potentially relate to COVID-19, and we presented them as top candidates for future validation.
2 Methods and materials
2.1 Biomine database and SARS-CoV-2-host PPI network
The Biomine database is a large probabilistic biological network constructed using selected publicly available databases, for example, Entrez Gene, UniProt, STRING, InterPro, PubMed, Gene Ontology (GO), etc. The full Biomine database has 1 508 587 nodes, 32 761 889 edges and contains biology information of several species including humans. The SARS-CoV-2-host PPI network, identified by Gordon et al. [8], contains 360 nodes (27 SARS-CoV-2 viral proteins and 333 human proteins1) and 695 edges. Since we are working with Homo sapiens data, as a preliminary stage of data screening, we select a subset of the full Biomine database, the human organism as the database to be used to extend the PPI network. This will eliminate approximately 43% of the full Biomine database. The human Biomine database contains 861 812 nodes, 8 666 287 edges, and each entry possesses the form  . Here,
  and
and  are two nodes forming an edge in the network,
  is the link type describing the relationship between the two nodes,
  is computed based on relevance, informativeness and reliability [21], and is interpreted as the probability that the edge exists. A small sample from the human Biomine database is presented in Table S1 in Supplementary Methods.
We then extend the PPI network with the human Biomine database and deal with duplicated entries and loops. For a detailed overview of the extension of SARS-CoV-2 and host PPI network as well as duplicates/loops removal illustration, see relevant section and Figure S1 in Supplementary Methods. As mentioned before, since Wei et al. [9], Stukalov et al. [10] and Li et al. [11] also recently experimentally validated lists of pro/anti-SARS-CoV-2 genes and viral-host PPI networks, we integrate the findings of [9] in our research and retain [10, 11] for validations. Details of this analysis can be found in later sections including the data analysis pipeline section and validation from independent evidence section.
2.2 Definition of probabilistic core decomposition
Consider a probabilistic graph  where
where  is the set of vertices,
  is the set of edges and
  is a mapping function that aligns each edge
  to its existence probability
  . Given a vertex
  , let
, let  be the number of edges incident on
  . Each possible world G (
 ) is a deterministic version of
  in which a subset
  of edges appear. Let
  be a random variable with values in
  , and distribution:
 |
(1) |
where  is an indicator function which takes on 1 if
  has degree equal to
  in the possible world
  .
.  -degree of vertex
  , denoted by
  -deg(
-deg( ), where
  , is defined as the highest
  for which
  [28, 30].
For the  -core of probabilistic graph
  , we use the definition given by [28]: the
  -core of probabilistic graph
  is the maximal induced subgraph
  where the
  -deg(
-deg( ) for each
  is at least
  . The largest
  for which
  is a part of a
  -core is called
  -core number or probabilistic coreness of
  . The set of all
  -cores is the unique core decomposition of
  and follows the following relation [30]:
 |
(2) |
where  is the maximum probabilistic coreness of any vertex in
  . For simplicity, we will use core number and coreness instead of
  -core number/probabilistic coreness in the rest of the paper. Additionally, we use dense to describe cores with high core numbers.
2.3 Data analysis pipeline
The Biomine database contains abundant biological information. Though we used the smaller human Biomine database, after extending it with the SARS-CoV-2-host PPI network the resulting network is still enormous and hard to reason. To make sense of such a huge network, we propose a data analysis pipeline with three steps described below. An illustration of the workflow of data processing and analysis pipeline can also be found in Figure 2. Pseudocode with more details of the data analysis pipeline can be found in Algorithm S1 in Supplementary Methods.
Figure 2 .

Workflow of data processing and analysis pipeline.
2.3.1 Step 1: Data preprocessing
The data preprocessing step contains three sub-steps: screening based on degree expectation, screening based on lower-bounds of  -degree and nodes retaining. The goal of this data preprocessing step is to reduce the nodes in the network and speed up the follow-up analyses. Specifically, we remove large proportions of nodes with too low connectivity (i.e. vertices with small
  -degree) to be members of dense sub-communities in the network.
Here, we start with the first sub-step and we briefly explain the methodology and the rationale behind it. For each vertex  , we have a set of edges incident to
  and each edge is accompanied with a probability of existence
  that is independent of other edge probabilities in
  . Given a probabilistic graph
  , and a vertex
  ,
,  can be interpreted as the sum of a set of independent Bernoulli random variables
  ’s with different success probabilities
  ’s [30] where:
 |
(3) |
and  follows Poisson binomial distribution with
  .
.  therefore can be seen as an approximation to
  so we use
  as the first screening criteria. As thresholds are user-defined, any positive integer greater or equal to 0 is accepted but it is recommended that the first threshold is larger than 5 (if the first threshold is set to 5 it means any nodes with an expectation of degree less than 5 is removed, e.g. only nodes with
  are kept). The goal of this step is to remove nodes that are rarely connected with others and hence are not eligible to be part of any highly connected sub-network. For example, if a vertex
  has
has  less than 5, it means that
  will also likely be around 5 with slight variations, and hence
  will not appear in cores with high activities (e.g. vertices with high coreness). If the first threshold is set lower, more nodes are retained. To speed up subsequent analyses, the threshold value should be high enough, yet it cannot be so high that possible highly connected nodes are removed. In our experiment, we empirically choose a conservative number, 5, as the first threshold, but other threshold values could be used.
For our merged dataset, 33 918 nodes passed the screening.
Now, we introduce the second step of data prepossessing. For the nodes that passed the first stage of data screening, we calculate lower-bounds of their  -degree using Lyapunov Central Limit Theorem (CLT) implemented in PA. We select 10 as the passing threshold (e.g. if a node has
  -degree lower-bound greater than or equal to 10, we keep it, otherwise it will be removed). The rationale is if a vertex has at least 10 edges incident to it before peeling, we can consider it a hotspot suited for the afterward high activity subgraph mining. If in the full network a node is not connected to at least 10 other nodes, there is no point in performing core decomposition as we only focus on dense sub-communities. Note that as we start the peeling process, the node’s
  -degree will also start decreasing, so in this last data filtering stage, we only select nodes based on their initial
  -degree lower-bound.
There are many nodes in Biomine that can be directly connected to the PPI network, which are potentially more useful than other nodes. In the nodes retaining step, we force them to not be screened out and let downstream analyses decide whether they are useful.
Besides the PPI network, we also treat the list of experimentally validated genes [9] as ground truth and retain their mapped nodes for downstream analysis without the data screening steps. Wei et al. [9] selected the top and bottom 250 genes from their sorted gene list for analysis so we also select these 500 genes in our research. We map the selected list of genes to its corresponding UniProt indexes in Biomine. When UniPort index is not available, STRING index is used and those that still failed to map are discarded. Eventually, 439 of the genes are mapped and integrated into our research. There is an overlap of eight nodes between the PPI network by Gordon et al. and the CRISPR screened gene list by Wei et al. after mapping. In total, we obtained 791 experimentally validated ground truth nodes.
In the merged dataset, 30 839 unique Biomine nodes are directly connected to the nodes in the PPI network and nodes in the selected CRISPR screened gene list (a total of 31 630 nodes). To preserve valuable information, we retain them from data screening. All other nodes in the human Biomine database that are not directly connected to the ground truth nodes will be subject to the two data screening steps.
After this step, a total of 46 033 nodes remained in our dataset and the filtered dataset was passed to PA for probabilistic core decomposition with  set to 0.5. For a discussion on different settings of
  , see Discussion section.
2.3.2 Step 2: Peeling algorithm to find coreness of nodes
In this section, we briefly describe the graph peeling algorithm (PA) introduced by [30].
As mentioned before,  -deg(
-deg( ) is defined as the highest
  for which
  . In [30], Lyapunov CLT is applied to approximate
  and find the largest
  such that
  . They showed that Lyapunov CLT can produce a very accurate lower-bound on vertex’s true
  -degree. Since the lower-bound is easy to compute, it helps reduce PA’s running time significantly.
To summarize PA, it first computes the lower-bound on the  -degree for each vertex using Lyapunov CLT, then it stores vertices in an array in ascending order of their lower-bound values. Then, the algorithm starts processing vertices based on their (lower-bound on)
  -degree. When a vertex
  is being processed, PA algorithm determines whether
  ’s exact
  -degree is available or
  is on its lower-bound. If the former criteria holds, PA sets
  ’s coreness to be equal to its
  -degree at the time of process, removes
  , and decreases the
  -degree (exact or lower-bound) of
  ’s neighbors by one. Otherwise, if
  is on its lower-bound,
  ’s exact
  -degree is computed and
  is swapped to the proper place in the array. At the end,
  -core of
  is obtained by collecting all the vertices with coreness at least
  . Note that for efficiency reasons, (1) lower-bounds are used in the main parts of PA where
  -degree values are required, and only when a vertex becomes a candidate for removal the exact
  -degree is calculated, (2) after removing a vertex
  , the step of updating the
  -degree of
  ’s neighbors is delayed as much as possible (lazy updates strategy).
2.3.3 Step 3: Functional enrichment analysis
Pathway analysis could prove crucial in understanding how the virus infects the human body [7]. To evaluate functional pathways of proteins involved in SARS-CoV-2 host interactions from the core decomposition result of PA, gene enrichment analysis was performed using clusterProfiler [32] and Metascape [33].
P-values were calculated by hypergeometric test [34], adjusted using Benjamini–Hochberg procedure [35], and adjusted P-value < 0.01 were used as the threshold of significance to control the false-discovery rate. We also performed DAVID functional annotation clustering [36, 37] on selected subgraphs. Since Metascape and DAVID both restrict input gene list size up to 3000, if our list exceeds that number, we will select the top 3000 nodes based on their connections to the integrated experimentally validated nodes. For UniProt indexing nodes, we select UNIPROT_ACCESSION as the gene list identifier. Everything else is kept as default.
3 Results
We merged the original SARS-CoV-2-host PPI network [8] with the human Biomine database and we removed duplicated and looped edges in the merged dataset. We also integrated the experimentally validated pro/anti-SARS-CoV-2 gene lists by Wei et al. [9]. We then passed the merged dataset through our proposed analysis pipeline. Approximately 5.3% of nodes remained after data screening and the algorithm revealed the presence of 88 cores. More specifically, the nodes that remained in the filtered dataset yielded 79 different coreness values ranging from 0 to 88. Many node types exist in the filtered dataset, for example, UniProt, STRING, PubMed, GO (including indexes for biological process, cellular component, molecular function), etc. Approximately 11.35% of nodes were assigned coreness 1 and 2, which accounts for 2685 nodes and 2539 nodes, respectively. The 791 experimentally validated nodes (including the original SARS-CoV-2-human PPI network and the pro/anti-SARS-CoV-2 gene lists by Wei et al.) were distributed across 74 different coreness with minimum coreness of 1 and maximum coreness of 88. The nodes that were directly connected to the experimentally validated nodes (we refer to them as level 1 connections) had similar node count distribution with roughly 16.88% nodes assigned with coreness 1 and 2, followed by coreness 77 that contains 2108 ( 6.84%) nodes.
Table 1 shows the top-10 coreness values in terms of node count for the three scenarios: experimentally validated nodes, level 1 connections and complete nodes set. As can be seen from Table 1, core 69 and core 77 are the two most frequently appeared denser cores that contain a significant fraction of nodes. As indicated before in Equation 2, the denser cores are at the same time among the smaller cores, so we further merged all cores that are denser than 68 (i.e. coreness 69, 70, 71, 72, 73, 74, 75, 76, 77, 88) into a giant subgraph to avoid losing potential connections as well as the corresponding information between cores.
Table 1.
Top-10 coreness values revealed by peeling algorithm (sorted by node count)
| Experimentally validated | Level 1 connections | All nodes |
|---|---|---|
| nodes (coreness(count)) | (coreness(count)) | (coreness(count)) |
| 69(78) | 1(2675) | 1(2685) |
| 77(71) | 2(2532) | 2(2539) |
| 88(20) | 77(2108) | 77(2179) |
| 48(18) | 3(1526) | 9(2086) |
| 64(17) | 4(1077) | 10(2035) |
| 11(16) | 69(828) | 11(1756) |
| 62(15) 22(15) | 5(824) | 12(1594) |
| 59(14) 12(14) | 10(807) | 3(1544) |
| 54(13) 38(13) 29(13) 19(13) | 9(797) | 8(1512) |
| 63(12) 49(12) 23(12) | 7(756) | 14(1509) |
In the table, for duplicated node counts, we display all matching coreness.
The resulting subgraph contains 3625 nodes and 2 025 378 edges. By definition, the merged subgraph is the same as core 69 (it contains nodes with coreness 69 and above). Among these 3625 nodes, a total of 179 nodes are experimentally validated and 57 ( 17.12%) SARS-CoV-2 interacting human proteins identified by Gordon et al. [8] can be found in the subgraph. The other 3446 nodes are all level 1 connections. In addition, a majority of nodes (3485,
  96.14%) in the subgraph are proteins labeled with corresponding UniProt ID. A complete dissection of node types for the subgraph can be found in Table S2 in Supplementary Methods.
3.1 SARS-CoV-2 associating genes discovery
We hypothesized that other protein nodes connected with the reported 57 SARS-CoV-2 interacting human proteins in different cores within the subgraph may contain potential missing connections from the single experiment, and provide novel molecular components for better understanding the pathogenicity of SARS-CoV-2 infection which will eventually be beneficial for identifying new biological/pharmaceutical targets.
We first explored the distribution of the 57 SARS-CoV-2 interacting human proteins in the merged subgraph, and observed that 27 of them has coreness 69, two of them has coreness 71, one of them has coreness 73, 20 of them has coreness 77 and seven belongs to core 88 with coreness 88 assigned (Table 2). Since our goal is to extend the integrated experimentally validated results (we mainly want to focus on the SARS-CoV-2-human PPI network found by Gordon et al.) and generate more research hypotheses, in the merged subgraph (the extended network), all the nodes not belonging to the original PPI network or the pro/anti-SARS-CoV-2 gene lists can be considered as generated hypotheses. We then try to identify the hypotheses that had already been studied by other researchers. From the subgraph, we obtained 3306 UniProt indexing nodes that are directly connected to the 179 experimentally validated nodes. We further ranked these 3306 nodes by their connections to the reported experimentally validated results (we will refer to this number as nConnect, the complete ranked list can be found in Table S7 in Supplementary Result) and performed literature mining on their associations/correlations with COVID-19. After an automatic web crawling followed by manual inspection, we identified 306 nodes ( 9.26%) that show associations or correlations with COVID-19 supported by at least one study. Among the 306 literature-verified nodes, 68 of them has coreness 69, 193 of them has coreness 77 (in total,
  of literature-verified nodes were either assigned coreness 69 or coreness 77, a complete plot on coreness distribution is shown in Figure S2 in Supplementary Methods). As mentioned before, cores 69 and 77 are the most frequently appeared cores and showed denser sub-communities compared with others in different contexts in Table 1. And for the 57 SARS-CoV-2 interacting human proteins in core 69, 47 of them (
 82.46%) either have coreness 69 or coreness 77. We believe these findings support our assumption that more valuable information can be found in dense sub-communities and we move on to explore the criteria for high quality hypothesis (i.e. hypothesis that most likely to be true).
Table 2.
Node distribution of the merged subgraph
| Coreness | Total number of nodes | Total number of |
|---|---|---|
| PPI network nodes | ||
| 69 | 906 | 27 |
| 70 | 56 | 0 |
| 71 | 61 | 2 |
| 72 | 46 | 0 |
| 73 | 54 | 1 |
| 74 | 10 | 0 |
| 75 | 21 | 0 |
| 76 | 38 | 0 |
| 77 | 2179 | 20 |
| 88 | 254 | 7 |
Table 3 lists the top genes and encoded proteins that are connected to more than half of the integrated experimentally validated nodes in the subgraph, ranked by nConnect. Over 20% of nodes in Table 3 received literature supports. Therefore, we consider nodes in Table 3 to be high quality hypotheses compared to the rest of the nodes in the subgraph, and we recommend researchers start validating them first. The subgraph node list and the complete list of nodes that received literature supports can be found in Tables S3 and S4 in Supplementary Result. A detailed discussion on the literature-supported nodes in Table 3 can be found in the Discussion section.
Table 3.
Discovered top genes potentially related to COVID-19
| Gene Name | UniProt ID | nConnect | References (‘etc.’ means found  references) references) |
|---|---|---|---|
| UBA52 | P62987 | 131 | − |
| PRDM10 | Q9NQV6 | 130 | − |
| GAPDH | P04406 | 124 | [42–44] |
| ASH1L | Q9NR48 | 121 | − |
| DICER1 | Q9UPY3 | 120 | [45] |
| SRC | P12931 | 118 | [46–49] |
| POLR2A | P24928 | 117 | − |
| POTEF | A5A3E0 | 117 | − |
| EHMT2 | Q96KQ7 | 116 | − |
| RIPK4 | P57078 | 116 | − |
| POLR2B | P30876 | 115 | − |
| EHMT1 | Q9H9B1 | 114 | − |
| ACTB | P60709 | 114 | − |
| SMARCA2 | P51531 | 114 | − |
| GSK3B | P49841 | 114 | [50–53] |
| TOP2A | P11388 | 113 | − |
| HSPA4 | P34932 | 113 | − |
| UBC | P0CG48 | 112 | [54] |
| PIKFYVE | Q9Y2I7 | 111 | − |
| ABL1 | P00519 | 111 | [55] |
| JAK2 | O60674 | 110 | [56–64], etc. |
| TOP2B | Q02880 | 110 | − |
| MTOR | P42345 | 109 | [65–74], etc. |
| PIK3CA | P42336 | 109 | − |
| XPO1 | O14980 | 109 | − |
| CDC27 | P30260 | 108 | − |
| NFKB1 | P19838 | 107 | − |
| HRAS | P01112 | 107 | − |
| HACE1 | Q8IYU2 | 107 | − |
| CDK1 | P06493 | 107 | − |
| AKT1 | P31749 | 106 | [48, 75–78] |
| PCNA | P12004 | 106 | − |
| PIK3CG | P48736 | 106 | − |
| LRRK2 | Q5S007 | 106 | − |
| JAK1 | P23458 | 105 | [58–60, 62, 79–83], etc. |
| UBB | P0CG47 | 104 | − |
| HSP90AA1 | P07900 | 104 | [84] |
| FYN | P06241 | 104 | − |
| PHLPP1 | O60346 | 104 | − |
| RANBP2 | P49792 | 104 | − |
| ZDHHC17 | Q8IUH5 | 103 | − |
| MAPK1 | P28482 | 103 | − |
| CDK4 | P11802 | 103 | − |
| PIK3CB | P42338 | 102 | − |
| DDX5 | P17844 | 102 | − |
| HSPA8 | P11142 | 102 | [85] |
| POTEJ | P0CG39 | 102 | − |
| POTEE | Q6S8J3 | 102 | − |
| POTEI | P0CG38 | 101 | − |
| RPS27A | P62979 | 101 | − |
| IGF1R | P08069 | 101 | [86] |
| KIT | P10721 | 101 | − |
| PTEN | P60484 | 100 | − |
3.2 Gene ontology over-representation analysis
We first performed an enrichment test of gene ontology (GO) biological process for genes that encode all of the UniProt indexing nodes in the subgraph using the enrichGO function of clusterProfiler package in R with default parameters [32]. The top 30 GO terms with the smallest adjusted P-value were presented in Figure 3. The most significant GO term is protein polyubiquitination (adjusted P-value  ), which accounts for 204 of the total 3352 mapped input genes (
 6.09%), followed by ribonucleoprotein complex biogenesis (adjusted P-value
  ). The top enriched term might suggest that SARS-CoV-2 hijacks cell’s ubiquitination pathways for replication and pathogenesis, which is one of the findings of [8]. Interestingly, the virus-associated biological processes viral gene expression and viral transcription were also found to be enriched and account for about 3.73% and 3.49% of input eligible gene set, respectively. In addition, we noted that 10 out of the top 30 GO terms were RNA-related. For example, mRNA catabolic process (6.06% of total input eligible genes), RNA catabolic process (6.38%) and nuclear-transcribed mRNA catabolic process, nonsense-mediated decay (3.04%) were the top items. This is in line with Gordon’s study where they found SARS-CoV-2 proteins NSP8 and N involved in RNA processing and regulation [8].
Figure 3 .

Top GO terms of all mapped UniProt indexing nodes in the subgraph ranked by GeneRatio.
We further used Metascape v3.5-210201 [33] to perform pathway and process enrichment analysis on UniProt indexing nodes with different coreness. Two subsets showed significant enrichment in the molecular functions of immune response to bacteria or viruses. Specifically, 5.77% protein-encoding genes with coreness 70 enriched the term The human immune response to tuberculosis and other 5.77% genes enriched the term regulation of viral process, see Figure 4-(a) for other relevant enriched items (negative regulation of protein kinase activity, Signaling by Receptor Tyrosine Kinases, etc.). Regarding UniProt indexing nodes with coreness 73, network enrichment analysis using Metascape returned a few significant modules (Figure 4 -(b)). Interestingly, G2/M DNA damage checkpoint is found to be the top enriched term which is consistent with the observations from recent studies. For instance, Garcia Jr. et al. [38] detected key proteins involved in cellular signaling pathways mTOR-PI3K-AKT, ABL-BCR/MAPK and DNA-damage response that are critical for SARS-CoV-2 infection, and further they identified DNA-damage response inhibitor as potent blocker of SARS-CoV-2 replication. Bouhaddou et al. [39] infected Vero E6 cells with SARS-CoV-2 and observed a significant increase in the fraction of cells at the G2/M transition phase. Gordon et al. [8] found that SARS-CoV-2 NSP1 protein interacts with all four members of the DNA polymerase alpha complex, which couples DNA replication with DNA-damage response [40]. Additionally, Blanco-Melo et al. [6] found the excessive expression of cytokine as one of the strong features of SARS-CoV-2 infection; here we are able to find several terms that are related to cytokine storm induced by SARS-CoV-2 (see Figure 4-(b) for details). For instance, IL-4 Signaling Pathway and Cytokine Signaling in Immune system are related to cytokine storm upon virus infection. Particularly, IL-4 is one kind of cytokine that acts as a regulator of the JAK-STAT pathway and contributes to human body immune responses [41].
Figure 4 .

Metascape enrichment results for coreness 70 and 73. (a) Top biological terms (pathway, process, etc.) enriched for coreness 70 ranked by P-values (b) Network of enriched terms for coreness 73 colored by cluster ID, nodes shared the same cluster ID typically lie close together. Node size is proportional to P-value significance.
3.2.1 SARS-CoV-2 interacts with tyrosine-related proteins
Bouhaddou et al. [39] found changes in activities for 97 out of 518 human kinases during SARS-CoV-2 virus infection. Surprisingly, among the 97 kinases list they discovered, 76 were found in our merged subgraph ( 78.35%). This motivated us to check for all the 321 kinases-related UniProt indexing nodes in our subgraph (the complete list of kinases-related nodes can be found in Table S5 in Supplementary Result). Interestingly, 85 of them are tyrosine-related nodes (
 26.48%). As mentioned previously, we found 306 out of the 3306 UniProt indexing level 1 connections (
 9.26%) in the merged subgraph that had at least one study showing they have some relations with COVID-19. When we restrict to tyrosine-related proteins, this proportion increased more than 3-fold to 28.24% (Table 4). That is, 24 of the 85 tyrosine-related proteins (Table S6 in Supplementary Result) in the merged subgraph have been explored for their associations with SARS-CoV-2 virus, including SRC, JAK1, JAK2, IGF1R, ABL1, TYRO3, etc. The high proportion of validated tyrosine-related proteins further motivated us to perform a DAVID functional annotation clustering [36, 37] on level 1 connections UniProt indexing nodes in core 69 (the merged subgraph). In total, 341 clusters were identified and the term Tyrosine-protein kinase (fold-change = 5.1, P-value =
  ) is among the top 10 clusters ranked by enrichment score (the DAVID analysis report can be found in Supplementary Report). Of particular importance, SRC, JAK1, JAK2, ABL1 are among the top of the list with large connections to the integrated experimentally validated nodes (Table S7 in Supplementary Result). Since our main focus is the PPI network found by Gordon et al., in Figure 5 we presented a complete PPI network between tyrosine-protein kinase SRC, JAK1/2, ABL1/2 and their connections to the SARS-CoV-2 interacting human proteins in the subgraph. We also include the SARS-CoV-2 viral proteins (red diamond) from the original PPI network. This network covered half (n = 13) of the 27 SARS-CoV-2 viral proteins, including envelope (E), NSP7, NSP9, ORF10, etc. It showed these five proteins were not directly interacting with the virus but at level one connections where SRC, JAK1/2 and ABL1/2 are hub nodes and connect with each other (connection degree being 42, 37, 37, 36 and 29, respectively).
Table 4.
All tyrosine-related proteins in the subgraph that received literature support
| UniProt ID | Gene Name | Protein Name |
|---|---|---|
| P12931 | SRC | Proto-oncogene tyrosine-protein kinase SRC |
| P23458 | JAK1 | Tyrosine-protein kinase JAK1 |
| O60674 | JAK2 | Tyrosine-protein kinase JAK2 |
| P08069 | IGF1R | Insulin-like growth factor 1 receptor |
| P00519 | ABL1 | Tyrosine-protein kinase ABL1 |
| Q06418 | TYRO3 | Tyrosine-protein kinase receptor TYRO3 |
| P17948 | FLT1 | Vascular endothelial growth factor receptor 1 |
| P35968 | KDR | Vascular endothelial growth factor receptor 2 |
| P08581 | MET | Hepatocyte growth factor receptor |
| P36888 | FLT3 | Receptor-type tyrosine-protein kinase FLT3 |
| P29597 | TYK2 | Non-receptor tyrosine-protein kinase TYK2 |
| P07333 | CSF1R | Macrophage colony-stimulating factor 1 receptor |
| Q06187 | BTK | Tyrosine-protein kinase BTK |
| P16234 | PDGFRA | Platelet-derived growth factor receptor alpha |
| P42684 | ABL2 | Tyrosine-protein kinase ABL2 |
| P42680 | TEC | Tyrosine-protein kinase TEC |
| P43405 | SYK | Tyrosine-protein kinase SYK |
| Q08881 | ITK | Tyrosine-protein kinase ITK/TSK |
| P30530 | AXL | Tyrosine-protein kinase receptor UFO |
| Q12866 | MERTK | Tyrosine-protein kinase MER |
| P00533 | EGFR | Epidermal growth factor receptor |
| P04626 | ERBB2 | Receptor tyrosine-protein kinase ErbB-2 |
| Q9Y463 | DYRK1B | Dual specificity tyrosine-phosphorylation-regulated kinase 1B |
| O14733 | MAP2K7 | Dual specificity mitogen-activated protein kinase kinase 7 |
Figure 5 .

SARS-CoV-2 protein interaction with Tyrosine-protein kinase JAK1/2, ABL1/2, SRC. The dashed edges indicate the proteins that do not belong to the identified subgraph.
Additionally, we ranked all the nodes in the merged subgraph by their degrees and investigated the top 5% of the sorted nodes (181 out of 3625 nodes, Table S3 in Supplementary Result). There are 102 ‘kinase’ protein nodes and 53 of them are ‘Tyrosine-protein kinase’. Among the 53 tyrosine-related nodes, the top ranking ones were SRC (ranked 5 out of 181), ABL1 (ranked tie at 19 out of 181) and JAK2 (ranked 22 out of 181) with degree connection 2687, 2483 and 2477, respectively. Take together, evidence obtained so far highly implied that SRC, ABL1 and JAK2 are three important hub genes.
3.3 COVID-19 related tissues and diseases discovery
Through the 332 human viral-interacting proteins across different tissues, Gordon et al. [8] identified lung as the tissue with the highest level of differential expression of the SARS-CoV-2 interacting human proteins. They also found 15 other tissues with a high abundance of SARS-CoV-2 human interacting proteins. In our subgraph, we were able to locate five out of the top 16 tissues identified by [8]: lung (coreness = 69), testis (coreness = 69), placenta (coreness = 69), liver (coreness = 69) and brain (coreness = 77). Curiously, we also discovered two diseases that seem to be associated with COVID-19 within the subgraph (Table S in Supplementary Result): cervix carcinoma (coreness = 70) and erythroleukemia (coreness = 69). Figure 6-(a) presents a network consisting of the five identified tissue nodes, two disease nodes and 2988 UniProt indexing nodes that directly connect to tissue nodes and disease nodes in the subgraph (an interactive version of the network can be found in our GitHub repository, and also in Supplementary Result). A total of 54 out of the 57 reported SARS-CoV-2 interacting human proteins can be found in this network. Figure 6-(b) shows the interaction between the 54 SARS-CoV-2 interacting human proteins and the tissue and disease nodes identified in the subgraph under a higher resolution. Similar to what Gordon et al. [8] found, lung, testis, placenta, liver and brain are heavily involved during SARS-CoV-2 infection. For example, the HDAC2 protein, which is observed to be expressed in testis, lung, overexpressed in cervical cancer, etc., has been identified by Gordon et al. to be associated with the SARS-CoV-2 NSP5 protein. We noted that the same SARS-CoV-2 interacting human proteins are also expressed in cervix carcinoma and erythroleukemia in the sub-graph. We hypothesized drugs used to treat these two diseases might be useful to treat COVID-19.
Figure 6 .
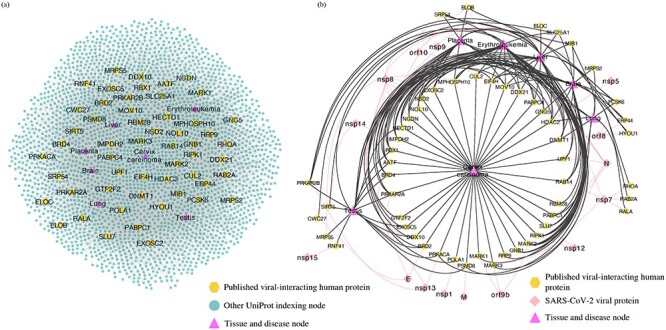
Interactions between tissue, disease and UniProt indexing nodes in the subgraph. All of the edges have is_expressed_in as edge relationship type. (a) Interaction map between UniProt indexing nodes, identified tissue nodes and disease nodes (b) Association between SARS-CoV-2 host interacting proteins and tissue/disease nodes in core 69, we add SARS-CoV-2 viral proteins (red diamond with dashed links, indicating they do not exist in the subgraph) for clarity.
Idarubicin, daunorubicin and cytarabine are the three drugs used to treat erythroleukemia. Chandra et al. [87] suggest idarubicin as a potential drug that can be repurposed for controlling SARS-CoV-2 infection due to its good binding affinity to SARS-CoV-2 NSP15 encode endoribonuclease enzyme.
Bevacizumab is used to treat cervix carcinoma. According to Rosa et al. [88], there have been clinical trials about repositioning bevacizumab for COVID-19. In addition, Amawi et al. and Zhang et al. [89, 90] identified bevacizumab as one of the promising therapeutic treatments against COVID-19.
3.3.1 Validation from independent evidence
To validate our generated hypotheses with independent evidence, we compared them with results obtained through both computational and experimental approaches. The consistent parts are considered as independent evidence of each other, whereas the non-overlap parts in our result can be considered as novel findings. It is worth noting that our work is the only one that starts with probabilistic networks and performed integrative network analysis.
First, to investigate how our results relate or overlap with the results obtained by other computational approaches, we compared our generated hypotheses with their presented SARS-CoV-2-related interactomes, proteins and PPIs. Perrin-Cocon et al. [13] assembled a coronavirus-host interactome and 325 (28.63%) of the total 1135 human proteins mapped to UniProt database within the constructed network can be found in our merged subgraph. Krämer et al. [14] constructed 70 hypothesis networks using a machine learning algorithm and 197 (37.31%) of the 528 proteins mapped to Homo sapiens UniProt database can be found in our merged subgraph. Gysi et al. [15] searched extensively in the literature and public databases to assemble a large human interactome with the goal of identifying possible COVID-19 repurposing drugs. Their constructed interactome contains 17 349 proteins that can be mapped to Homo sapiens UniProt database which results in a huge overlap (3320 proteins) with our merged subgraph. However, there are still 165 (4.74%) UniProt indexing nodes in our subgraph that they are not able to identify despite their extensive search in literature. Sadegh et al. [16] developed an online platform that implemented systems medicine algorithms for network-based prediction of drug candidates. Using the 332 viral-interacting human proteins identified by Gordon et al. [8] as input to their default Multi-Steiner algorithm for drug target discovery with default parameters we obtained a total of 393 human proteins, with 332 being the original human proteins in the input. In the rest of 61 proteins, 29 (47.54%) can be found in our merged subgraph. In addition, Khorsand et al. [17] constructed a three-layer SARS-CoV-2-human PPI network using Alpha-influenzavirus proteins that are most similar to SARS-CoV-2 proteins and 662 (34.88%) of the identified 1898 UniProt mapped human proteins in their network can be found in our merged subgraph. Messina et al. [18] constructed interactomes for three human coronaviruses: SARS-CoV, MERS-CoV and HCoV-229E and employed RWR algorithm to identify the top 200 closest proteins for each of the virus (total 600 proteins). A total of 548 proteins can be mapped to Homo sapiens UniProt database and 241 (43.98%) of them can be found in our merged subgraph. In total, 3323 (95.35%) of the UniProt indexing nodes in our subgraph can be found in the aforementioned works and 161 of the remaining 162 UniProt indexing nodes are not found in literature and therefore can be considered complete novel findings (Supplementary Table 6).
Then, we validate our findings against experimentally obtained results. Stukalov et al. [10] identified the human-virus interactomes of SARS-CoV and SARS-CoV-2 as consisting of 1801 interactions between SARS-CoV/SARS-CoV-2 viral proteins and 1086 human proteins (1082 of them can be mapped to the human Biomine database). Li et al. [11] experimentally identified 295 SARS-CoV-2 virus-host protein interactions (between SARS-CoV-2 viral proteins and 286 human proteins) and found potential molecular mechanism for SARS-CoV-2-induced cytokine storm. We are able to map 284 of the human proteins to the human Biomine database. To validate the robustness of our discovered dense sub-communities, we redid our analysis and considered their discovered PPIs as additional ground truth. Our experiments indicate that by integrating more ground truth nodes from these two studies, our final extended network has a nearly identical structure as the presented ones in our paper and with exactly the same 3625 nodes. The main change is that more nodes in our final merged subgraph are being validated and the total number of generated hypotheses (nodes in the extended network that do not belong to the integrated experimentally validated results) has decreased, indicating that our identified dense sub-communities are robust enough. Besides validating the network, we also validated the biological stories of our findings. For example, SRC, ABL1 and JAK1/2 are generated hypotheses and we identified SRC, ABL1 and JAK2 to be important hub genes in previous section. In [10], JAK1 and JAK2 have been experimentally validated to interact with SARS-CoV and SARS-CoV-2 viral proteins. Similarly, we identified HSPA4, XPO1, CDK4, KIT to be among the high quality (most likely to be true) hypotheses in Table 3. Li et al. [11] have experimentally validated that HSPA4 interacts with SARS-CoV-2 N protein, XPO1 interacts with SARS-CoV-2 NSP8 protein, CDK4 interacts with SARS-CoV-2 NSP10 protein and KIT interacts with SARS-CoV-2 ORF3a protein.
4 Discussion
Using the rich Biomine database, we extended the SARS-CoV-2-human PPI network identified by Gordon et al. [8] and also integrated the discovered lists of pro/anti-SARS-CoV-2 genes by Wei et al. [9]. Through the proposed three-stage analysis pipeline, we were able to filter the large extended network, uncover dense sub-communities, and therefore generate research hypotheses related to COVID-19 by identifying dense cores in the Biomine database that have as many same nodes as the integrated experimentally validated results.
There are two fundamental assumptions in this work. First, to extend the experimentally validated results (we mainly focus on the PPI network), we assume the results by Gordon et al. and Wei et al. to be correct. Secondly, to identify a small list of important proteins from a large network, we assume sub-communities of nodes (that are highly connected with each other and well connected with experimentally validated nodes) to be more important than other nodes. In the literature, highly connected nodes such as hotspots or hub genes [10, 91, 92] have received substantial attention. Our analysis targets ‘high-activity sub-network’ and can be considered as an extension to hotspot (i.e. a cluster of connected hotspots, which is a higher level structure and is harder to detect). This is one of the novel contributions in this work.
In the first step of our proposed pipeline, we have two data-screening sub-steps added; this design is based on our assumption and will enable the peeling algorithm (PA) to focus more on cores with high activities. Furthermore, by focusing on dense cores, the PA can run faster due to a decrease in the input dataset size.
It is worth noting that when the network contains more than one connected component after the two-stage data screening, our proposed pipeline will produce the result even faster since the network complexity will be further reduced and we can run PA in parallel for each connected component. But in Biomine, the network is connected after screening and we were unable to run PA in parallel.
Based on the aforementioned assumption, the Biomine database, and the proposed analysis pipeline, we quickly identified sub-communities in the extended PPI network that have high activities and we discovered novel diseases, genes and proteins that could potentially relate to COVID-19 as research hypotheses. The generated hypotheses (Table S7 in Supplementary Result) provide candidates for follow-up work to validate.
Kumar et al. [20] also employed a similar graph decomposition concept on a host-viral network. The difference between their analysis approach and ours is that they started with a deterministic graph and added edge weight later while we started with probabilistic graph decomposition which is more challenging. Another notable difference is they utilized a graph decomposition method called weighted k-shell. In contrast to our k-core decomposition, k-shell asks for all the nodes in the subgraph to have coreness precisely equal to k, while k-core asks for all nodes’ coreness to be at least k. k-core has the advantage of connecting different subsets of nodes in the network and helps discover missing links between them. Additionally, when we perform pathway and process enrichment analysis on the subgraph, we also use the subset of nodes with the same coreness, which by definition is the k-shell of the subgraph.
There are three user-defined thresholds in the first and second steps of our proposed analysis pipeline: threshold based on degree expectation, threshold based on  -degree lower-bounds and
  . These thresholds can be changed based on users’ specific needs. The first two thresholds are used to filter out nodes with very low connectivity, which cannot be members of dense sub-communities in the network. By filtering out low connectivity nodes, we reduce the network volume and speed up the analysis. So, the first threshold should be a number much smaller than the coreness of nodes in the dense sub-network. In our analysis, we set the threshold as
  , and we are interested in the dense sub-network with coreness
  , hence threshold 5 is a conservative choice. As long as the first threshold is set relatively far away from the coreness in our final dense subgraph, its value only affects the computation speed, and not the results. The user could use a larger threshold to increase speed, if they are ok to take more risk of missing important nodes. Similar rule also applies to the second threshold. For the third threshold,
  , its choice is rather subjective, but we found the results of our analysis are robust to the choice of value. Figure S3 in Supplementary Methods shows the results of different settings of
  (0.3, 0.5, 0.7) to be very consistent (nodes’ coreness under different
  values are in almost perfect linear relationship).
For determining the merged subgraph, we need to pick an optimal threshold of coreness that will balance the denseness and the complexity of the graph. We observed that cores 69 and 77 are both dense, frequently appeared, and contain more information. Compared to core 77, we preferred core 69 as we want to include more nodes into the subgraph. On the other hand, it is not practical to involve too many nodes because it results in generating a vast amount of hypotheses to validate. Therefore after comparing with coreness 77 and other core number in Table 1, we chose coreness 69 as the final optimal threshold.
We did a literature review for most of the genes detected in our subgraph and listed top genes in Table 3. Take entries with  as an example, seven genes received literature support (we will discuss the tyrosine-related ones together in the next paragraph). The other 15 genes with
  might be strong candidates with high priority and worth for future validation. For GAPDH (Glyceraldehyde-3-phosphate dehydrogenase), Zheng et al. [42] obtained potential COVID-19 effector targets of Chinese medicine Xuebijing (XBJ) which was used in treating mild cases of COVID-19 patients, and GAPDH is found to be one of the key targets. Taniguchi-Ponciano et al. [43] identified HIF1
 as a potential marker for COVID-19 severity and GAPDH is found to be among the expressed HIF1
 responsive genes. Ebrahimi et al. [44] found inhibiting GAPDH in patients with degenerated innate immunity can potentially help in treating COVID-19. For DICER1 (Endoribonuclease Dicer), Mu et al. [45] found that SARS-CoV-2 N protein prevent Endoribonuclease Dicer from the recognition and cleavage of virus-derived dsRNA. For GSK3B (Glycogen synthase kinase-3 beta), Liu et al [50] investigated COVID-19 traditional Chinese medicine treatment ShenFuHuang formula and identified GSK3B as the medicine’s potential drug target. Khalil [51] and Nowak et al. [52] hypothesized lithium chloride (directly inhibits GSK3B) to be a potential treatment for COVID-19 due to its inhibition effect on other members of the CoV family. Embi et al. [53] found chloroquine treatment (preventing SARS-CoV-2 to fusion with the host cell membrane) results in the inhibition of GSK3B.
For tyrosine-related proteins in the merged subgraph and their associations with COVID-19, many tyrosine kinase inhibitors have been identified to inhibit the SARS-CoV-2 virus. Cagno et al. [93] found three ABL tyrosine-protein kinase inhibitors imatinib, dasatinib and nilotinib to exert inhibitory activity against SARS-CoV-2. Alijotas-Reig et al. [94] found two JAK tyrosine-protein kinase ruxolitinib and baricitinib to be useful in treating the COVID-19 induced systemic hyperinflammatory response (cytokine storm). Wu et al. and Seif et al. [56, 95] found another JAK inhibitor fedratinib to mitigate the serious conditions in COVID-19 patients. We identified SRC, JAK1/2, ABL1/2 as hub nodes in Figure 5. For SRC (Proto-oncogene tyrosine-protein kinase SRC), in Lin et al. [46], ibrutinib is found to block SRC family kinases, which might reduce viral entry as well as the inflammatory cytokine response in the lungs. Morenikeji et al. [47] identified SRC to be one of the genes associated with Bovine coronavirus and by implication, other coronaviruses. Tiwari et al. [48] found SRC to play a vital role in SARS-CoV-2 infection related pathways. Xie et al. [49] found SRC participates in cytokines storm in patients with obesity which could lead to negative outcomes when infected with SARS-CoV-2. Additionally, many works in literature have targeted JAK1/2 in the hope to treat or prevent COVID-19. Shi et al. [79] found decreasing of lymphocyte in patients with COVID-19 correlated with low expression of JAK1-STAT5 signaling pathway. Zhang et al. [58] found that by suppressing JAK1/2 using baricitinib, several cytokines signals inciting inflammation will be inhibited. Others have also suggested using drugs that inhibit JAK1/2 to help patients with COVID-19 [59–63, 80–82]. As for ABL1/2, Abruzzese et al. [55] have suggested a possibility that patients treated with BCR-ABL tyrosine kinase inhibitors may be protected from the virus infection.
5 Conclusion
With the SARS-CoV-2 outbreak being declared as a pandemic by the World Health Organization (WHO) [96], researchers around the globe are shifting their focus to COVID-19. In this work, we are especially interested in the PPI network between SARS-CoV-2 proteins and human proteins identified by Gordon et al. [8] and the lists of pro/anti-SARS-CoV-2 genes discovered by Wei et al. [9], and our focus mainly lies in extending the network to generate biological hypotheses for further validation. To achieve that, we connect the single experiment derived PPI network with the large Biomine database, integrate the findings of Wei et al., and aim to locate sub-communities with high activities in the extended network. We propose a data analysis pipeline based on a graph peeling algorithm (PA) that enabled us to compute core decomposition efficiently. We select dense cores in the Biomine database that overlap most with the integrated experimentally validated results. The dense subgraph is the resulting extended network, and nodes not belonging to the integrated experimentally validated results in the subgraph are generated hypotheses. We then evaluate the selected subgraph in three contexts: we performed literature validation for uncovered virus targeting genes and proteins and found genes that have already been validated by others on their relationships to COVID-19; we carried out gene ontology over-representation test on the subgraph and found underlying enriched terms related to viral replication, viral pathogenesis, cytokine storm, etc.; we also searched for literature support on the identified tissues and diseases related to COVID-19 and found the possibility of drug repurposing for COVID-19 treatment. To further assign priorities to the generated hypotheses, we sorted all UniProt indexing nodes in the subgraph by their connections to the integrated experimentally validated nodes. The top ranking nodes (Table 3) in the list have a high proportion of literature validated nodes (for instance, GAPDH, DICER1, GSK3B, UBC, HSP90AA1, HSPA8, and tyrosine-protein kinase SRC, JAK1, JAK2, ABL1, etc.), we deem the rest non-validated nodes in the table as high quality hypotheses.
Code and data availability
Complete methods for data preprocessing and peeling algorithm (PA) from analysis pipeline and the data underlying this article can be found on GitHub (https://github.com/ubcxzhang/COVIDnetwork).
Competing interests
There is NO Competing Interest.
Author contributions statement
X.S. and X.Z. contributed to the study concept and design. Y.G. and F.E. contributed to the acquisition of the datasets, data processing and data analysis. Y.G. wrote the first draft with input from X.S. X.Z. led this research. All authors have developed drafts of the manuscript and approved the final draft of the manuscript.
Supplementary Material
Acknowledgments
The authors thank the anonymous reviewers for their valuable suggestions. We acknowledge Compute Canada for providing the computational resources. X.S. is supported by the National Research Council Canada through the Artificial Intelligence for Design program.
Funding
This work is supported in part by funds from the Natural Sciences and Engineering Research Council of Canada: NSERC Discovery Grants: # RGPIN-2017-04722 (YG & XZ), # RGPIN-2017-04039 (VS), # RGPIN-2016-04022 (AT), # RGPIN-2021-03530 (LX) and the Canada Research Chair # 950-231363 (XZ).
Yang Guo is a master’s student in the Department of Mathematics and Statistics at the University of Victoria, Canada. His research interests include bioinformatics and data mining.
Fatemeh Esfahani is a Ph.D. candidate in Computer Science at University of Victoria, Canada. Her research interests include graph algorithms, social network analytics and data mining.
Xiaojian Shao is a research officer at Digital Technologies Research Centre, National Research Council Canada. He has research interests in bioinformatics, computational epigenomics and machine learning.
Venkatesh Srinivasan is a professor in the Department of Computer Science at the University of Victoria, Canada. His current research interests are in algorithms for big data, data mining and data privacy.
Alex Thomo is a professor in the Department of Computer Science at the University of Victoria, Canada. His research interests include databases, algorithms for big graphs, social networks and data mining.
Li Xing is an assistant professor in the Department of Mathematics and Statistics at the University of Saskatchewan, Canada. Her expertise is in biostatistics and statistical machine learning.
Xuekui Zhang is a Canada Research Chair in Biostatistics and Bioinformatics and an assistant professor in the Department of Mathematics and Statistics at the University of Victoria, Canada. His expertise is in biostatistics, bioinformatics and statistical machine learning.
Footnotes
1332 viral interacting human proteins and an additional human protein that interact with the viral-interacting human proteins
Contributor Information
Yang Guo, Department of Mathematics and Statistics, University of Victoria, 3800 Finnerty Road, V8P 5C2, Victoria, BC, Canada.
Fatemeh Esfahani, Department of Computer Science, University of Victoria, 3800 Finnerty Road, V8P 5C2, Victoria, BC, Canada.
Xiaojian Shao, Digital Technologies Research Centre, National Research Council Canada, 1200 Montreal Road, K1A 0R6, Ottawa, ON, Canada.
Venkatesh Srinivasan, Department of Computer Science, University of Victoria, 3800 Finnerty Road, V8P 5C2, Victoria, BC, Canada.
Alex Thomo, Department of Computer Science, University of Victoria, 3800 Finnerty Road, V8P 5C2, Victoria, BC, Canada.
Li Xing, Department of Mathematics and Statistics, University of Saskatchewan, 110 Science Place, S7N 5A2, Saskatoon, SK, Canada.
Xuekui Zhang, Department of Mathematics and Statistics, University of Victoria, 3800 Finnerty Road, V8P 5C2, Victoria, BC, Canada.
References
- 1. Zhu N, Zhang D, Wang W, et al. A novel coronavirus from patients with pneumonia in China, 2019. New England journal of medicine 2020;382(8):727–33. [DOI] [PMC free article] [PubMed] [Google Scholar]
- 2. Cascella M, Rajnik M, Aleem A, et al. Features, evaluation and treatment coronavirus (COVID-19). StatPearls [Internet]. Treasure Island (FL): StatPearls Publishing; 2021 Jan. Available from: https://www.ncbi.nlm.nih.gov/books/NBK554776/. [PubMed] [Google Scholar]
- 3. Wu F, Zhao S, Yu B, et al. A new coronavirus associated with human respiratory disease in China. Nature 2020;579(7798):265–9. [DOI] [PMC free article] [PubMed] [Google Scholar]
- 4. Rabaan AA, Al-Ahmed SH, Haque S, et al. SARS-CoV-2, SARS-CoV, and MERS-COV: a comparative overview. Infez Med 2020;28(2):174–84. [PubMed] [Google Scholar]
- 5. Hoffmann M, Kleine-Weber H, Schroeder S, et al. SARS-CoV-2 cell entry depends on ACE2 and TMPRSS2 and is blocked by a clinically proven protease inhibitor. Cell 2020;181(2):271–80. [DOI] [PMC free article] [PubMed] [Google Scholar]
- 6. Blanco-Melo D, Nilsson-Payant BE, Liu W-C, et al. Imbalanced host response to SARS-CoV-2 drives development of COVID-19. Cell 2020;181(5):1036–45. [DOI] [PMC free article] [PubMed] [Google Scholar]
- 7. Bojkova D, Klann K, Koch B, et al. Proteomics of SARS-CoV-2-infected host cells reveals therapy targets. Nature 2020;583(7816):469–72. [DOI] [PMC free article] [PubMed] [Google Scholar]
- 8. Gordon DE, Jang GM, Bouhaddou M, et al. A SARS-CoV-2 protein interaction map reveals targets for drug repurposing. Nature 2020;583(7816):459–68. [DOI] [PMC free article] [PubMed] [Google Scholar]
- 9. Wei J, Alfajaro MM, DeWeirdt PC, et al. Genome-wide CRISPR screens reveal host factors critical for SARS-CoV-2 infection. Cell 2021;184(1):76–91. [DOI] [PMC free article] [PubMed] [Google Scholar]
- 10. Stukalov A, Girault V, Grass V, et al. Multilevel proteomics reveals host perturbations by SARS-CoV-2 and SARS-CoV. Nature 2021;594(7862):246–52. [DOI] [PubMed] [Google Scholar]
- 11. Li J, Guo M, Tian X, et al. Virus-host interactome and proteomic survey reveal potential virulence factors influencing SARS-CoV-2 pathogenesis. Med 2021;2(1):99–112. [DOI] [PMC free article] [PubMed] [Google Scholar]
- 12. Ahsan MA, Liu Y, Feng C, et al. Bioinformatics resources facilitate understanding and harnessing clinical research of SARS-CoV-2. Brief Bioinform 2021;22(2):714–25. [DOI] [PMC free article] [PubMed] [Google Scholar]
- 13. Laure Perrin-Cocon, Olivier Diaz, Clémence Jacquemin, Valentine Barthel, Eva Ogire, Christophe Ramière, Patrice André, Vincent Lotteau, and Pierre-Olivier Vidalain. The current landscape of coronavirus-host protein–protein interactions. J Transl Med, 18(1):319, 2020. [DOI] [PMC free article] [PubMed] [Google Scholar]
- 14. Krämer A, Billaud J-N, Tugendreich S, et al. The Coronavirus Network Explorer: Mining a large-scale knowledge graph for effects of SARS-CoV-2 on host cell function. BMC bioinformatics 2021;22(1):229. [DOI] [PMC free article] [PubMed] [Google Scholar]
- 15. Gysi DM, Do Valle Í, Zitnik M, et al. Network medicine framework for identifying drug-repurposing opportunities for COVID-19. Proc Natl Acad Sci 2021;118(19). [DOI] [PMC free article] [PubMed] [Google Scholar]
- 16. Sepideh Sadegh, Julian Matschinske, David B Blumenthal, Gihanna Galindez, Tim Kacprowski, Markus List, Reza Nasirigerdeh, Mhaned Oubounyt, Andreas Pichlmair, Tim Daniel Rose. Exploring the SARS-CoV-2 virus-host-drug interactome for drug repurposing. Nat Commun, 11(1): 3518, 2020. [DOI] [PMC free article] [PubMed] [Google Scholar]
- 17. Khorsand B, Savadi A, Naghibzadeh M. SARS-CoV-2-human protein-protein interaction network. Informatics in medicine unlocked 2020;20:100413. [DOI] [PMC free article] [PubMed] [Google Scholar]
- 18. Messina F, Giombini E, Agrati C, et al. COVID-19: viral–host interactome analyzed by network based-approach model to study pathogenesis of SARS-CoV-2 infection. J Transl Med 2020;18(1):233. [DOI] [PMC free article] [PubMed] [Google Scholar]
- 19. Zhou Y, Hou Y, Shen J, et al. A network medicine approach to investigation and population-based validation of disease manifestations and drug repurposing for COVID-19. PLoS Biol 2020;18(11):e3000970. [DOI] [PMC free article] [PubMed] [Google Scholar]
- 20. Kumar N, Mishra B, Mehmood A, et al. Integrative network biology framework elucidates molecular mechanisms of SARS-CoV-2 pathogenesis. Iscience 2020;23(9):101526. [DOI] [PMC free article] [PubMed] [Google Scholar]
- 21. Eronen L, Toivonen H. Biomine: predicting links between biological entities using network models of heterogeneous databases. BMC bioinformatics 2012;13(1):119. [DOI] [PMC free article] [PubMed] [Google Scholar]
- 22. Podpečan V, Ramšak Ž, Gruden K, et al. Interactive exploration of heterogeneous biological networks with Biomine Explorer. Bioinformatics 2019;35(24):5385–8. [DOI] [PMC free article] [PubMed] [Google Scholar]
- 23. Wheeler DL, Barrett T, Benson DA, et al. Database resources of the national center for biotechnology information. Nucleic Acids Res 2007;36(suppl_1):D13–21. [DOI] [PMC free article] [PubMed] [Google Scholar]
- 24. UniProt Consortium . The universal protein resource (UniProt) in 2010. Nucleic Acids Res 2010;38(suppl_1):D142–8. [DOI] [PMC free article] [PubMed] [Google Scholar]
- 25. Jensen LJ, Kuhn M, Stark M, et al. STRING 8-a global view on proteins and their functional interactions in 630 organisms. Nucleic Acids Res 2009;37(suppl_1):D412–6. [DOI] [PMC free article] [PubMed] [Google Scholar]
- 26. Maglott D, Ostell J, Pruitt KD, et al. Entrez Gene: gene-centered information at NCBI. Nucleic Acids Res 2005;33(suppl_1):D54–8. [DOI] [PMC free article] [PubMed] [Google Scholar]
- 27. Hunter S, Apweiler R, Attwood TK, et al. InterPro: the integrative protein signature database. Nucleic Acids Res 2009;37(suppl_1):D211–5. [DOI] [PMC free article] [PubMed] [Google Scholar]
- 28. Bonchi F, Gullo F, Kaltenbrunner A, et al. Core decomposition of uncertain graphs. In: Proceedings of the 20th ACM SIGKDD international conference on Knowledge discovery and data mining, 2014, 1316–25.
- 29. Khaouid W, Barsky M, Srinivasan V, et al. K-core decomposition of large networks on a single PC. Proceedings of the VLDB Endowment 2015;9(1):13–23. [Google Scholar]
- 30. Esfahani F, Srinivasan V, Thomo A, et al. Efficient computation of probabilistic core decomposition at web-scale. In: Proceedings of the 22nd International Conference on Extending Database Technology (EDBT), 2019, 325–36.
- 31. Seidman SB. Network structure and minimum degree. Social networks 1983;5(3):269–87. [Google Scholar]
- 32. Yu G, Wang L-G, Han Y, et al. clusterProfiler: an R package for comparing biological themes among gene clusters. Omics: a journal of integrative biology 2012;16(5):284–7. [DOI] [PMC free article] [PubMed] [Google Scholar]
- 33. Zhou Y, Zhou B, Pache L, et al. Metascape provides a biologist-oriented resource for the analysis of systems-level datasets. Nat Commun 2019;10(1):1523. [DOI] [PMC free article] [PubMed] [Google Scholar]
- 34. Boyle EI, Weng S, Gollub J, et al. Go: Termfinder-open source software for accessing gene ontology information and finding significantly enriched gene ontology terms associated with a list of genes. Bioinformatics 2004;20(18):3710–5. [DOI] [PMC free article] [PubMed] [Google Scholar]
- 35. Benjamini Y, Hochberg Y. Controlling the false discovery rate: a practical and powerful approach to multiple testing. J R Stat Soc B Methodol 1995;57(1):289–300. [Google Scholar]
- 36. Huang DW, Sherman BT, Lempicki RA. Bioinformatics enrichment tools: paths toward the comprehensive functional analysis of large gene lists. Nucleic Acids Res 2009;37(1):1–13. [DOI] [PMC free article] [PubMed] [Google Scholar]
- 37. Sherman BT, Lempicki RA. Systematic and integrative analysis of large gene lists using DAVID bioinformatics resources. Nat Protoc 2009;4(1):44. [DOI] [PubMed] [Google Scholar]
- 38. Gustavo Garcia AS, Jr, Ramaiah A, Sen C, et al. Antiviral drug screen identifies DNA-damage response inhibitor as potent blocker of SARS-CoV-2 replication. Cell Rep 2021;35(1):108940. [DOI] [PMC free article] [PubMed] [Google Scholar]
- 39. Bouhaddou M, Memon D, Meyer B, et al. The global phosphorylation landscape of SARS-CoV-2 infection. Cell 2020;182(3):685–712. [DOI] [PMC free article] [PubMed] [Google Scholar]
- 40. Tutuncuoglu B, Cakir M, Batra J, et al. The landscape of human cancer proteins targeted by SARS-CoV-2. Cancer Discov 2020;10(7):916–21. [DOI] [PMC free article] [PubMed] [Google Scholar]
- 41. Renu K, Subramaniam MD, Chakraborty R, et al. The role of Interleukin-4 in COVID-19 associated male infertility–A hypothesis. J Reprod Immunol 2020;142:103213. [DOI] [PMC free article] [PubMed] [Google Scholar]
- 42. Zheng W-j, Yan Q, Ni Y-s, et al. Examining the effector mechanisms of Xuebijing injection on COVID-19 based on network pharmacology. BioData mining 2020;13:17. [DOI] [PMC free article] [PubMed] [Google Scholar]
-
43.
Taniguchi-Ponciano K, Vadillo E, Mayani H, et al. Increased expression of hypoxia-induced factor 1
 mRNA and its related genes in myeloid blood cells from critically ill COVID-19 patients. Ann Med 2021;53(1):197–207. [DOI] [PMC free article] [PubMed] [Google Scholar]
 - 44. Ebrahimi KH, Gilbert-Jaramillo J, James WS, et al. Interferon-stimulated gene products as regulators of central carbon metabolism. FEBS J 2021;288(12):3715–26. [DOI] [PMC free article] [PubMed] [Google Scholar]
- 45. Jingfang M, Xu J, Zhang L, et al. SARS-CoV-2-encoded nucleocapsid protein acts as a viral suppressor of RNA interference in cells. Sci China Life Sci 2020;63(9):1413–6. [DOI] [PMC free article] [PubMed] [Google Scholar]
- 46. Lin AY, Cuttica MJ, Ison MG, et al. Ibrutinib for chronic lymphocytic leukemia in the setting of respiratory failure from severe COVID-19 infection: Case report and literature review. Ejhaem 2020;1(2):596–600. [DOI] [PMC free article] [PubMed] [Google Scholar]
- 47. Morenikeji OB, Wallace M, Strutton E, et al. Integrative network analysis of predicted miRNA-targets regulating expression of immune response genes in bovine coronavirus infection. Front Genet 2020;11:584392. [DOI] [PMC free article] [PubMed] [Google Scholar]
- 48. Tiwari R, Mishra AR, Mikaeloff F, et al. In silico and in vitro studies reveal complement system drives coagulation cascade in SARS-CoV-2 pathogenesis. Comput Struct Biotechnol J 2020;18:3734–44. [DOI] [PMC free article] [PubMed] [Google Scholar]
- 49. Xie Z-j, Novograd J, Itzkowitz Y, et al. The Pivotal Role of Adipocyte-Na K peptide in Reversing Systemic Inflammation in Obesity and COVID-19 in the Development of Heart Failure. Antioxidants 2020;9(11):1129. [DOI] [PMC free article] [PubMed] [Google Scholar]
- 50. Liu T, Guo Y, Zhao J, et al. Systems Pharmacology and Verification of ShenFuHuang Formula in Zebrafish Model Reveal Multi-Scale Treatment Strategy for Septic Syndrome in COVID-19. Front Pharmacol 2020;11:1464. [DOI] [PMC free article] [PubMed] [Google Scholar]
- 51. Khalil RB. Lithium chloride combination with rapamycin for the treatment of COVID-19 pneumonia. Med Hypotheses 2020;142:109798. [DOI] [PMC free article] [PubMed] [Google Scholar]
- 52. Nowak JK, Walkowiak J. Lithium and coronaviral infections. A scoping review. F1000Research 2020;9:93. [DOI] [PMC free article] [PubMed] [Google Scholar]
-
53.
Embi MN, Ganesan N, Sidek HM. Is GSK3
 a molecular target of chloroquine treatment against COVID-19? Drug Discoveries & Therapeutics 2020;14(2):107–8. [DOI] [PubMed] [Google Scholar]
 - 54. Dirmeier S, Dächert C, van Hemert M, et al. Host factor prioritization for pan-viral genetic perturbation screens using random intercept models and network propagation. PLoS Comput Biol 2020;16(2):e1007587. [DOI] [PMC free article] [PubMed] [Google Scholar]
- 55. Abruzzese E, Luciano L, D’Agostino F, et al. SARS-CoV-2 (COVID-19) and Chronic Myeloid Leukemia (CML): a case report and review of ABL kinase involvement in viral infection. Mediterranean Journal of Hematology and Infectious Diseases 2020;12(1):e2020031. [DOI] [PMC free article] [PubMed] [Google Scholar]
- 56. Wu D, Xuexian O. Yang. TH17 responses in cytokine storm of COVID-19: An emerging target of JAK2 inhibitor Fedratinib. J Microbiol Immunol Infect 2020;53(3):368–70. [DOI] [PMC free article] [PubMed] [Google Scholar]
- 57. Berretta AA, Silveira MAD, Capcha JMC, et al. Propolis and its potential against SARS-CoV-2 infection mechanisms and COVID-19 disease. Biomed Pharmacother 2020;131:110622. [DOI] [PMC free article] [PubMed] [Google Scholar]
- 58. Zhang X, Zhang Y, Qiao W, et al. Baricitinib, a drug with potential effect to prevent SARS-COV-2 from entering target cells and control cytokine storm induced by COVID-19. Int Immunopharmacol 2020;86:106749. [DOI] [PMC free article] [PubMed] [Google Scholar]
- 59. Yeleswaram S, Smith P, Burn T, et al. Inhibition of cytokine signaling by ruxolitinib and implications for COVID-19 treatment. Clin Immunol 2020;218:108517. [DOI] [PMC free article] [PubMed] [Google Scholar]
- 60. Cantini F, Niccoli L, Nannini C, et al. Beneficial impact of Baricitinib in COVID-19 moderate pneumonia; multicentre study. J Infect 2020;81(4):647–79. [DOI] [PMC free article] [PubMed] [Google Scholar]
- 61. Stebbing J, Krishnan V, de Bono S, et al. Mechanism of baricitinib supports artificial intelligence-predicted testing in COVID-19 patients. EMBO Mol Med 2020;12(8):e12697. [DOI] [PMC free article] [PubMed] [Google Scholar]
- 62. Bagca BG, Avci CB. The potential of JAK/STAT pathway inhibition by ruxolitinib in the treatment of COVID-19. Cytokine Growth Factor Rev 2020;54(51). [DOI] [PMC free article] [PubMed] [Google Scholar]
- 63. La Rosée F, Bremer HC, Gehrke I, et al. The Janus kinase 1/2 inhibitor ruxolitinib in COVID-19 with severe systemic hyperinflammation. Leukemia 2020;34(7):1805–15. [DOI] [PMC free article] [PubMed] [Google Scholar]
- 64. Johnson HM, Lewin AS, Ahmed CM. SOCS, Intrinsic Virulence Factors, and Treatment of COVID-19. Front Immunol 2020;11:2803. [DOI] [PMC free article] [PubMed] [Google Scholar]
- 65. Bolourian A, Mojtahedi Z. Obesity and COVID-19: The mTOR pathway as a possible culprit. Obes Rev 2020;21(9):e13084. [DOI] [PMC free article] [PubMed] [Google Scholar]
- 66. Caci G, Albini A, Malerba M, et al. COVID-19 and obesity: dangerous liaisons. J Clin Med 2020;9(8):2511. [DOI] [PMC free article] [PubMed] [Google Scholar]
- 67. Ramaiah MJ. mTOR inhibition and p53 activation, microRNAs: The possible therapy against pandemic COVID-19. Gene Reports 2020;20:100765. [DOI] [PMC free article] [PubMed] [Google Scholar]
- 68. Azar WS, Njeim R, Fares AH, et al. COVID-19 and diabetes mellitus: how one pandemic worsens the other. Reviews in Endocrine and Metabolic Disorders 2020;21(4):451–63. [DOI] [PMC free article] [PubMed] [Google Scholar]
- 69. Zheng Y, Li R, Liu S. Immunoregulation with mTOR inhibitors to prevent COVID-19 severity: A novel intervention strategy beyond vaccines and specific antiviral medicines. J Med Virol 2020;92(9):1495–500. [DOI] [PMC free article] [PubMed] [Google Scholar]
- 70. Schoot TS, Kerckhoffs APM, Hilbrands LB, et al. Immunosuppressive drugs and COVID-19: A review. Front Pharmacol 2020;11:1333. [DOI] [PMC free article] [PubMed] [Google Scholar]
- 71. Arunachalam PS, Wimmers F, Mok CKP, et al. Systems biological assessment of immunity to mild versus severe COVID-19 infection in humans. Science 2020;369(6508):1210–20. [DOI] [PMC free article] [PubMed] [Google Scholar]
- 72. Bousquet J, Cristol J-P, Czarlewski W, et al. Nrf2-interacting nutrients and COVID-19: time for research to develop adaptation strategies. Clinical and translational allergy 2020;10(1):58. [DOI] [PMC free article] [PubMed] [Google Scholar]
- 73. Karam BS, Morris RS, Bramante CT, et al. mTOR inhibition in COVID-19: A commentary and review of efficacy in RNA viruses. J Med Virol 2020;93(4):1843–6. [DOI] [PMC free article] [PubMed] [Google Scholar]
- 74. Conti P, Ronconi G, Caraffa AL, et al. Induction of pro-inflammatory cytokines (IL-1 and IL-6) and lung inflammation by Coronavirus-19 (COVI-19 or SARS-CoV-2): anti-inflammatory strategies. J Biol Regul Homeost Agents 2020;34(2):1. [DOI] [PubMed] [Google Scholar]
- 75. Xia Q-D, Yang X, Lu J-L, et al. Network pharmacology and molecular docking analyses on Lianhua Qingwen capsule indicate Akt1 is a potential target to treat and prevent COVID-19. Cell Prolif 2020;53(12):e12949. [DOI] [PMC free article] [PubMed] [Google Scholar]
- 76. Zhao J, Tian S, Lu D, et al. Systems pharmacological study illustrates the immune regulation, anti-infection, anti-inflammation, and multi-organ protection mechanism of Qing-Fei-Pai-Du decoction in the treatment of COVID-19. Phytomedicine 2021;85:153315. [DOI] [PMC free article] [PubMed] [Google Scholar]
- 77. Appelberg S, Gupta S, Akusjärvi SS, et al. Dysregulation in Akt/mTOR/HIF-1 signaling identified by proteo-transcriptomics of SARS-CoV-2 infected cells. Emerging microbes & infections 2020;9(1):1748–60. [DOI] [PMC free article] [PubMed] [Google Scholar]
- 78. Zhuang Z, Zhong X, Zhang H, et al. Exploring the Potential Mechanism of Shufeng Jiedu Capsule for Treating COVID-19 by Comprehensive Network Pharmacological Approaches and Molecular Docking Validation. Comb Chem High Throughput Screen 2020. [DOI] [PubMed] [Google Scholar]
- 79. Shi H, Wang W, Yin J, et al. The inhibition of IL-2/IL-2R gives rise to CD8+ T cell and lymphocyte decrease through JAK1-STAT5 in critical patients with COVID-19 pneumonia. Cell Death Dis 2020;11(6):429. [DOI] [PMC free article] [PubMed] [Google Scholar]
- 80. Yang C, Wei J, Liang Z, et al. Ruxolitinib in treatment of severe coronavirus disease 2019 (COVID-19): A multicenter, single-blind, randomized controlled trial. J Allergy Clin Immunol 2020;146(1):137–46. [DOI] [PMC free article] [PubMed] [Google Scholar]
- 81. Galimberti S, Baldini C, Baratè C, et al. The CoV-2 outbreak: how hematologists could help to fight Covid-19. Pharmacol Res 2020;157:104866. [DOI] [PMC free article] [PubMed] [Google Scholar]
- 82. Vannucchi AM, Sordi B, Morettini A, et al. Compassionate use of JAK1/2 inhibitor ruxolitinib for severe COVID-19: a prospective observational study. Leukemia 2020;35(4):1121–33. [DOI] [PMC free article] [PubMed] [Google Scholar]
- 83. Bosch-Barrera J, Martin-Castillo B, Buxó M, et al. Silibinin and SARS-CoV-2: Dual Targeting of Host Cytokine Storm and Virus Replication Machinery for Clinical Management of COVID-19 Patients. J Clin Med 2020;9(6):1770. [DOI] [PMC free article] [PubMed] [Google Scholar]
- 84. Wicik Z, Eyileten C, Jakubik D, et al. ACE2 interaction networks in COVID-19: a physiological framework for prediction of outcome in patients with cardiovascular risk factors. J Clin Med 2020;9(11):3743. [DOI] [PMC free article] [PubMed] [Google Scholar]
- 85. Zhu P, Lv C, Fang C, et al. Heat shock protein member 8 is an attachment factor for infectious Bronchitis virus. Front Microbiol 2020;11:1630. [DOI] [PMC free article] [PubMed] [Google Scholar]
- 86. Winn BJ. Is there a role for insulin-like growth factor inhibition in the treatment of COVID-19-related adult respiratory distress syndrome? Med Hypotheses 2020;144:110167. [DOI] [PMC free article] [PubMed] [Google Scholar]
- 87. Chandra A, Gurjar V, Qamar I, et al. Identification of potential inhibitors of SARS-COV-2 endoribonuclease (EndoU) from FDA approved drugs: a drug repurposing approach to find therapeutics for COVID-19. Journal of Biomolecular Structure and Dynamics 2020;1–11. [DOI] [PMC free article] [PubMed] [Google Scholar]
- 88. Rosa S, Santos W. Clinical trials on drug repositioning for COVID-19 treatment. Rev Panam Salud Publica 2020;44:e40. [DOI] [PMC free article] [PubMed] [Google Scholar]
- 89. Amawi H, Abu Deiab GI, Aljabali AAA, et al. COVID-19 pandemic: an overview of epidemiology, pathogenesis, diagnostics and potential vaccines and therapeutics. Ther Deliv 2020;11(4):245–68. [DOI] [PMC free article] [PubMed] [Google Scholar]
- 90. Zhang J, Xie B, Hashimoto K. Current status of potential therapeutic candidates for the COVID-19 crisis. Brain Behav Immun 2020;87:59–73. [DOI] [PMC free article] [PubMed] [Google Scholar]
- 91. Chang C-k, Lin S-M, Satange R, et al. Targeting protein-protein interaction interfaces in COVID-19 drug discovery. Comput Struct Biotechnol J 2021;19:2246–55. [DOI] [PMC free article] [PubMed] [Google Scholar]
- 92. Verstraete N, Jurman G, Bertagnolli G, et al. CovMulNet19, Integrating Proteins, Diseases, Drugs, and Symptoms: A Network Medicine Approach to COVID-19. Network and systems medicine 2020;3(1):130–41. [DOI] [PMC free article] [PubMed] [Google Scholar]
- 93. Cagno V, Magliocco G, Tapparel C, et al. The tyrosine kinase inhibitor nilotinib inhibits SARS-CoV-2 in vitro. Basic Clin Pharmacol Toxicol 2021;128(4):621–4. [DOI] [PMC free article] [PubMed] [Google Scholar]
- 94. Alijotas-Reig J, Esteve-Valverde E, Belizna C, et al. Immunomodulatory therapy for the management of severe COVID-19. Beyond the anti-viral therapy: A comprehensive review. Autoimmun Rev 2020;19(7):102569. [DOI] [PMC free article] [PubMed] [Google Scholar]
- 95. Seif F, Aazami H, Khoshmirsafa M, et al. JAK inhibition as a new treatment strategy for patients with COVID-19. Int Arch Allergy Immunol 2020;181(6):467–75. [DOI] [PMC free article] [PubMed] [Google Scholar]
- 96. Cucinotta D, Vanelli M. WHO declares COVID-19 a pandemic. Acta Biomed 2020;91(1):157–60. [DOI] [PMC free article] [PubMed] [Google Scholar]
Associated Data
This section collects any data citations, data availability statements, or supplementary materials included in this article.
Supplementary Materials
Data Availability Statement
Complete methods for data preprocessing and peeling algorithm (PA) from analysis pipeline and the data underlying this article can be found on GitHub (https://github.com/ubcxzhang/COVIDnetwork).