Social anxiety disorder (SAD) and major depressive disorder (MDD) are, collectively, the most prevalent psychiatric disorders impacting young adults, particularly women (Leach et al., 2008; Nolen-Hoeksema & Girgus, 1994), and typically onset in adolescence and early adulthood (Acarturk et al., 2008; Kessler et al., 2005). The cumulative interpersonal risk model describes a diathesis-stress model of SAD leading to MDD via maladaptive social processes and stressful interpersonal outcomes, such as withdrawal and social rejection, that occur during childhood and adolescence (Epkins & Heckler, 2011; Starr et al., 2014).
The comorbidity of these two disorders has been described by the tripartite model and the integrative hierarchical models in which SAD and MDD are characterized by higher levels of negative affect (Clark & Watson, 1991) and lower levels of positive affect (Mineka et al., 1998). These factors plausibly interact with each other over time to maintain the comorbidity. For example, researchers have demonstrated that anxious and depressed moods broadly predict each other within the day (Jacobson, 2015). However, we are still limited in our ability to effectively prevent and treat this cycle of symptomatology. Some research on psychotherapy for SAD and MDD comorbidity has demonstrated that successful treatment of SAD also mitigates depressive symptoms (Erwin et al., 2002; Moscovitch et al., 2005), suggesting that targeting factors specific to social anxiety, such as avoidance of social situations (Morrison & Heimberg, 2013), may be of particular use for successfully treating this comorbidity. Yet even with well-tested cognitive behavioral therapies for both disorders (Beck, 2011; Hambrick et al., 2003), this comorbidity persists, suggesting that more research is needed to determine additional methods for assessing and treating this comorbidity.
One barrier to successful treatment of this comorbidity may be in part due to our methods that have prioritized the examination of group-level effects. Clinical psychologists have historically used cross-sectional or longitudinal designs to identify risk factors for the group. Arguably, these risk factors may be non-significant, or even protective, for specific individuals within the group (see Molenaar, 2004) limiting the utility of prevention and treatment efforts based on these factors (Hamaker, 2012; Molenaar, 2004). The use of person-specific (i.e., individual-level or idiographic) methods in conjunction with multilevel methods advances our potential to provide personalized directives to improve prevention and treatment efforts (e.g., Fisher, 2015; Piccirillo et al., 2019; Wichers, 2014).
For example, one of the key elements of cognitive behavioral therapy for SAD focuses on reducing social avoidance. If we knew that physical activity was the strongest predictor of intra-daily anxiety for a given individual, we could offer them related clinical recommendations compared to focusing primarily on their social avoidance. Indeed, clinical researchers have demonstrated that person-specific networks vary across individuals with the same diagnostic profile (Fisher et al., 2017). Better characterization of the person-specific patterns among comorbidity-related factors would advance our ability to design, test, and implement personalized assessments and treatments.
With these aims in mind, we constructed both multilevel and person-specific networks of cognitive-affective and behavioral constructs for women experiencing comorbid SAD and MDD. Network analyses can be used to model the direct relationships between individual items in time-series (i.e., ecological momentary assessment; EMA) data. Multilevel and person-specific vector autoregression (VAR) models can be used to examine the complexity of comorbidity-related factors, respectively (Cramer et al., 2016; Wichers et al., 2015), informing the design of future personalized assessments and interventions for comorbidity (Fried & Cramer, 2017).
We collected intensive EMA data from women with SAD and a current or past depressive episode for 30 days, to allow for a person-specific examination of the dynamic fluctuations in cognitive-affective and behavioral factors related to hallmark symptoms of SAD-MDD comorbidity. To conduct person-specific VAR models that do not rely on data from the rest of the group, it is crucial to collect a sufficiently large number of observations from each participant (versus collecting fewer observations from more participants) (Hamaker et al., 2005); thus we prioritized collecting over one hundred observations from each participant. We prioritized recruiting women as women are at increased risk for SAD-MDD comorbidity (Nolen-Hoeksema & Girgus, 1994) and we did not expect to be able to study the differential effects of sex or gender due to our limited sample size. Additionally, we recruited women with SAD-MDD comorbidity; however, many women also met criteria for additional anxiety disorders. Furthermore, we did not recruit women with the full matrix of comorbidity (e.g., women with SAD, but not MDD or vice versa). Thus, it important to note that our study likely captures symptoms processes central to internalized distress, rather than SAD and MDD specifically.
We hypothesized that cognitive-affective factors, such as anxiety and loneliness, as well as maladaptive behaviors, such as avoidance of social situations, would predict depressed mood on the group level. We also hypothesized that person-specific patterns between these factors would emerge, such that no one individual would demonstrate the exact network structure as the group-level model. Finally, we compared individual-level estimates across the ML-VAR and person-specific VAR models to determine the extent to which estimates differed, as previous research suggests that these estimates may differ (Fisher et al., 2018).
Methods
Participants
Cisgender women (N = 35) were recruited from a Midwestern university community. Most women (n = 26) were enrolled in undergraduate courses, whereas others were graduate students or employees (n = 9). Ages ranged from 18 – 37 years (M = 21.37 years, SD = 5.20), and most women identified as White (n = 18; 51.43%), although 10 (28.57%) identified as East Asian and six (17.14%) identified as Black. Furthermore, two women (5.71%) identified as Hispanic. Most (n =19, 54.29%) identified as heterosexual, although 12 women (34.29% identified as bisexual and four women (11.43%) identified that they were questioning their sexual orientation. Information regarding socioeconomic status was not collected. All women met criteria for current SAD and a current (n = 6) or past (n = 29) major depressive episode. The average woman had at least one comorbid diagnosis (M = 1.46, range = 0–6 comorbid diagnoses). Panic disorder was the most frequent comorbid diagnosis (n = 12, 34.29%), followed by agoraphobia (n = 8, 22.86%), generalized anxiety disorder (n = 8, 22.86%), and alcohol use disorder (n = 8, 22.86%).
Measures
MINI Interview – 5 (MINI; Lecrubier et al., 1997).
The MINI-5 is a brief, structured diagnostic interview that has demonstrated good concordance with other structured diagnostic interviews (Lecrubier et al., 1997; Sheehan et al., 1998) and was used to assess psychiatric diagnoses to determine study eligibility. Blinded independent raters rated randomly assigned interviews (n = 18; 51.43%) and inter-rater reliability was good for SAD (κ = .73); excellent for a MDE (κ = .83).
Ecological momentary assessment (EMA) items.
Participants completed 14 EMA items during each assessment (see Table 1). Items, such as anxiety, loneliness, and social avoidance were selected as they represented hallmark symptoms of SAD (e.g., anxiety), were theoretical factors related to comorbidity (e.g., loneliness; Epkins & Heckler, 2011), or were treatment-related factors (e.g., social avoidance; Heimberg, 2002). Additional items, such as sadness, pleasure, and restlessness were included as they reflect DSM-5 diagnostic criteria for a major depressive episode (American Psychiatric Association, 2013). Additionally, physiological or behavioral factors that may impact mood, such as hunger and physical activity, were included. Participants rated all questions based on their present-moment experience (e.g., Hektner, Schmidt, & Csikszentmihalyi, 2007; Shiffman, Stone, & Hufford, 2008). Items were administered using a 0 – 10 integer sliding scale (Hektner et al., 2007).1 It was estimated that the entire survey took less than three minutes per assessment.
Table 1.
List of EMA items and within-person descriptive statistics
| EMA item | Construct measured | M (SD) | SD (SD) |
|---|---|---|---|
|
| |||
| 1. How down do you feel right now? | Sadness | 3.45 (1.26) | 2.21 (0.59) |
| 2. How happy do you feel right now? | Pleasure | 4.75 (1.33) | 1.99 (0.52) |
| 3. How calm do you feel right now? | Agitation | 4.94 (1.09) | 2.02 (0.47) |
| 4. How irritated do you feel right now? | Irritability | 2.78 (1.46) | 2.15 (0.55) |
| 5. How anxious do you feel right now? | Anxiety | 4.21 (1.35) | 2.25 (0.49) |
| 6. How lonely do you feel right now? | Loneliness | 3.32 (1.62) | 2.31 (0.68) |
| 7. How accomplished do you feel right now? | Feelings of failure | 4.50 (1.39) | 2.17 90.50) |
| 8. Are you currently avoiding a social situation or interaction? | Social avoidance | 2.68 (1.22) | 2.34 (0.68) |
| 9. How drowsy are you right now? | Tiredness/fatigue | 4.33 (1.13) | 2.47 (0.52) |
| 10. How pleased are you with your experience right now? | Amedcaia | 4.88 (1.23) | 2.10 (0.59) |
| 11. How restless do you feel right now? | Agitation | 3.35 (1.39) | 2.15 (0.59) |
| 12. How focused are you right now? | Concentration difficulties | 4.94 (1.09) | 4.59 (0.56) |
| 13. How hungry do you feel right now? | Loss of appetite | 3.30 (1.17) | 2.55 (0.53) |
| 14. How physically active (e.g., walking, exercising, stretching) have you been since the last beep? | Loss of energy | 3.15 (1.31) | 2.17 (0.61) |
Note. Each item was administered using a 0–10 scale with anchors ranging from Not at all to A lot. Due to high correlations, Items 1, 2, and 10 were averaged together to create a composite item representing depressed mood.
Procedure
Participants were eligible if they were cisgender women who met diagnostic criteria for SAD and a current or past MDE, had access to a smartphone, and expected to be able to return to the laboratory for a second clinical interview in approximately 2–3 months. Participants were excluded if they were imminently at risk for harm to self or others. Eligible participants provided informed consent before enrolling and all study procedures were approved by the university’s Institution Review Board. Participants first completed a brief training protocol for providing EMA assessments before beginning the study and completed brief self-report surveys give times a day (i.e., every three hours) during a self-selected 12-hour period for 30 days (approximately 150 assessments for each woman). Participants received weekly progress emails and received a preliminary version of their person-specific model in addition to monetary compensation. Maximum compensation was $82.50 for 100% completion of EMA surveys.
Data Analytic Procedure
Our main aim was to examine patterns between SAD-MDD comorbidity-related factors using multilevel (ML-VAR) and person-specific VAR models. We also determined the influence of each item in network by calculating the weighted sum of paths from one node to the rest of the network (node-level expected influence; Robinaugh et al., 2016). Finally, we were interested in examining the extent to which individual-level estimates generated from the multilevel model differed from the estimates generated from the person-specific models. To maintain brevity, we present an overview of our data analytic procedure here and provide additional details on our data analytic procedure within the supplementary material.
Prior to all study analyses, linear trends of time were accounted for by regressing the EMA items onto the time variables and the residuals from this preliminary model were used in the following analyses (e.g., Fisher et al., 2017; Wichers et al., 2020).2 Network analyses largely consist of partial correlations and regressions; thus we calculated first order correlations to determine the extent to which high overlap or correlations between EMA items may pose a concern for multicollinearity within the model (Fried & Cramer, 2017). There were three items that were highly correlated – feeling down, feeling happy, and feeling pleased (|r|s = .57 – .59). To reduce the effects of multicollinearity, we reverse scored feeling happy and feeling pleased and created an average composite between these three items to represent depressed mood.
We used two different network analytic techniques to examine partial relationships between EMA variables (i.e., residuals from each EMA item predicting the other item residuals) within the day. We specified time variables in our model to avoid predicting across night periods, given that VAR models assume equal amounts of time between assessments. To model group-level relationships, we used ML-VAR (Epskamp et al., 2018). ML-VAR disaggregates within and between-person effects by using the within-subjects centered variables as predictors for other within-subjects variables and by using the between-subjects centered variables (i.e., sample means) as predictors for the other between-subject variables. ML-VAR outputs two multilevel models. The first model demonstrates the contemporaneous or partial associations between variables. The second model demonstrates the temporal or partial regressive relationships (e.g., values from the previous time point) predicting values at the next time point (i.e., three hours later). The estimates from contemporaneous and temporal models reflect the effect size of these relationships. We also constructed person-specific VAR models for each participant using the graphicalVAR package (Epskamp, 2018). Similar to ML-VAR, the estimates from contemporaneous and temporal models reflect the effect size of these relationships.
The role and influence of individual EMA variables within the network was characterized further by examining network centrality statistics. We calculated the one-step expected influence for each variable in the contemporaneous models (the weighted sum of the paths between a given variable and the rest of the network) to determine the impact that each variable has on the rest of the network (Robinaugh et al., 2016). For the temporal ML-VAR network, we calculated both the outward expected influence, which is the weighted sum of the pathways between one node predicting other nodes at the next time point, as well as the inward expected influence, which is the weighted sum of pathways that predict a given node at the next time point. As the temporal models were sparse, we focus our interpretation of centrality findings using the estimates from the contemporaneous models. Finally, we calculated the node predictability from contemporaneous individual-level networks (see supplementary material).
One of the assumptions of multilevel modeling (e.g., ML-VAR) is that each individual is part of the same group; the multilevel model borrows information from other participants when estimating the effects for specific individuals. Previous researchers have demonstrated that group-level models may not adequately reflect individual-level effects (see Molenaar, 2004), thus. Given that a majority of participants completed over 100 surveys (TMean = 125.43, TSD = 19.26), we sought to construct person-specific networks for each individual that do not rely on the group-level data for their estimation. To further test the extent to which individuals differed from the group, we compared the individual-level estimates derived from the ML-VAR models to the individual-level estimates derived from the person-specific VAR models.3 This comparison illustrates the extent to which individual-level effects generated from person-specific VAR models correlate with the individual-level predictions generated from ML-VAR models (i.e., models that use information borrowed from the group). Large overlap or correlation between these estimates would suggest that the multilevel model uses assumptions that reflect the underlying group structure.
All study analyses were conducted using R (R Core Team, 2017) and code for all analyses is included in the supplementary material. To examine the stability of our ML-VAR model (especially given our relatively small sample size), we randomly selected 80% of the sample (n = 28) to construct a ML-VAR network, which we resampled 100 times. We examined the correlations between the expected influence centrality estimates from the original and resampled networks. Correlations were large, ranging from r = .68 to r = .97, suggesting that our results were stable.
Notably, we originally conducted these analyses using a different, but comparable, method (dynamic structural equation modeling) achieving largely similar results. We explain the differences between the two analytic methods, our rationale for our revised approach, and briefly summarize our previous findings in supplementary material.
Results
Aim 1: Examining group-level factors that characterize SAD-MDD comorbidity
In the group-level contemporaneous (i.e., associative) model, feeling lonely exhibited the largest expected influence (EI = 0.63), followed by feeling calm (EI = −0.54) and depressed mood (EI = 0.52), suggesting that these items exhibited the most connections to other nodes in the contemporaneous network and therefore exerted the most influence on the rest of the network. For example, feeling lonely was associated with depressed mood, feeling drowsy, and greater social avoidance. Feeling calm was associated with feeling more drowsy and less restless, anxious, and irritated, as well as lower depressed mood. Finally, depressed mood was significantly and positively associated with feeling anxious, irritated, and was also associated with greater avoidance of social situations. Depressed mood was also significantly and negatively associated with physical activity and feeling accomplished. The contemporaneous effects can be found in Table S1 and Figure 1.
Figure 1. Contemporaneous and temporal multilevel models (ML-VAR).
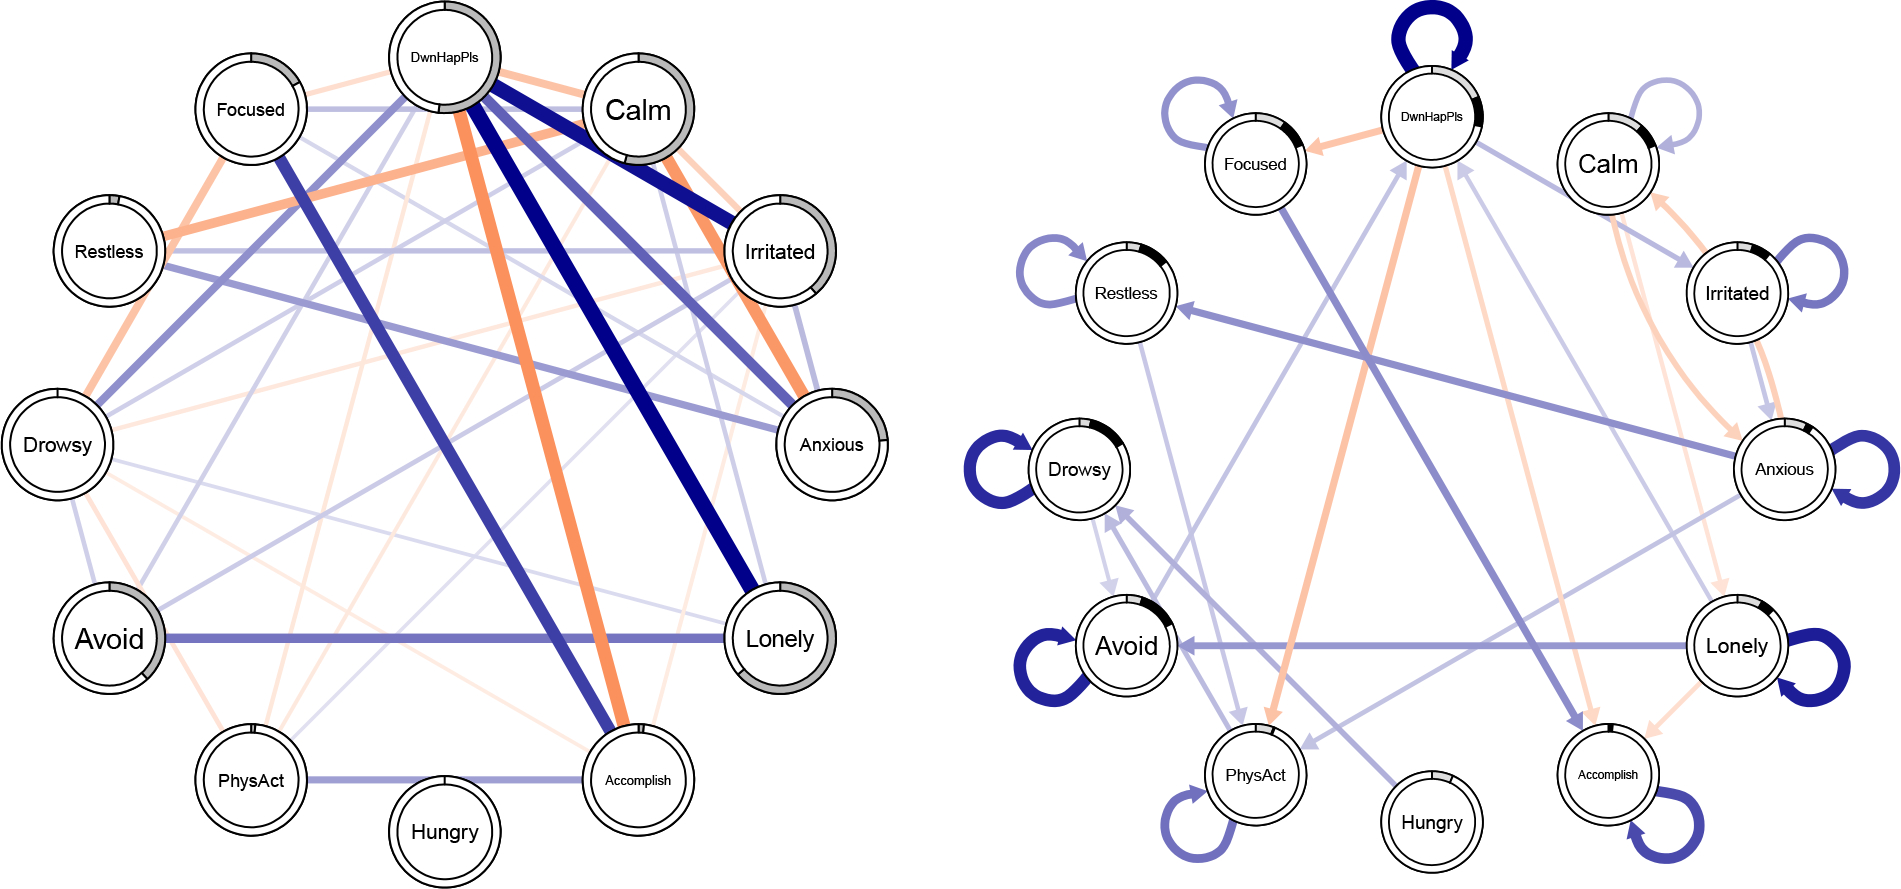
Note. The contemporaneous model demonstrating partial associations is shown on the left; the temporal model demonstrating partial regressions is shown on the right. Blue pathways represent positive relationships; orange pathways represent negative relationships; the width of the line corresponds to the magnitude of the relationship. The extent to which the ring around each node is solid reflects the magnitiude of the expected influence for each node –nodes with larger expected influnce on the network have more a greater proportion of the ring shaded. For the temporal network, the light grey shading refers to outward expected influence; black shading refers to inward expected influence. DwnHapPls = average composite of Down, Happy (reverse scored), and Pleased (reverse scored); Accomplish = Accomplished; PhysAct = Physical Activity; Avoid = Avoiding social situations.
Examining the group-level temporal relationships revealed that depressed mood (EI = −0.19) and feeling calm (EI = −0.11) exhibited the largest outward expected influence. That is, these nodes exhibited the strongest connections to other nodes in the network at the following time point. In contrast, social avoidance (EI = 0.13) and feeling drowsy (EI = 0.13) had the largest inwards expected influence, suggesting that these constructs were the most influenced or predicted by other nodes within the temporal network. Furthermore, there were significant autoregressive relationships suggesting that most variables predicted themselves at the next time point, except for feeling hungry.
Depressed mood predicted several other variables, such as feeling more anxious, more irritable, as well as feeling less accomplished, less focused, and less physical activity. Social avoidance was predicted by feeling lonely and feeling drowsy; feeling drowsy was predicted by feeling hungry and by amount of physical activity. Interestingly, there were no statistically significant relationships between feeling anxious and social avoidance over time; however, avoiding social situations predicted depressed mood later. The temporal effects can be found in Table S2 and in Figure 1.
Aim 2: Examining person-specific factors that characterize SAD-MDD comorbidity
Across all person-specific VAR models, feeling sad appeared to be the item with the highest expected influence for the most people (n = 13; 37.14%), followed by feeling calm (n = 9; 25.71%). Feeling lonely (the item with the largest expected influence in the contemporaneous group-level model) exhibited the largest expected influence for only four women’s models. All person-specific models are presented in Figures S1, S2.
The most common statistically significant path was a positive association between feeling sad and feeling lonely (n = 29; 82.86%). Only about half of the women displayed a positive, statistically significant partial association between feeling sad and feeling anxious (n = 10; 54.29%). Interestingly, only one woman’s model suggested a negative contemporaneous association between feeling anxious and avoiding social situations and no person-specific temporal models demonstrated a relationship between feeling anxious and avoiding social situations. Temporal VAR models were sparse – the most common paths were autoregressive effects for feeling sad, feeling accomplished, and avoiding social situations (each n = 3; 8.57%). To more closely examine person-specific differences, we chose three women who completed the most assessments (T = 146 – 148) and have highlighted results from their person-specific models below. Their contemporaneous effects are listed in Table S1 and models displayed in Figure 2.
Figure 2. Contemporaneous person-specific models (graphicalVAR).
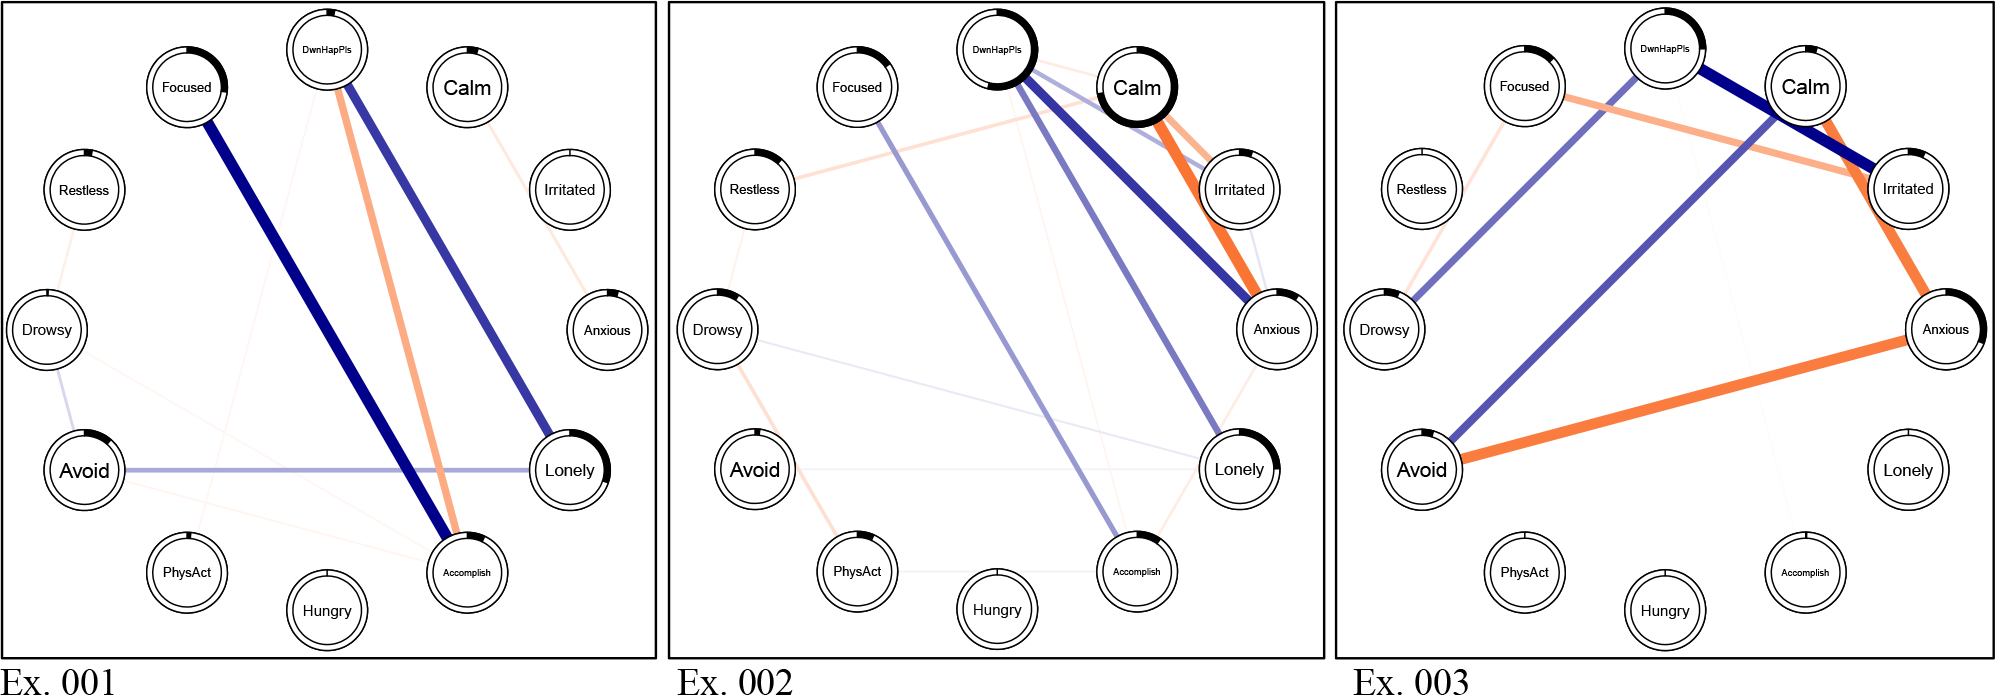
Note. The contemporaneous model demonstrates the individual-level partial associations from the person-specific VAR models for three exemplar participants. Dark blue pathways represent positive relationships; orange pathways represent negative relationships; the width of the line corresponds to the magnitude of the relationship. The extent to which the ring around each node is solid reflects the magnitude of the expected influence for each node – rings with more shading reflect nodes with larger expected influence on the network. Ex. = exemplar particiapnt; DwnHapPls = average composite of Down, Happy (reverse scored), and Pleased (reverse scored); Accomplish = Accomplished; PhysAct = Physical Activity; Avoid = Avoiding social situations.
The first woman met criteria for SAD, MDD Recurrent, and panic disorder. For her, feeling lonely exhibited the highest expected influence (EI = 0.30) followed by feeling focused (EI = 0.27), suggesting that these constructs were the most connected to other nodes in the contemporaneous network. Feeling lonely was positively associated with depressed mood and avoidance of social situations. Depressed mood was negatively associated with feeling accomplished and amount of physical activity since the last assessment. Social avoidance was negatively associated with feeling less accomplished. Finally, depressed mood exhibited a positive autoregressive effect.
The second woman met criteria for SAD, past MDD, and SUD. Feeling calm exhibited the largest expected influence (EI = −0.72) on her contemporaneous network, followed by depressed mood (EI = 0.54). Her contemporaneous model demonstrated that feeling calm was negatively associated with depressed mood, feeling irritable, feeling anxious, and feeling restless. Furthermore, depressed mood was positively associated with feeling irritable, anxious, lonely, and feeling (less) accomplished. Feeling anxious was associated with feeling more irritable and less accomplished. Feeling lonely was positively associated with social avoidance and feeling drowsy. Both depressed mood and social avoidance exhibited positive autoregressive effects.
Finally, the third woman met criteria for SAD, recurrent MDD, and AUD. For her, feeling anxious exhibited the largest expected influence (EI = −0.31), followed by depressed mood (EI = 0.25). Accordingly, feeling anxious was negatively associated with feeling calm and social avoidance. Additionally, depressed mood was associated with feeling more irritated, feeling more drowsy, and feeling less accomplished. Finally, there were no statistically significant temporal effects.
Aim 3: Comparing group-level and person-specific model estimates
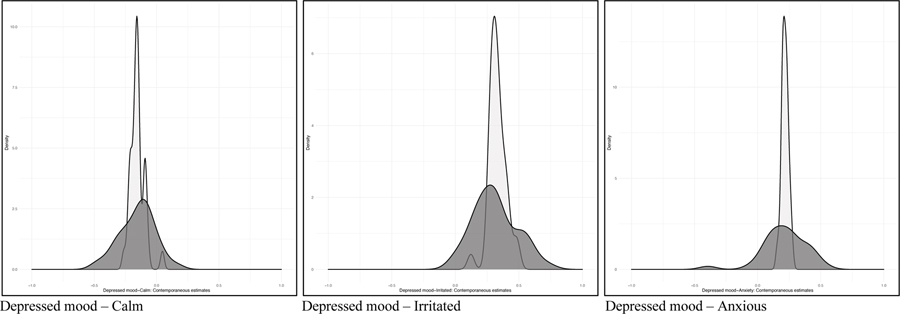
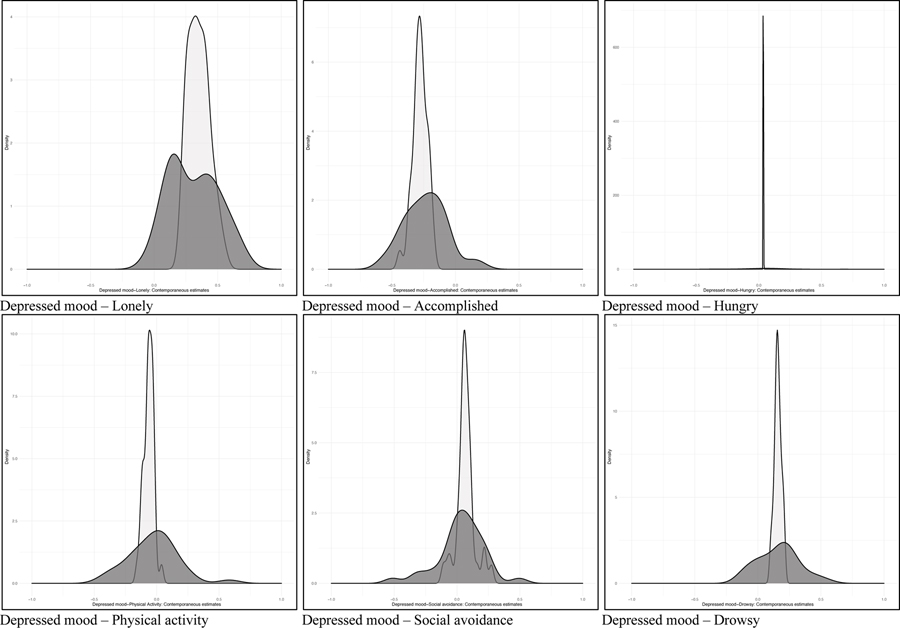
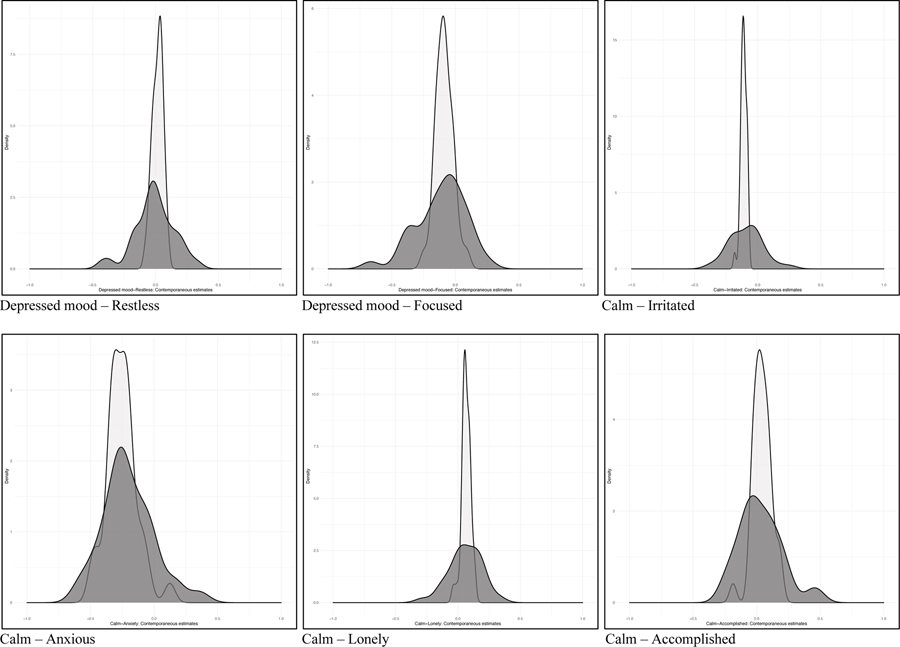
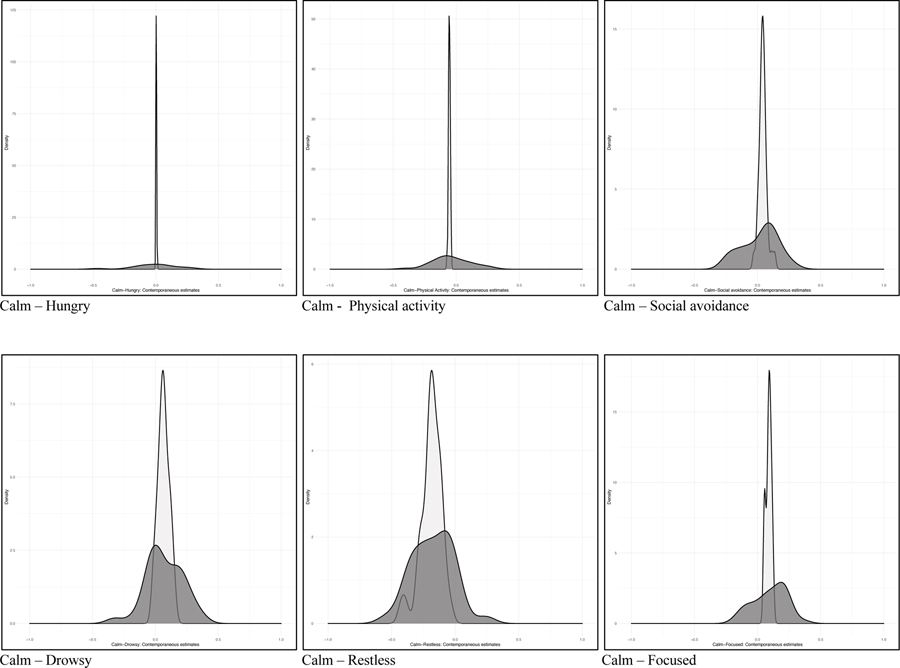
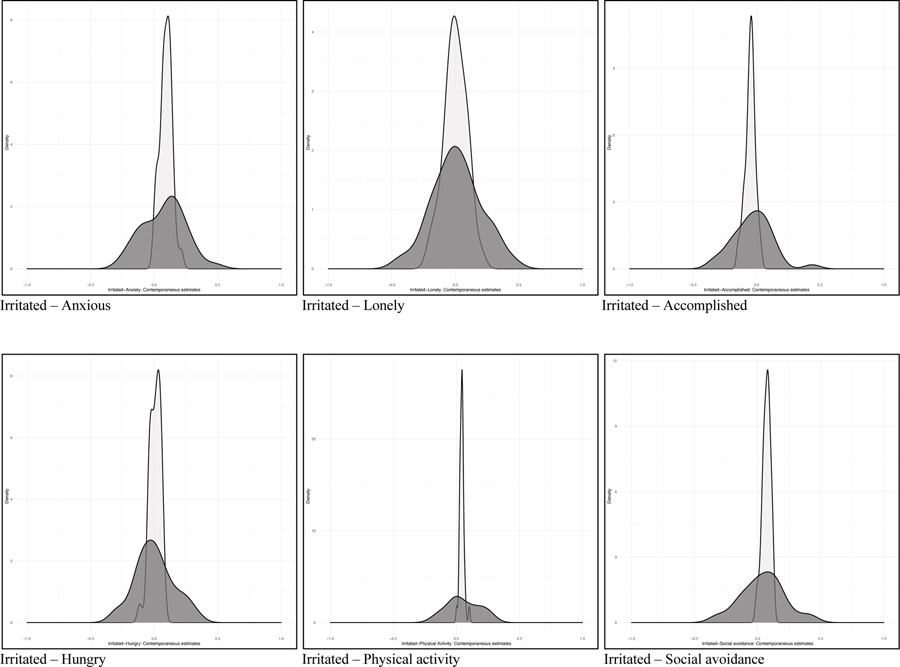
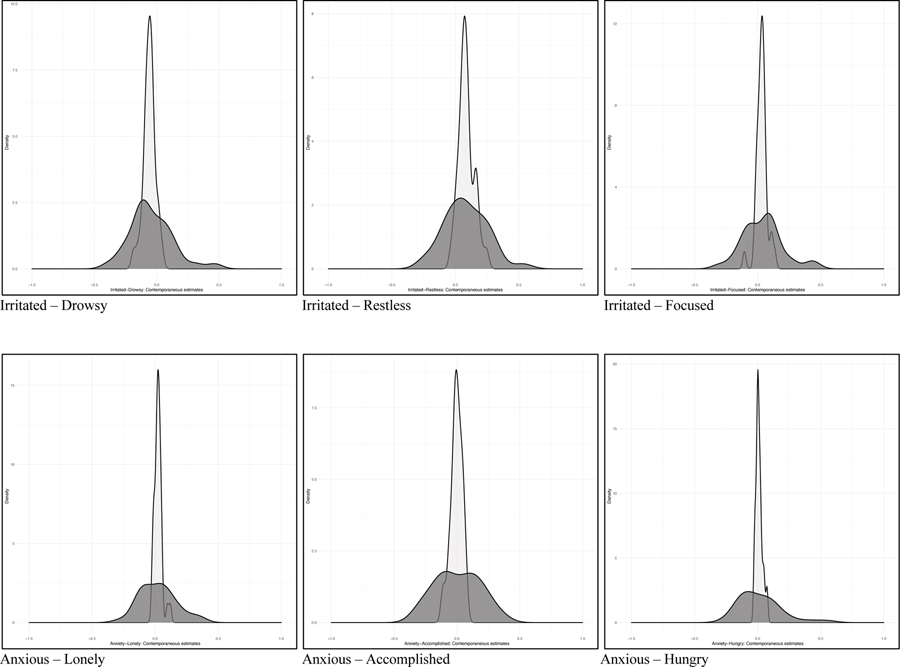
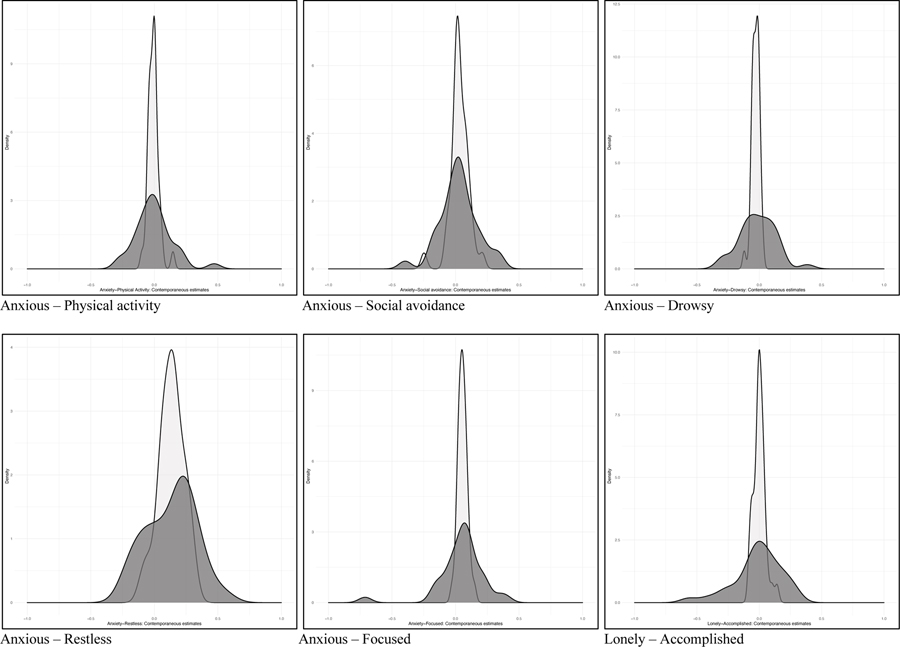
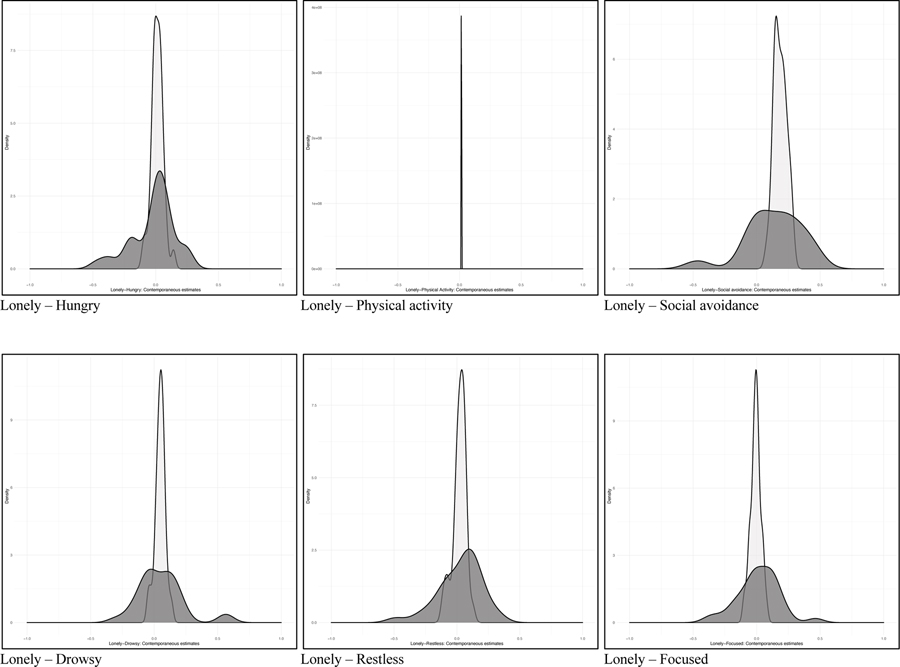
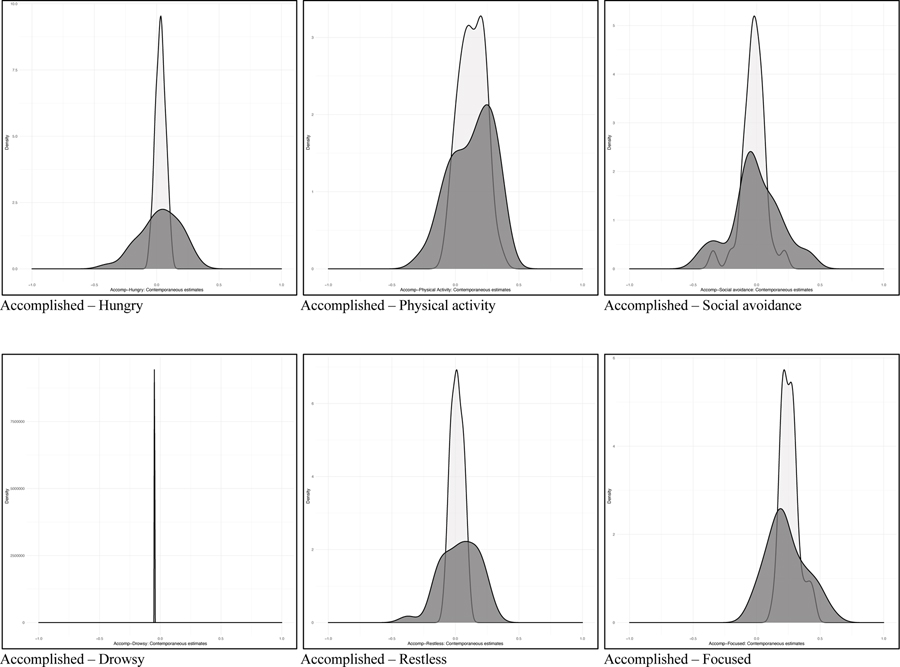
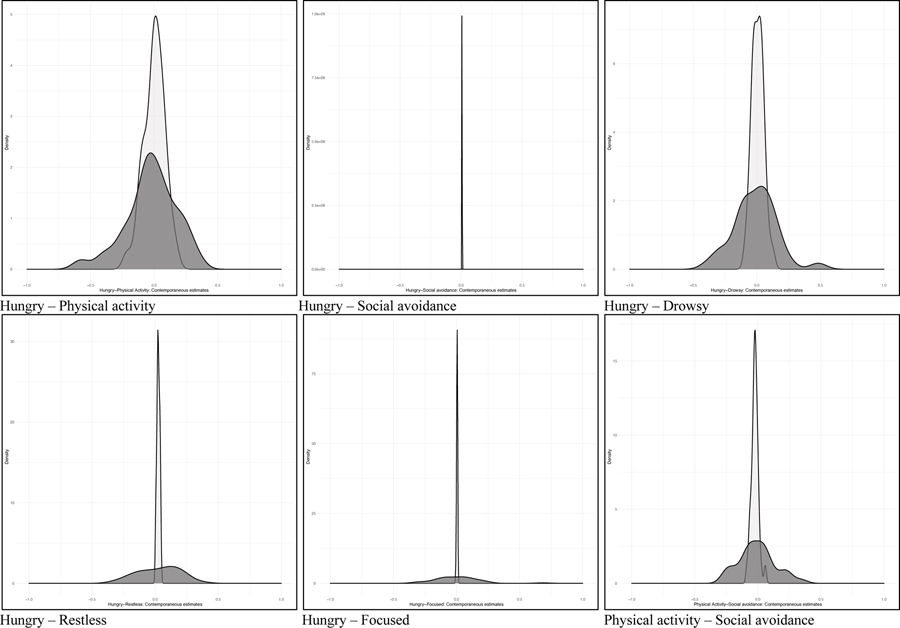
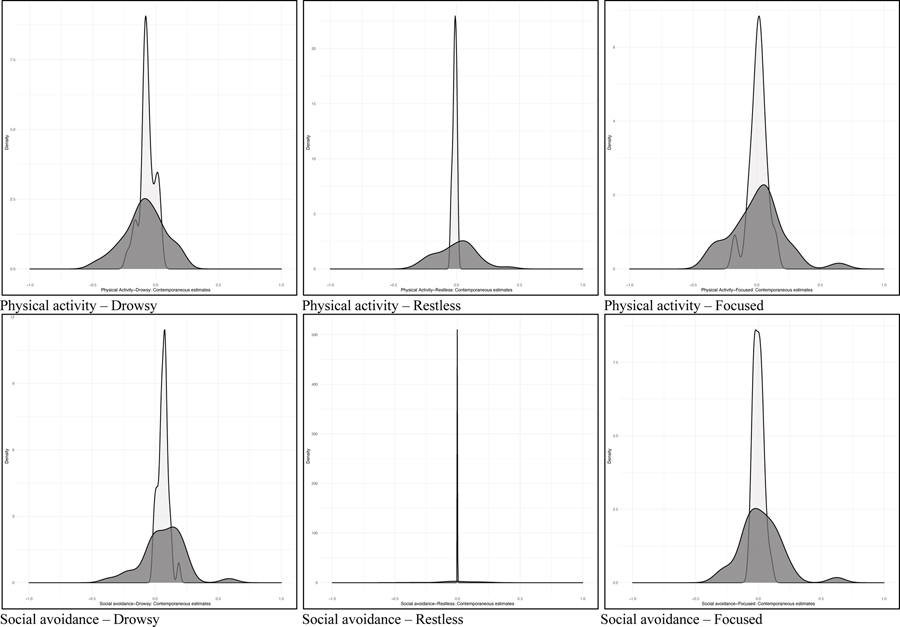
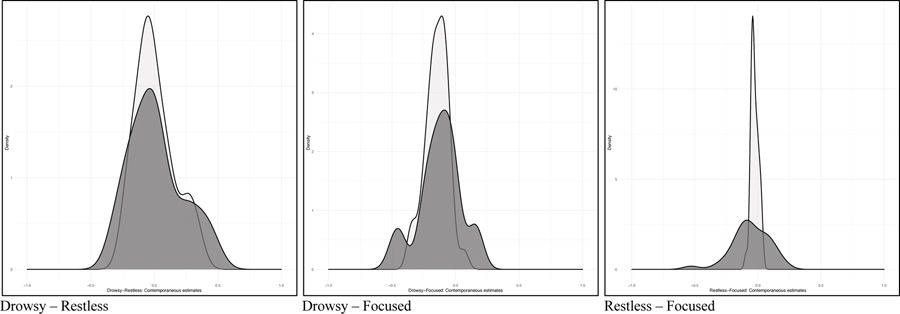
Finally, we compared the individual-level estimates generated from the ML-VAR model to the individual-level estimates obtained from the person-specific VAR models to determine the extent to which both methods produced similar person-specific estimates. Larger correlations or overlap in distributions would suggest that the multilevel model uses assumptions about individuals within the group that correspond to the person-specific models. Overall, the correlations between the contemporaneous individual-level estimates across the two sources for each pathway and for each person were large (rs = .68 – 93; see Table 2), as were the correlations between the autoregressive individual-level estimates derived from the ML-VAR models and the autoregressive estimates derived from the person-specific VAR models (rs = .70 – 91). We also examined the correlations between the individual-level adjacency matrices from the person-specific VAR models and the ML-VAR models; correlations ranged in size but were large on average (rs = .19 – .93, rmean = .75) and the strength of this correlation varied as a function of missingness (r = −.79). However, these strong correlations do not mean that the parameters were equivalent across methods. When plotting the distribution of the estimates across methods, the shape and spread of the distribution of autoregressive effects varied across effects (see Figure 3, Figure S5), with person-specific methods producing a consistently wider spread of estimated effects.
Table 2.
Correlations between individual-level contemporaneous estimates generated from the multilevel model and individual-level contemporaneous estimates obtained from person-specific model
| DHP | Calm | Irritated | Anxious | Lonely | Accomp | Hungry | PhysAct | Avoid | Drowsy | Restless | Focused | |
|---|---|---|---|---|---|---|---|---|---|---|---|---|
|
| ||||||||||||
| DHP | ||||||||||||
| Calm | .74 | |||||||||||
| Irritated | .84 | .73 | ||||||||||
| Anxious | .77 | .82 | .88 | |||||||||
| Lonely | .93 | .87 | .91 | .68 | ||||||||
| Accomp | .85 | .84 | .83 | .81 | .88 | |||||||
| Hungry | .77 | .88 | .81 | .85 | .76 | .80 | ||||||
| PhysAct | .84 | .73 | .83 | .79 | .57 | .90 | .88 | |||||
| Avoid | .84 | .81 | .87 | .81 | .88 | .83 | .72 | .76 | ||||
| Drowsy | .71 | .82 | .77 | .77 | .82 | .77 | .69 | .80 | .81 | |||
| Restless | .69 | .88 | .80 | .91 | .87 | .87 | .81 | .89 | .89 | |||
| Focused | .87 | .75 | .86 | .81 | .76 | .82 | .85 | .87 | .84 | .83 | .79 | |
Note. These values represent the correlations generated from the individual-level contemporaneous multilevel model and the estimates obtained from the person-specific contemporaneous models. The standard deviation for the multilevel pathway between Avoid and Restless was 0 for the multilevel model; thus, a correlation value was not able to be calculated for this pathway. DwnHapPls = average composite of Down, Happy (reverse scored), and Pleased (reverse scored); Accomplish = Accomplished; PhysAct = Physical Activity; Avoid = Avoiding social situations.
Figure 3. Density plot displaying the distribution of correlations between the contemporaneous individual-level estimates generated from multilevel model and the contemporaneous individual-level estimates from the person-specific VAR models.
Note. Density curves shaded in lighter grey represent the individual-level estimates from the ML-VAR model. Density curves shaded in darker grey represent the individual-level estimates from the person-specific VAR models.
Discussion
We constructed models of SAD-MDD comorbidity-related factors and demonstrated that the relationships between symptoms like depressed mood or anxiety varied greatly for each woman with this comorbidity. We hypothesized that factors such as anxiety, loneliness, and social avoidance would predict depressed mood over time and that each person-specific VAR model would demonstrate individual-level differences. We constructed contemporaneous and temporal ML-VAR models to evaluate the intra-daily interactions between cognitive-affective and behavioral variables that maintain SAD-MDD comorbidity demonstrating that depressed mood, feeling lonely, and feeling calm had the highest expected influence, accounting for many of the pathways in the contemporaneous model and demonstrating stronger connections to other constructs in the temporal model. Furthermore, avoiding social situations and feeling drowsy appeared to be the items that were the most influenced by other variables in the network over time. Overall, our results largely matched our hypotheses and results seen from other network analyses of comorbid anxiety and depression (see Groen et al., 2020). Specifically, depressed mood was strongly connected to other mood states (e.g., feeling irritated), cognitive states (e.g., feeling accomplished), and behavioral states (e.g., physical activity) over time, but avoiding social situations was more influenced by other variables (rather than a predictor of other variables) – at least when measured every three hours in women with comorbid SAD and MDD.
Examining the contemporaneous ML-VAR model suggested that depressed mood appeared to be strongly associated with other affective variables, such as feeling anxious, lonely, and irritable, in addition to physiological symptoms (e.g., feeling drowsy) and behavioral variables, such as avoiding social situations. These results suggest that the intensity of depressed mood within the day – versus the intensity of feeling anxious or the amount to which an individual avoids social situations – may carry the most interpretative value in understanding what else women with SAD-MDD comorbidity may be experiencing at a given point in time. When considering cognitive-behavioral skills for treating SAD-MDD comorbidity, these results suggest that targeting depressed mood may have a more widespread effect on related symptoms, versus focusing on anxiety or other related factors in isolation.
Additionally, the temporal ML-VAR model revealed that feeling lonely predicted increased depressed mood and greater social avoidance later, clarifying our understanding of the role of loneliness in understanding SAD-MDD comorbidity. For example, the cumulative interpersonal risk model (Epkins & Heckler, 2011) and evidence from additional longitudinal work (Lim et al., 2016) highlight the unique associations of loneliness with social anxiety and depression, particularly for adolescent women. Our results extend this work by demonstrating that loneliness also predicts depressed mood and greater social avoidance within the day. Thus, skills targeting loneliness (e.g., interpersonal strategies, cognitive restructuring) in addition to skills targeting depressed mood may be more impactful at resolving symptoms over time.
It was somewhat surprising that avoiding social situations predicted greater depressed mood versus greater anxiety within the day, given that all women in this study were diagnosed with SAD and the anxiety-avoidance relationship is considered a hallmark of the disorder (Heimberg, 2002; Heimberg et al., 2014). Although there was some variance in the social avoidance item, suggesting that women were engaging in avoidance throughout the month, an additional reason for this contradictory finding could be due to the timescale with which constructs were measured. For example, we measured constructs over the course of three hours. However, it is likely that many individuals would experience lower levels of anxiety occurring immediately following avoidance on the timescale of seconds or minutes and that avoidance would predict greater anxiety later on the timescale of hours or day(s). Furthermore, we hypothesize the length of time that this negative relationship persists would vary across individuals (based on other trait level characteristics) and within individuals (based on the level of anxiety experienced and type of event avoided). Alternatively, our EMA item measured anxiety broadly and, thus, this item may have lacked the construct validity needed to accurately reflect the relationship with avoidance of social situations specifically. Future research using EMA over varying periods of time would be helpful in further understanding the dynamics between anxiety and avoidance behavior.
Consistent with our second aim, we found considerable individual-level variability across the person-specific VAR models. For example, although loneliness was a highly influential item in the contemporaneous group-level network, it was rarely a highly influential item within the individual-level models. Furthermore, there was a strong association between feeling sad and feeling anxious on the group-level; however, this association was significant for just over half of the women, suggesting that for many women, their depressed mood and anxiety may not be as closely associated.
Examining the exemplar person-specific models demonstrated that for one woman, engaging in more physical activity since the last time point was associated with feeling less sad. Thus, her clinician might recommend maintaining a regular activity or exercise routine to assist with managing her mood. Furthermore, her model also demonstrated that when she avoided social situations, she (understandably) felt less anxious, but also felt less accomplished. Her clinician might be able to use this information to help illustrate cognitive-behavioral principles and validate that avoiding social situations reduces anxiety in the moment, while also demonstrating that avoiding social situations is associated with feeling less accomplished. Moreover, for this woman, feeling less accomplished was also associated with increased depressed mood– building additional rationale for targeting social avoidance as a intervention for increasing positive affect and managing mood. These findings contribute to a growing field of evidence suggesting that personalized EMA feedback can improve outcomes from standard psychological interventions (Kramer et al., 2014; Simons et al., 2015). Future work is necessary to continue the translational process of implementing these findings into clinical practice. For example, clinical researchers have developed web-based platforms to integrate client and clinician input into these models advancing implementation (PREMISE, Burger et al., 2021; PETRA, Riese et al., 2021). Additional implementation efforts could develop mobile platforms to support individuals engaging in self-help or fully digital-based interventions.
The comparison between the individual-level estimates generated from the person-specific VAR models and the individual-level estimates generated from the ML-VAR model also provides some guidance for how clinical researchers can utilize intensive EMA to personalize assessment and interventions going forward. Practically, ML-VAR models require fewer observations from each individual; therefore, building a multilevel framework to provide individual-level estimates to guide personalized assessment and treatment could be easier to implement in clinical and applied settings (i.e., patients would be required to do less intensive EMA to generate personalized feedback). Accordingly, results from the third aim comparing individual-level estimates suggested that, on average, there were large correlations between the individual-level estimates obtained from the ML-VAR and person-specific VAR models. Similarly, unpublished data from a previous study suggested that multilevel models that model individual-level variability with greater specificity (i.e., a greater number of random paths and error terms) produce estimates that correlate moderately to highly with estimates from person-specific models (Rodebaugh et al., 2020).
However, the shape and spread of the distributions for the individual-level estimates were large, suggesting that for some individuals there was a clear difference in the predicted individual-level estimates from the multilevel model versus the person-specific model. In part, the spread of the distributions for the individual-level estimates from the multilevel model were consistently smaller, as is to be expected due to the shrinkage that occurs due to assuming a similar probability distribution during the model estimation process. Additionally, the larger spread in the individual-level estimates from the person-specific models is almost certainly a result of lower statistical power in the person-specific models. Still, for some effects (e.g., the contemporaneous effect between depressed mood and feeling lonely, autoregressive effect of depressed mood, cross-lagged effect of depressed mood and feeling irritable) there seemed to be a clear difference in the shape of the distributions. Thus, a complementary hypothesis could be that the multilevel model is making different assumptions about the individual when generating their estimates by assuming that all individuals are part of a shared distribution. This assumption may not be adequate for all individuals within the group, limiting the generalizability of our theoretical models to specific individuals and hindering our ability to provide accurate, personalized care.
The limitations of this study assist in outlining next steps for research on intensive EMA design and personalization. For example, these results reflect the relationships that are demonstrated when items are sampled every three hours; however, the time course of mood, symptoms, and emotional experiences likely varies on an individual level (Bosley & Fisher, 2020; Howe et al., 2020). Furthermore, it is growing increasingly evident that more intensive EMA assessment schedules over longer periods of time are needed to construct personalized models with sufficient accuracy (Mansueto et al., 2020). It may be that more time points are needed to find many person-specific effect; our temporal person-specific models were sparse, consistent with results from simulation studies (Mansueto et al., 2020) and previous empirical work (Frumkin et al., 2021). Although it was unclear what effects we could have used for an a priori power analysis, our results and results from recent work could be used for simulations that could properly estimate power for future analyses.
Additionally, we used single EMA items to represent many of the constructs in our study and reduce burden. Arguably, a stronger psychometric approach would have been to administer several items related to each construct (i.e., similar to the depressed mood composite variable). Finally, these results are descriptive in nature from women with a similar psychiatric profile. Thus, future research aimed at cross-validation via modeling across much larger groups of individuals with the full matrix of comorbid SAD-MDD (e.g., SAD but not MDD or vice versa), as well as work with more diverse individuals who share key traits or characteristics is needed to examine the robustness of network analytic approaches. Additionally pursuing intensive EMA within the context of experimental design is sorely needed to determine the extent to which individuals truly differ from the group. Pursuing these issues in future work will provide evidence to answer key questions in the field of personalization – that is, do group-level models ever fully describe individuals within the group, and if so, when and under what circumstances?
Our results illustrate the extent to which women with SAD-MDD comorbidity differ from each other and assist with advancing our understanding of how personalized models may be used to shape clinical case conceptualizations and treatments for specific individuals. Our study underscores the tremendous need for future research in this area as we move towards designing and testing future personalized assessments, treatments, and directives for care.
Supplementary Material
Highlights:
Clinical research evidence supports a call for personalized approaches to care.
Examining SAD and MDD comorbidity revealed person-specific patterns.
We discuss how personalized networks could guide behavioral interventions.
Acknowledgments
We wish to thank Dr. Rick Heimberg for his helpful feedback that he shared in his review of this work, as well as the feedback shared by Dr. Renee Thompson, Dr. Josh Jackson, and Dr. Eric Lenze who also reviewed this work in its earlier stages. We also thank Drs. Natasha Tonge, Madelyn Frumkin, Anna Karam, Elizabeth Hawkey, Patrick Cruitt, and Zoe Hawks, as well as Erin Bondy, Alison Moreau, and Jason Grossman who assisted with parts of data collection for this study.
Footnotes
There was an error in the scale creation of two EMA items that affected two participants in the sample. These participants used a 0 – 100 integer sliding scale instead of a 0 – 10 integer sliding scale. Responses from these two items were collapsed to form a 0 – 10 integer scale (i.e., a 70 was converted to a 7).
Further inspection of time trends suggested that residualizing data to remove linear trends may not have been necessary, as many individuals’ data did not display clear (or linear) trends of time. However, some individual’s data demonstrated trends that were nonlinear (e.g., cyclic) in nature. We conducted a sensitivity analysis to remove nonlinear trends by fitting a loess model. Results from these models were largely similar to the models in which a linear trend was removed. Thus, we report results from the main analyses removing the linear trend and include plots from models removing the nonlinear trend in supplementary material (Figures S2, S3).
We calculated unregularized person-specific VAR models and compared the estimates from these models with the individual-level estimates from the ML-VAR model as the individual-level estimates from ML-VAR are not regularized.
Declarations of interest: none.
Publisher's Disclaimer: This is a PDF file of an unedited manuscript that has been accepted for publication. As a service to our customers we are providing this early version of the manuscript. The manuscript will undergo copyediting, typesetting, and review of the resulting proof before it is published in its final form. Please note that during the production process errors may be discovered which could affect the content, and all legal disclaimers that apply to the journal pertain.
References
- Acarturk C, de Graaf R, van Straten A, ten Have M, & Cuijpers P (2008). Social phobia and number of social fears, and their association with comorbidity, health-related quality of life and help seeking. Social Psychiatry and Psychiatric Epidemiology, 43(4), 273–279. 10.1007/s00127-008-0309-1 [DOI] [PubMed] [Google Scholar]
- American Psychiatric Association. (2013). Diagnostic and statistical manual of mental disorders : DSM-5 (5th ed.). American Psychiatric Association. [Google Scholar]
- Beck J (2011). Cognitive Behavioral Therapy (2nd ed.). Guilford Press. [Google Scholar]
- Bosley HG, & Fisher AJ (2020). Mapping the idiographic dynamics of emotion. 32nd Annual Meeting of the Association for Psychological Science. [Google Scholar]
- Burger J, Epskamp S, Veen DC, Van Der, Dablander F, Schoevers RA, Fried EI, & Riese H (2021). A clinical PREMISE for personalized models: Towards a formal integration of case formulations and statistical networks. In PsyArXiv. [DOI] [PubMed] [Google Scholar]
- Clark LA, & Watson D (1991). Tripartite model of anxiety and depression: psychometric evidence and taxonomic implications. Journal of Abnormal Psychology, 100, 316–336. 10.1037/0021-843x.100.3.316 [DOI] [PubMed] [Google Scholar]
- Cramer AO, van Borkulo CD, Giltay EJ, van der Maas HL, Kendler KS, Scheffer M, & Borsboom D (2016). Major depression as a complex dynamic system. PLOS ONE, 11. 10.1371/journal.pone.0167490 [DOI] [PMC free article] [PubMed] [Google Scholar]
- Epkins CC, & Heckler DR (2011). Integrating etiological models of social anxiety and depression in youth: Evidence for a cumulative interpersonal risk model. Clinical Child and Family Psychology Review, 14(4), 329–376. 10.1007/s10567-011-0101-8 [DOI] [PubMed] [Google Scholar]
- Epskamp S (2018). GraphicalVAR: Graphical VAR for experience sampling data (0.2.2). [Google Scholar]
- Epskamp Sacha, Waldorp LJ, Mõttus R, & Borsboom D (2018). The Gaussian Graphical Model in cross-sectional and time-series data. Multivariate Behavioral Research. 10.1080/00273171.2018.1454823 [DOI] [PubMed] [Google Scholar]
- Erwin BA, Heimberg RG, Juster H, & Mindlin M (2002). Comorbid anxiety and mood disorders among persons with social anxiety disorder. Behaviour Research and Therapy, 40(1), 19–35. 10.1016/S0005-7967(00)00114-5 [DOI] [PubMed] [Google Scholar]
- Fisher AJ (2015). Toward a dynamic model of psychological assessment: Implications for personalized care. Journal of Consulting and Clinical Psychology, 83(4), 825–836. 10.1037/ccp0000026 [DOI] [PubMed] [Google Scholar]
- Fisher AJ, Medaglia JD, & Jeronimus BF (2018). Lack of group-to-individual generalizability is a threat to human subjects research. Proceedings of the National Academy of Sciences of the United States of America, 115(27), E6106–E6115. 10.1073/pnas.1711978115 [DOI] [PMC free article] [PubMed] [Google Scholar]
- Fisher AJ, Reeves JW, Lawyer G, Medaglia JD, & Rubel JA (2017). Exploring the idiographic dynamics of mood and anxiety via network analysis. Journal of Abnormal Psychology, 126(8), 1044–1056. 10.1037/abn0000311 [DOI] [PubMed] [Google Scholar]
- Fried EI, & Cramer AOJ (2017). Moving forward: Challenges and directions for psychopathological network theory and methodology. Perspectives on Psychological Science, 12, 999–1020. 10.1177/1745691617705892 [DOI] [PubMed] [Google Scholar]
- Frumkin MR, Piccirillo ML, Beck ED, Grossman J, & Rodebaugh TL (2021). Feasibility and utility of idiographic models in the clinic: A pilot study. Psychotherapy Research, 31(4), 520–534. 10.1080/10503307.2020.1805133 [DOI] [PMC free article] [PubMed] [Google Scholar]
- Groen RN, Ryan O, Wigman JTW, Riese H, Penninx BWJH, Giltay EJ, Wichers M, & Hartman CA (2020). Comorbidity between depression and anxiety: Assessing the role of bridge mental states in dynamic psychological networks. BMC Medicine, 18(1), 1–17. 10.1186/s12916-020-01738-z [DOI] [PMC free article] [PubMed] [Google Scholar]
- Hamaker EL, Dolan CV, & Molenaar PCM (2005). Statistical modeling of the individual: Rationale and application of multivariate stationary time series analysis. Multivariate Behavioral Research, 40, 179–205. 10.1207/s15327906mbr4002 [DOI] [PubMed] [Google Scholar]
- Hamaker Ellen L. (2012). Why researchers should think “within-person”: A paradigmatic rationale. In Mehl MR & Conner TS (Eds.), Handbook of Research Methods for Studying Daily Life (pp. 43–61). Guilford Press. [Google Scholar]
- Hambrick JP, Weeks JW, Harb GC, & Heimberg RG (2003). Cognitive-behavioral therapy for social anxiety disorder: Supporting evidence and future directions. CNS Spectrums, 8(5), 373–381. 10.1017/S1092852900018630 [DOI] [PubMed] [Google Scholar]
- Heimberg RG (2002). Cognitive-behavioral therapy for social anxiety disorder: Current status and future directions. Biological Psychiatry, 51, 101–108. 10.1016/S0006-3223(01)01183-0 [DOI] [PubMed] [Google Scholar]
- Heimberg RG, Brozovich FA, & Rapee RM (2014). A cognitive-behavioral model of social anxiety disorder. In Hofmann PM, S.G. & DiBartolo(Ed.), Social Anxiety: Clinical, Developmental, and Social Perspectives (3rd ed., pp. 705–728). Elsevier. 10.1016/B978-0-12-394427-6.00024-8 [DOI] [Google Scholar]
- Hektner JM, Schmidt JA, & Csikszentmihalyi M (2007). Experience sampling method: Measuring the quality of everyday life. SAGE Publications Inc. [Google Scholar]
- Howe E, Bosley HG, & Fisher AJ (2020). Idiographic network analysis of discrete mood states prior to treatment. Counselling and Psychotherapy Research, 20(3), 470–478. 10.1002/capr.12295 [DOI] [Google Scholar]
- Jacobson N (2015). Anxious moods as a risk factor for depressed moods: An ecological momentary assessment of those with clinical anxiety and depression. Pennsylvania State University. [Google Scholar]
- Kessler RC, Berglund P, Demler O, Jin R, Merikangas KR, & Walters EE (2005). Lifetime prevalence and age-of-onset distributions of DSM-IV disorders in the National Comorbidity Survey Replication. Archives of General Psychiatry, 62, 593–602. 10.1001/archpsyc.62.6.593 [DOI] [PubMed] [Google Scholar]
- Kramer I, Simons CJP, Hartmann JA, Menne-Lothmann C, Viechtbauer W, Peeters F, Schruers K, van Bemmel AL, Myin-Germeys I, Delespaul P, van Os J, & Wichers M (2014). A therapeutic application of the experience sampling method in the treatment of depression: a randomized controlled trial. World Psychiatry, 13(1), 68–77. 10.1002/wps.20090 [DOI] [PMC free article] [PubMed] [Google Scholar]
- Leach LS, Christensen H, Mackinnon AJ, Windsor TD, & Butterworth P (2008). Gender differences in depression and anxiety across the adult lifespan: The role of psychosocial mediators. Social Psychiatry And Psychiatric Epidemiology, 43(12), 983–998. 10.1007/s00127-008-0388-z [DOI] [PubMed] [Google Scholar]
- Lecrubier Y, Sheehan DV, Weiller E, Amorim P, Bonora I, Sheehan KH, & Dunbar GC (1997). The Mini International Neuropsychiatric Interview (MINI): A short diagnostic structured interview. European Psychiatry, 12, 224–231. 10.1016/S0924-9338(97)83296-8 [DOI] [Google Scholar]
- Lim MH, Rodebaugh TL, Zyphur MJ, & Gleeson JFM (2016). Loneliness over time: The crucial role of social anxiety. Journal of Abnormal Psychology, 125(5), 620–630. 10.1037/abn0000162 [DOI] [PubMed] [Google Scholar]
- Mansueto AC, Wiers RW, van Weert JCM, Schouten BC, & Epskamp S (2020). Investigating the feasibility of idiographic network models. [DOI] [PubMed] [Google Scholar]
- Mineka S, Watson D, & Clark LA (1998). Comorbidity of anxiety and unipolar mood disorders. Annual Review of Psychology, 49, 377–412. 10.1146/annurev.psych.49.1.377 [DOI] [PubMed] [Google Scholar]
- Molenaar PCM (2004). A manifesto on psychology as idiographic science: Bringing the person back into scientific psychology, this time forever. Measurement, 2(4), 201–218. 10.1207/s15366359mea0204_1 [DOI] [Google Scholar]
- Morrison AS, & Heimberg RG (2013). Social anxiety and social anxiety disorder. Annual Review of Clinical Psychology, 9, 249–274. 10.1146/annurev-clinpsy-050212-185631 [DOI] [PubMed] [Google Scholar]
- Moscovitch DA, Hofmann SG, Suvak MK, & In-Albon T (2005). Mediation of changes in anxiety and depression during treatment of social phobia. Journal of Consulting and Clinical Psychology, 73(5), 945–952. 10.1037/0022-006X.73.5.945 [DOI] [PubMed] [Google Scholar]
- Nolen-Hoeksema S, & Girgus JS (1994). The emergence of gender differences in depression during adolescence. Psychological Bulletin, 115(3), 424–443. 10.1037/0033-2909.115.3.424 [DOI] [PubMed] [Google Scholar]
- Piccirillo ML, Beck ED, & Rodebaugh TL (2019). A clinician’s primer for idiographic research: Considerations and recommendations. Behavior Therapy, 50(5), 938–951. 10.1016/j.beth.2019.02.002 [DOI] [PubMed] [Google Scholar]
- Riese H, Wichers M, Bos F, Veermans E, von Klipstein L, Emerencia A, Verhage T, Carlier R, & Brouwer J (2021). PETRA: Personalized treatment by real-time assessment. https://www.petrapsy.nl/en/
- Robinaugh DJ, Millner AJ, & Mcnally RJ (2016). Identifying highly influential nodes in the complicated grief network. Journal of Abnormal Psychology, 125(6), 747–757. 10.1037/abn0000181.supp [DOI] [PMC free article] [PubMed] [Google Scholar]
- Rodebaugh TL, Piccirillo ML, Frumkin MR, Gerull KM, Kallogjeri D, & Piccirillo JF (2020). Individual variation in tinnitus models as a potential predictor of intervention response.
- Sheehan D, Janavs J, Baker R, Harnett-Sheehan K, Knapp E, & Sheehan M (1998). M.I.N.I. Mini International Neuropsychiatric Interview. University of South Florida. [Google Scholar]
- Shiffman S, Stone AA, & Hufford MR (2008). Ecological momentary assessment. Annual Review of Clinical Psychology, 4, 1–32. 10.1146/annurev.clinpsy.3.022806.091415 [DOI] [PubMed] [Google Scholar]
- Simons CJP, Hartmann JA, Kramer I, Menne-Lothmann C, Hö Hn P, Van Bemmel AL, Myin-Germeys I, Delespaul P, Van Os J, & Wichers M (2015). Effects of momentary self-monitoring on empowerment in a randomized controlled trial in patients with depression. European Psychiatry, 30(8), 900–906. 10.1016/j.eurpsy.2015.09.004 [DOI] [PubMed] [Google Scholar]
- Starr LR, Hammen C, Connolly NP, & Brennan PA (2014). Does relational dysfunction mediate the association between anxiety disorders and later depression? Testing an interpersonal model of comorbidity. Depression and Anxiety, 31(1), 77–86. 10.1002/da.22172 [DOI] [PMC free article] [PubMed] [Google Scholar]
- Team, R. C. (2017). R: A language and environment for statistical computing. Foundation for Statistical Computing. http://www.r-project.org/ [Google Scholar]
- Wichers M (2014). The dynamic nature of depression: a new micro-level perspective of mental disorder that meets current challenges. Psychological Medicine, 44(7), 1349–1360. 10.1017/S0033291713001979 [DOI] [PubMed] [Google Scholar]
- Wichers M, Wigman JTW, & Myin-Germeys I (2015). Micro-level affect dynamics in psychopathology viewed from complex dynamical system theory. Emotion Review, 7, 362–367. 10.1177/1754073915590623 [DOI] [Google Scholar]
- Wichers Marieke, Smit AC, & Snippe E (2020). Early warning signals based on momentary affect dynamics can expose nearby transitions in depression: A confirmatory single-subject time-series study. Journal for Person-Oriented Research, 6(1), 1–15. 10.17505/jpor.2020.22042 [DOI] [PMC free article] [PubMed] [Google Scholar]
Associated Data
This section collects any data citations, data availability statements, or supplementary materials included in this article.


