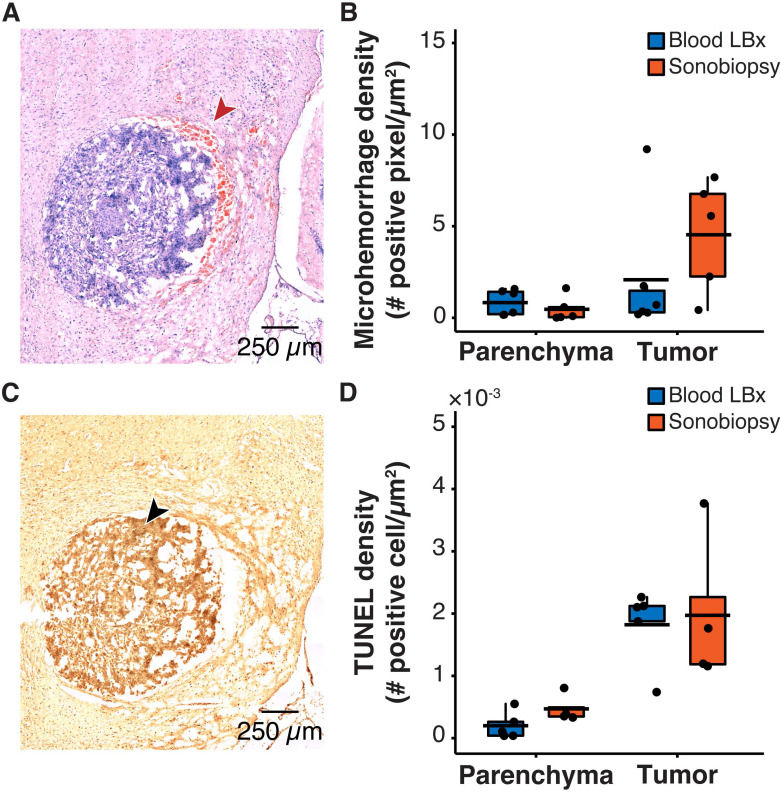
Figure 3.
Sonobiopsy did not cause significant acute damage. (A) Representative H&E staining for a subject treated with sonobiopsy. The red arrow points to microhemorrhage in the tumor ROI. (B) The microhemorrhage density in the parenchyma after sonobiopsy (0.47 ± 0.68 positive pixels/µm2, n = 5) was not significantly different compared with that after blood LBx (0.83 ± 0.69 positive pixels/µm2; n = 5, p = 0.33; unpaired two-sample Wilcoxon signed rank test). There was a nonsignificant increase in microhemorrhage occurrence in the tumor ROI after sonobiopsy (4.54 ± 3.08 positive pixels/µm2, n = 5) compared with that after blood LBx (2.08 ± 3.54 positive pixels/µm2; n = 5, p = 0.18; unpaired two-sample Wilcoxon signed rank test). (C) Representative TUNEL staining for a subject treated with sonobiopsy depicts increased apoptotic signal in the tumor ROI. The black arrow points to an apoptotic cell. (D) There was no significant difference in TUNEL density for the parenchyma between blood LBx (0.20×10⁻³ ± 0.22×10⁻³ positive cells/µm2, n = 5) and sonobiopsy (0.47×10⁻³ ± 0.22×10⁻³ positive cells/µm2; n = 5, p = 0.11; unpaired two-sample Wilcoxon signed rank test). There was no significant difference in TUNEL density for the tumor ROI between blood LBx (1.82×10⁻³ ± 0.62×10⁻³ positive cells/µm2, n = 5) and sonobiopsy (1.97×10⁻³ ± 1.22×10⁻³ positive cells/µm2; n = 5, p = 0.73; unpaired two-sample Wilcoxon signed rank test). Black bars indicate mean in B and D.

