Figure 6.
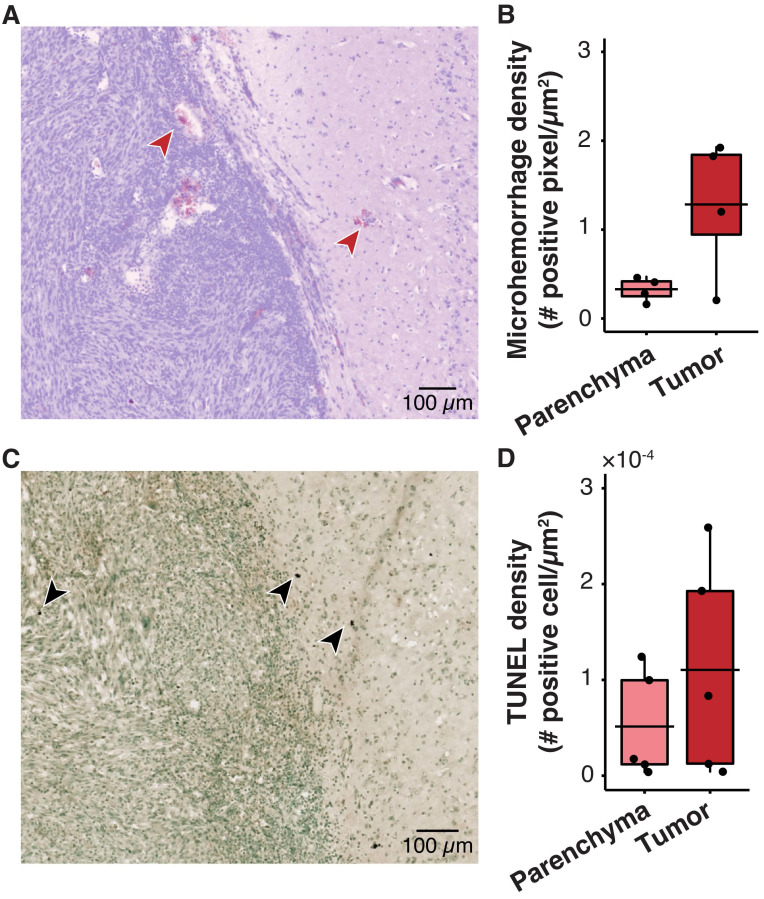
Histological analysis shows no significant tissue damage in pig GBM model. (A) Representative horizontal slice with H&E staining. The microhemorrhage occurs in some cases near the edge of the tumor (red arrows). (B) Microhemorrhage density was not significantly different between parenchyma (0.33 ± 0.13 positive pixels/µm2, n = 4) and tumor (1.28 ± 0.79 positive cells/µm2, n = 4, p = 0.20; unpaired two-sample Wilcoxon signed rank test). (C) Representative TUNEL staining depicts the apoptotic cells (black arrows). (D) There was no significant difference between the TUNEL density in the tumor (110.40×10⁻⁴ ± 112.25×10⁻⁴ positive cells/µm2, n = 4) compared with that in the parenchyma (51.34×10⁻⁴ ± 56.12×10⁻⁴ positive cells/µm2; (n = 4, p = 0.55; unpaired two-sample Wilcoxon signed rank test). Black bars indicate mean in B and D.

