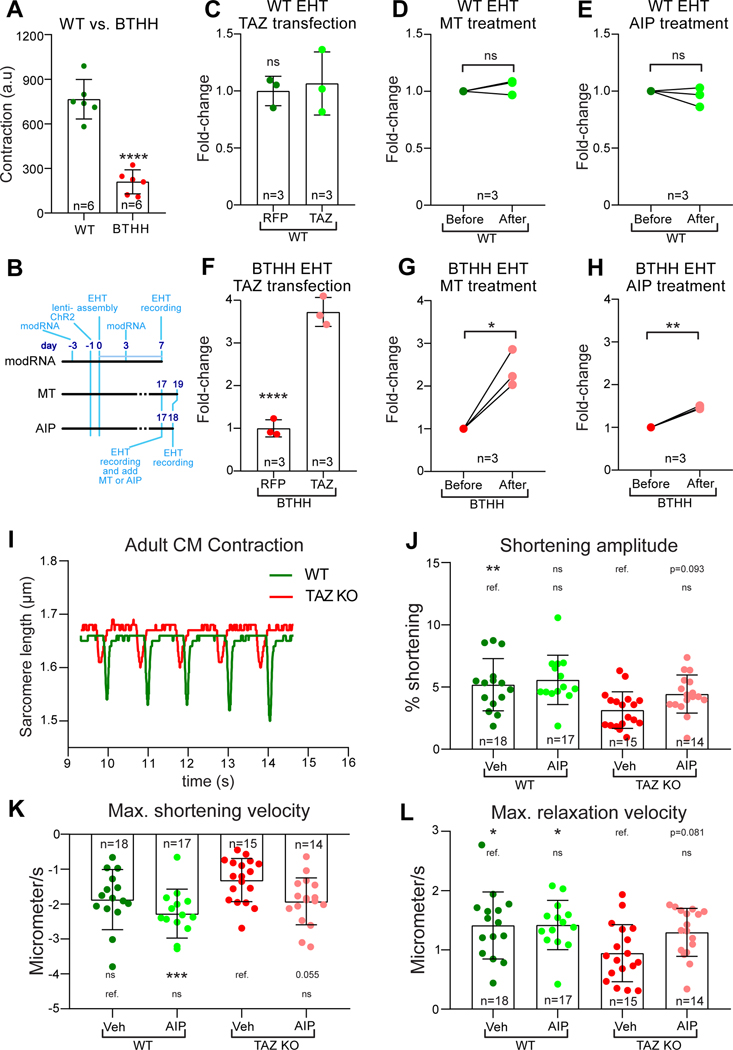
Figure 8. Inhibition of ROS-CaMKII-RYR2 pathway restored contractile function of TAZ mutant cardiomyocytes.
A. Reduced contractile function of BTHH EHTs compared to controls. BTHH or control iPSC-CMs were assembled into EHTs. Contractile function was measured at 14 days after EHTs started contracting using MuscleMotion. a.u., arbitrary units. Two-tailed t-test. B-H. Effect of TAZ modRNA, MT, or AIP on control or BTHH EHT contractile function. B, experimental timelines. TAZ or RFP modRNA iPSC-CMs were assembled into EHTs. EHTs were treated again with TAZ or RFP modRNA on day 3. EHTs were assayed on day 7. Two-tailed t-test. For MT or AIP experiments, EHTs were assayed on day 17 prior to treatment. EHTs were then treated with AIP or MT for 1 or 2 days, respectively, and then assayed again. Relative contractile function is expressed as fold-change compared to pre-treatment values. Paired t-test. C, F. TAZ modRNA treatment of WT or BTHH EHTs. D,G. MT treatment of WT or BTHH EHTs. E,H. AIP treatment of WT or BTHH EHTs. I-L. Effect of TAZ mutation and CaMKII inhibition on AMVM contractile function. CMs were isolated from 2-month-old Taz KO (Myh6Cre+; Tazfl/Y) or control hearts. Contractile function of individual myocytes was measured by video measurement of sarcomere length. I, representative traces of WT and Taz KO sarcomere length during 1 Hz pacing. J, Fractional shortening of Taz KO and control cardiomyocytes treated for 2 hours with vehicle or AIP. K-L, maximal velocity of shortening or relaxation of WT and Taz KO cardiomyocytes. Maximal shortening velocity did not fit a normal distribution and was analyzed with Kruskal-Wallis with Dunn’s multiple comparison test, whereas the remaining parameters were analyzed by ANOVA with Dunnett’s multiple comparison test. Comparisons were to either mock-treated BTHH or mock-treated WT, as indicated by the labelled reference (ref.) group in each row. * P<0.05, ** P<0.01, *** P<0.001, **** P<0.0001. ns, not significant.

