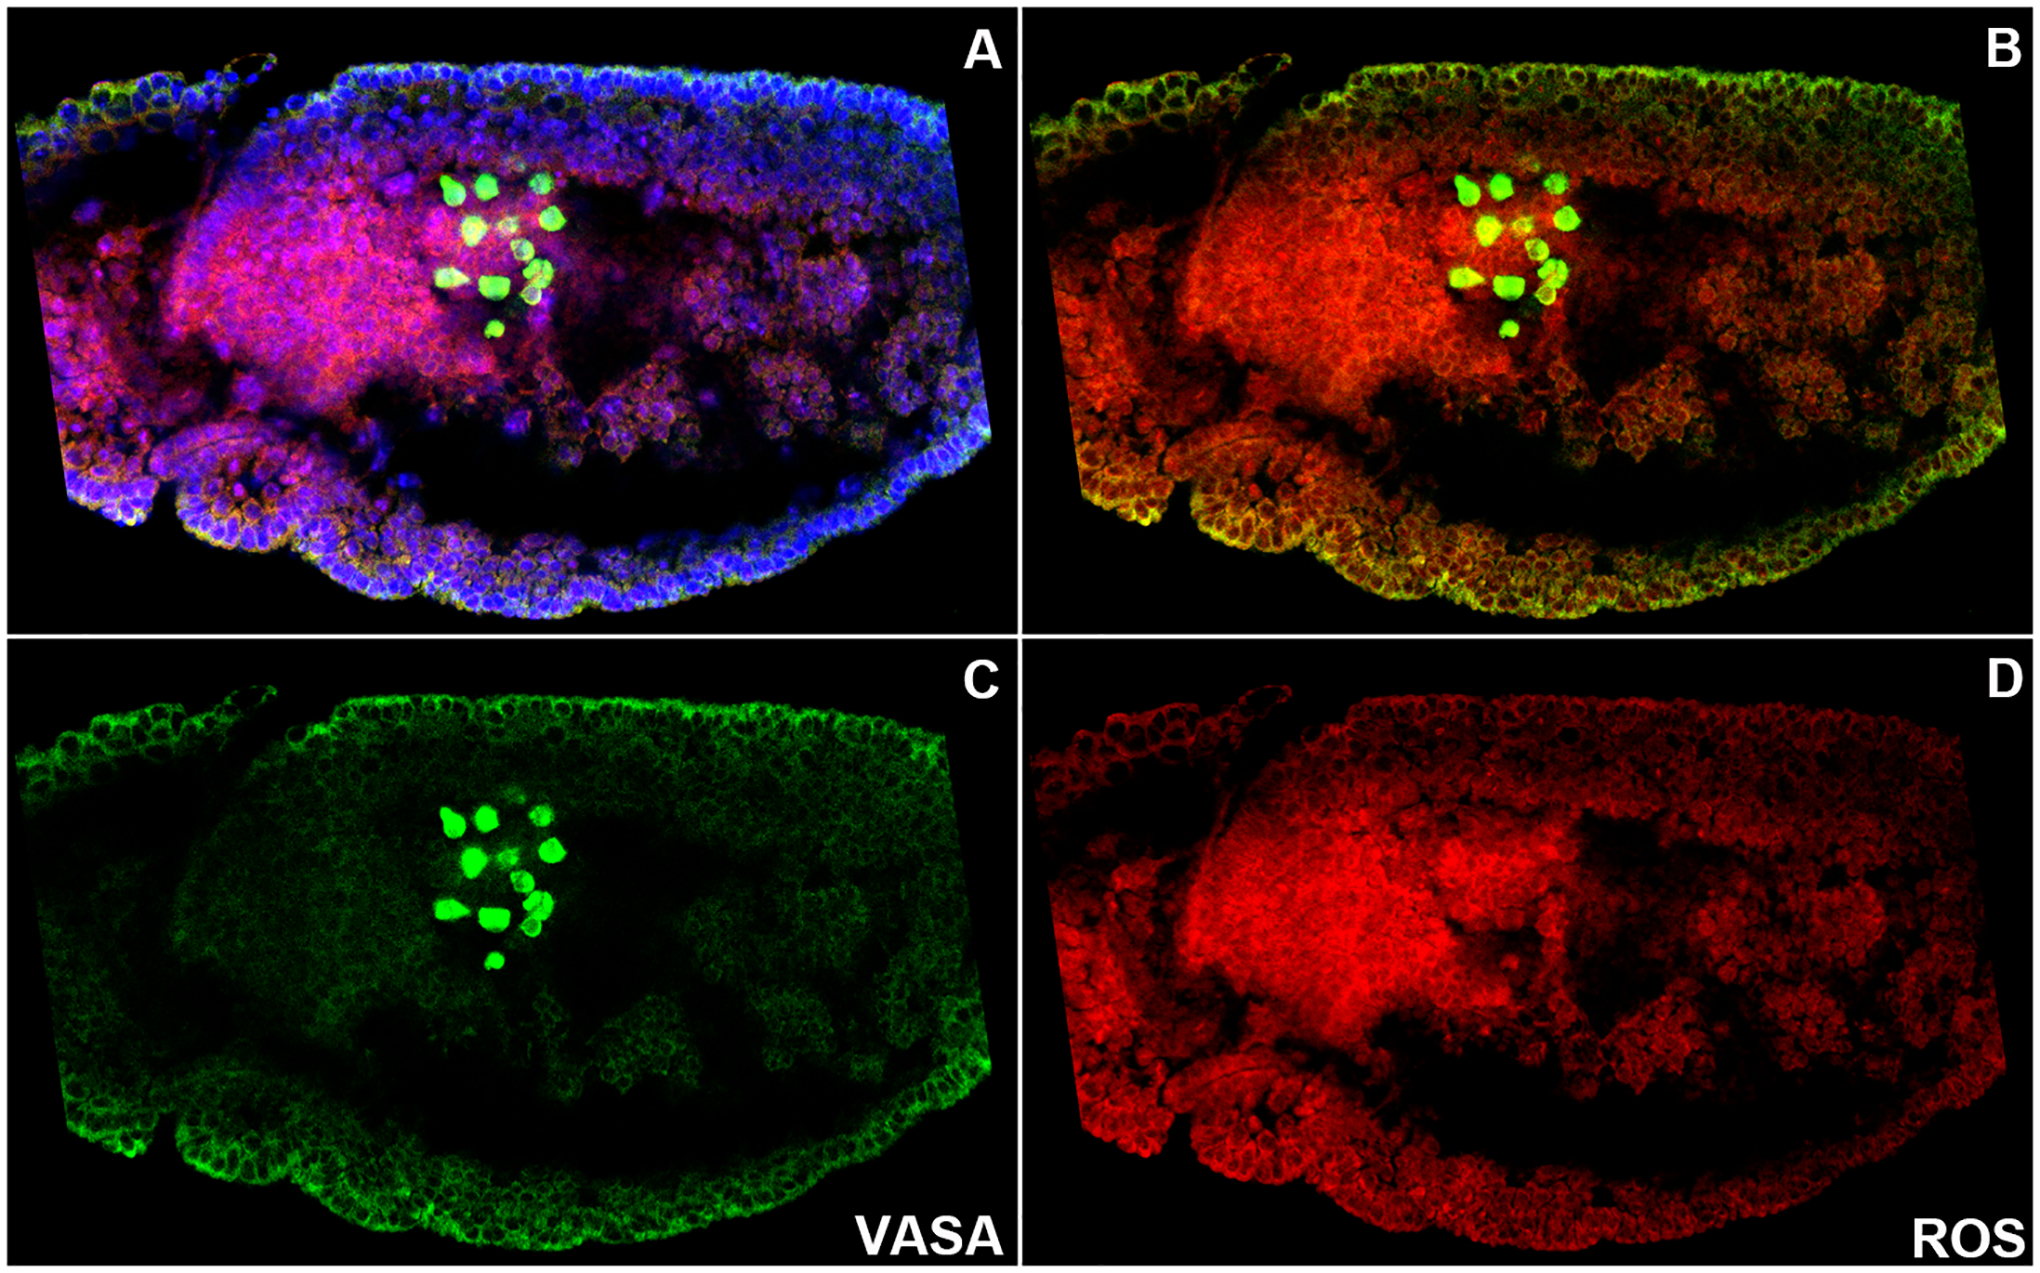
FIGURE 2. ROS accumulation increases in PGCs and surrounding somatic cells during later stage development.

WT embryos (0–12 hour old) were stained with anti-Vasa antibody (green), DNA marker Hoechst (blue), and ROS detector dihydroethidium DHE (red). Embryos are oriented anterior to the left and dorsal side on top in all panels.
A–D. Each panel shows the same germ-band extended WT embryo at stage 9. A: Composite panel showing all three labels. B: Composite showing Vasa and ROS. C: Vasa stained PGCs (Green). D: ROS levels are accumulated in a spatiotemporally restricted manner (Red). As PGCs exit the midgut primordium, ROS levels seem to be elevated compared to the earlier stages. ROS levels are maintained in the PGCs and the surrounding midgut primordial cells show high levels of ROS accumulation (D).
