Abstract
The liver connects the intestinal portal vasculature with the general circulation, employing diverse immune cells to protect from gut-translocating pathogens1. In liver lobules, blood flows from portal triads (PTs) situated in peri-portal (PP) lobular regions to the central vein (CV) via a polarized sinusoidal network. Despite this asymmetry, liver resident immune cells are considered to be broadly dispersed across the lobule. This differs from lymphoid organs, in which immune cells adopt spatially biased positions to promote effective host defense2,3. Here we employed quantitative multiplex imaging, genetic perturbations, transcriptomics, infection-based assays, and mathematical modeling to reassess the relationship between liver immune cell localization and host protection. We found that myeloid and lymphoid resident immune cells concentrate around PP-regions. This asymmetric localization is not developmentally controlled, but results from sustained commensal-induced MyD88-dependent signaling in liver sinusoidal endothelial cells (LSECs), which in turn regulates the composition of the peri-cellular matrix involved in chemokine gradient formation. In vivo experiments and modeling showed that this immune spatial polarization was more efficient than a uniform distribution in protecting against systemic bacterial dissemination. Together, these data reveal that LSECs act as a microbiome sensor, actively orchestrating immune cell localization resulting in optimal host defense.
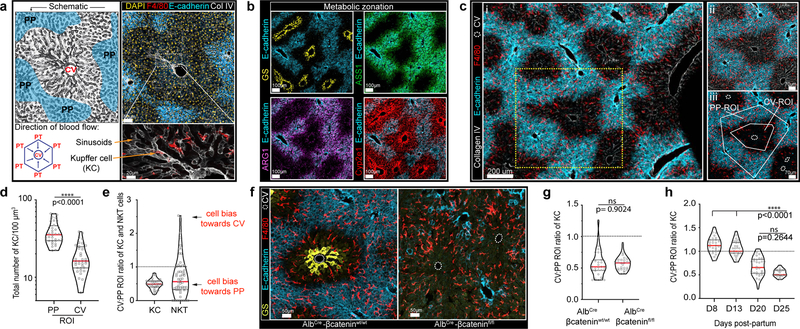
The liver consists of hexagonal units called lobules (Fig. 1a), with PP lobular regions histologically demarcated by E-cadherin4. Due to unidirectional blood flow, gradients of oxygen, nutrients, and hormones exist along the porto-central axis. Efficient metabolism is promoted by topographic distributions of key enzymes such as glutamine synthetase (GS) (Fig. 1b)5. This well-defined metabolic zonation stands in marked contrast to our current understanding of the liver immune system. Prior studies found that resident phagocytes, Kupffer cells (KCs), are enriched near PP-regions6, with those closest to PTs having distinct phenotypic properties7,8. However, the distribution of diverse resident immune cells types, the cellular and molecular mechanisms that direct the spatial organization of the liver immune system, and the functional consequences of asymmetric immune cell localization remain key unanswered questions in the field.
Figure 1. KCs become enriched around liver peri-portal areas during weaning.
(a) Representative schematic (left) and immunofluorescent (IF) image (right) of mouse liver lobule showing E-cadherin enrichment in PP regions (blue), F4/80+ KCs, Collagen (Col) IV lining LSECs and location of PTs and CV. Bottom left, direction of portal blood flow towards the CV. (b) Liver lobule metabolic zonation depicting enzymes GS, ARG1, ASS1 and Cyp2e1. (c, i) Representative IF image showing KC distribution within liver, (ii) inset, (iii) quantification method: regions of interest (ROIs) for PP and CV lobular areas, total number of segmented KCs is quantified. (d) Total number of KCs in PP and CV regions normalized to volume (dots: ROIs, n= 4 mice). (e) Ratio of total KC and NKT cell numbers in PP and CV ROIs (dots: lobules, n= 4 mice). (f) Representative IF image of AlbCre-βcateninfl/fl animals and littermate controls showing loss of metabolic (GS) zonation and (g) quantification of ratio of KC numbers in CV to PP ROIs (dots: lobules, n= 3 mice/condition). (h) Ratio of total KCs numbers in CV to PP ROIs at days (D) 3, 8, 13, 20, and 25 post-partum (dots: lobules, n= 5 mice/time point). For all: data pooled from 2-independent experiments; Median± quartiles, (d, g) Two-tailed Mann-Whitney, (i) Kruskal-Wallis with Dunn’s multiple comparison (MC). Channel colours and CV as labelled.
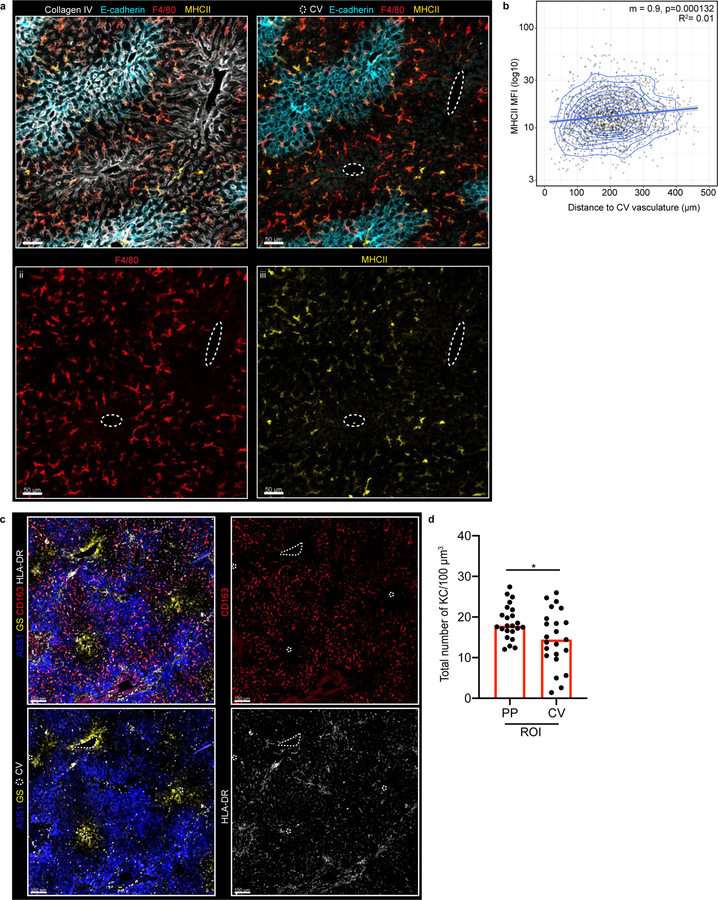
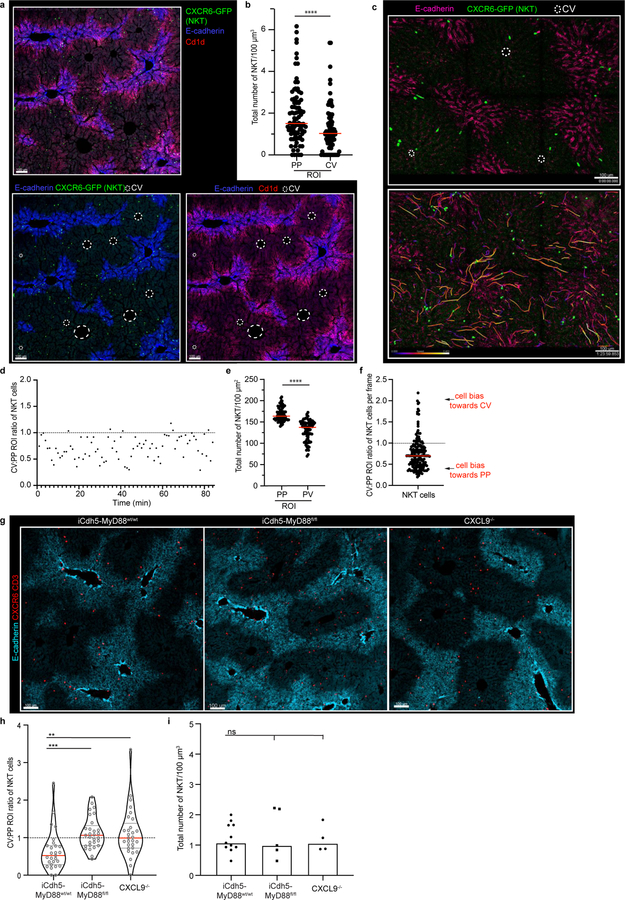
To address these issues, we utilized multiparameter confocal imaging, built around Histo-cytometry9. We confirmed that KCs were enriched in PP-regions and developed quantitative data detailing this patterning (Fig. 1c–e), with MHCIIhi or MHCIIint KCs showing a similar distance to the CV (Extended Figure 1a–b). This positional asymmetry was not unique to mice: KCs were also enriched in the PP-regions of human livers10 (Extended Figure 1c–d). We next examined NKT-cells using static and intravital two-photon microscopy11, finding that these cells also concentrate around PP CD1d-high areas (Fig. 1e, Extended Figure 2a–f, Video 1). To visualize KCs and NKTs in a larger organ volume we extended our analysis by employing Clearing enhanced 3D (Ce3D) imaging. We again saw that KC and NKT-cells exhibited PP-enrichment (Video 2), confirming results from thin sections. Together, these data reveal that the liver lobule harbors a spatially polarized immune system (“immunological zonation”).
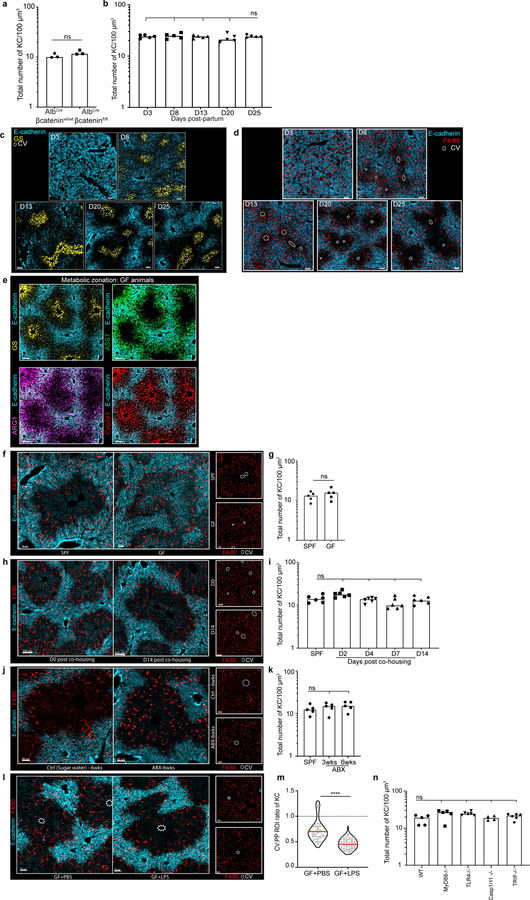
We next sought to understand the mechanism(s) responsible for this immunological zonation. Wnt/β-catenin plays a central role in liver metabolic patterning12,13. To examine if this pathway also controlled immune cell organization, we disrupted Wnt/β-catenin signaling in hepatocytes by crossing albumin-Cre (Alb-Cre) animals with β-cateninfl/fl animals. As expected, offspring lacked GS around the CV (Fig. 1f, g). In contrast, KC positioning within the liver lobule remained unaltered (Figure 1g, Extended Figure 3a). To further assess the possible relationship between metabolic and immune zonation, we carried out a developmental analysis. Metabolic zonation occurs in mice at around day (D) 5–7 post-birth14 (Extended Figure 3b–d). KC PP localization did not coincide with metabolic zonation, but only became evident around D20–25 at time of weaning, with no alteration in total KC number (Fig. 1h, Extended Figure 3b–d). These data further indicate a clear distinction between factors controlling metabolic zonation and immune zonation.
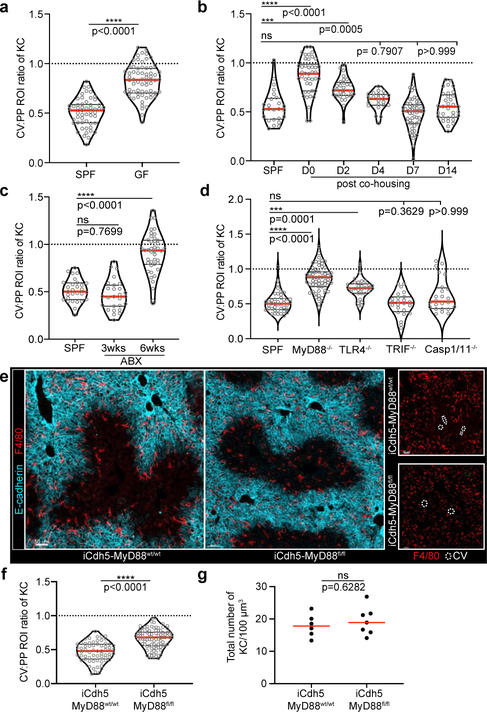
The introduction of solid food during weaning leads to changes in the gut microbiota15, accompanied by immunological alterations16. We speculated that commensal bacteria might influence liver immunological zonation and therefore compared the localization of KCs in specific pathogen-free (SPF) vs. germ-free (GF) mice. While GF liver lobules exhibited normal metabolic zonation, and had similar numbers of KCs as SPF controls (Extended Figure 3e–g), GF animals lacked the PP KC polarization seen in adult SPF mice (Fig. 2a, Extended Figure 3e–g). To examine whether immunological zonation is imprinted during weaning or requires sustained microbial sensing, GF animals were co-housed with SPF mice. This resulted in development of the asymmetric positioning of KCs typical of SPF animals (Fig. 2b, Extended Figure 3h–i). Conversely, treatment of adult SPF mice with antibiotics resulted in loss of the usual PP KC enrichment (Fig. 2c, Extended Figure 3j–k). Thus, immunological zonation is a dynamic process and dependent on gut-microbiota.
Figure 2. Germ-free animals lack KC peri-portal concentration.
Ratio of total KC numbers in CV to PP ROIs (IF images: Extended Fig. 4), dots represent lobules of (a) SPF or GF animals, n= 5 mice/condition; (b) GF animals post co-housing with SPF animals, n= 6 mice/condition; (c) post-antibiotic (ABX) treatment, n= 6 mice/condition, and (d) global MyD88, TLR4, TRIF, Caspase1/11 knock-out animals, n = 4 Caspase1/11−/− mice, n= 5 MyD88−/− and WT mice, n= 6 TLR4−/− and TRIF−/− mice. (e) Representative IF image showing KC distribution of iCdh5-MyD88fl/fl and iCdh5-MyD88wt/wt. (f) Ratio of total KC numbers in CV to PP ROIs (dots: lobules), and (g) total numbers of KCs per volume in iCdh5-MyD88wt/wt and iCdh5-MyD88fl/fl animals (dots: biological replicates); n= 6 iCdh5-MyD88wt/wt mice, 7 iCdh5-MyD88fl/fl mice. For all: data pooled from 2–3 independent experiments; Median± quartiles, (a, f-g) Two-tailed Mann-Whitney, (b-d) Kruskal-Wallis with Dunn’s MC. Channel colours and CV as labelled.
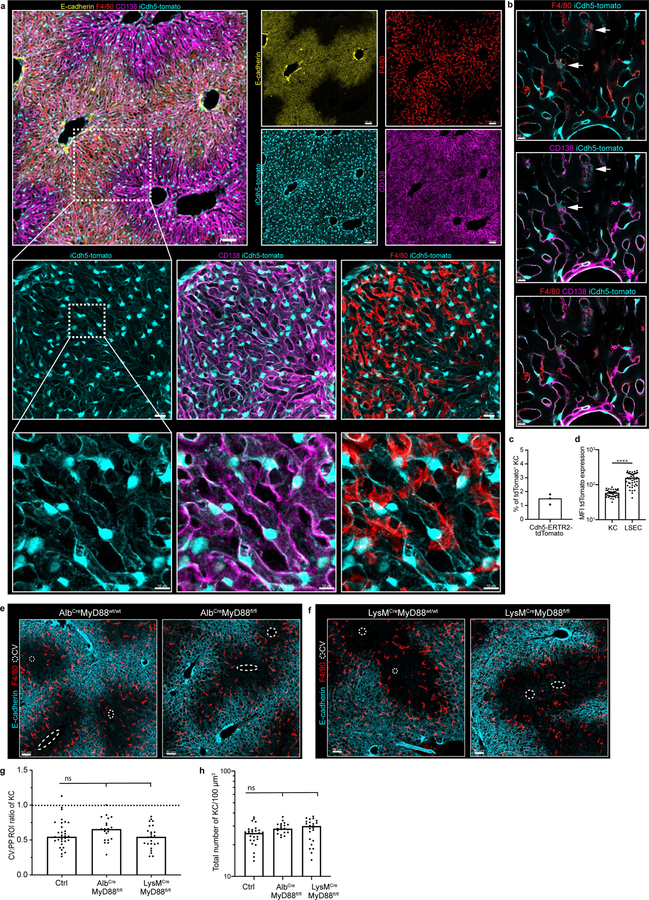
Portal venous blood is rich in gut-derived microbial products such as lipopolysaccharide (LPS)1,17. To directly examine the hypothesis that sustained sensing of commensal-derived products was responsible for immune zonation, we orally administered LPS to GF mice. This induced PP-enrichment of KCs to levels approaching that of SPF mice (Extended Figure 3l–m). Since sensing of microbial products is generally mediated by pattern recognition receptors (PRRs), we assessed KC positioning in animals lacking key PRRs or downstream adaptor proteins. Immunological zonation was lost in MyD88−/− but not in Caspase 1/11−/− or TRIF−/− animals (Fig. 2d, Extended Figure 3n), and was partially lost in TLR4−/− mice. To identify the liver cells responding to microbial stimulation, we eliminated MyD88 expression in specific cell types using iCdh5-Cre for LSECs (Extended Figure 4c–d)18,19, LysM-Cre for KCs, and Alb-Cre for hepatocytes. MyD88 signaling in hepatocytes or KCs was not required for immunological zonation (Extended Figure 4e–h). However, loss of MyD88 in LSECs disrupted PP-polarization of KCs and NKT-cells (Fig. 2e–g, Extended Figure 2g–i). These results demonstrate that LSECs sense microbial products and subsequently coordinate liver lobule immunological zonation.
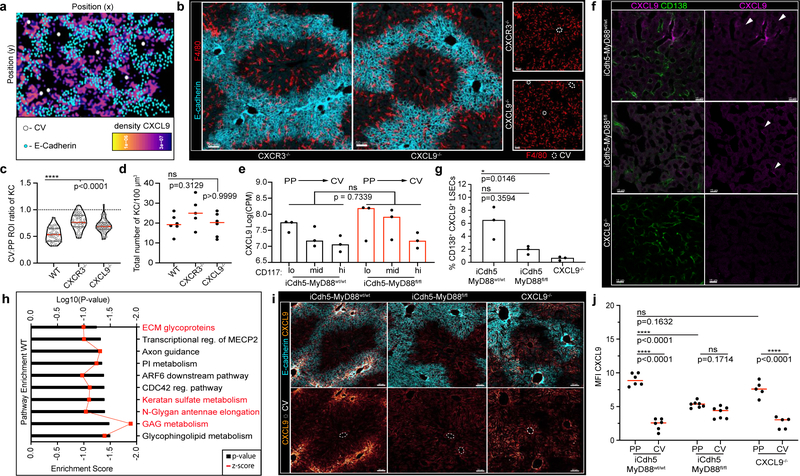
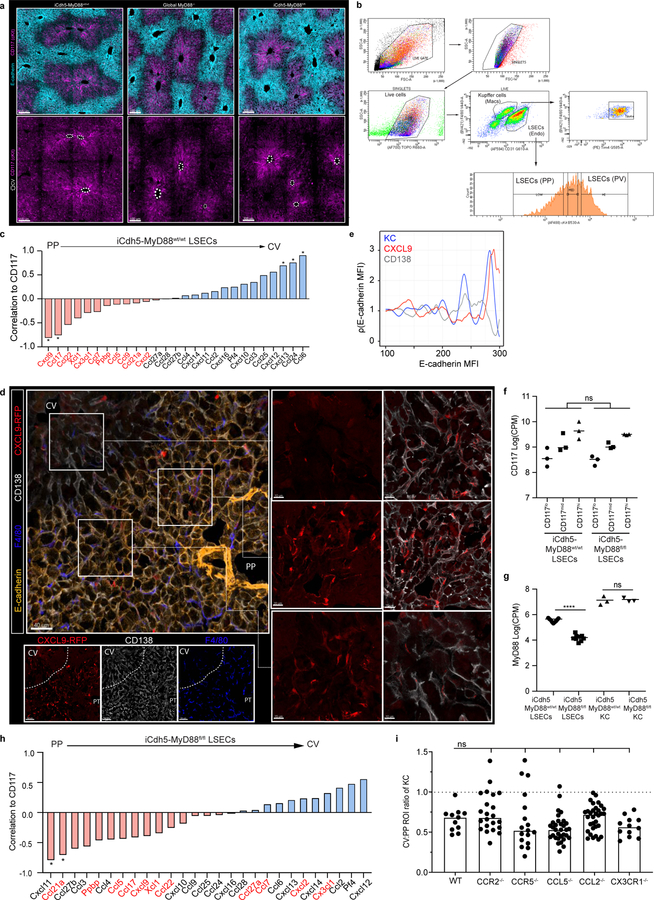
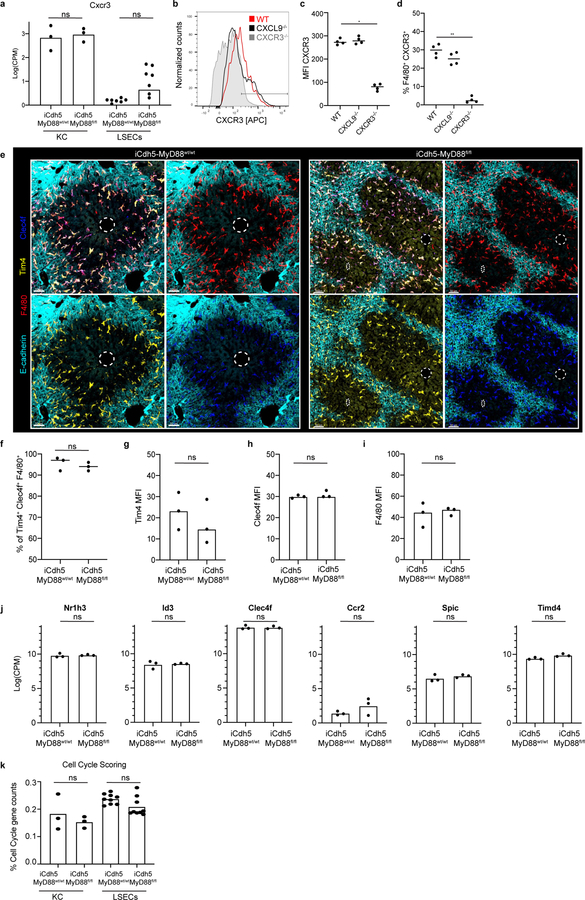
To probe the mechanism(s) by which LSECs regulate immune cell positioning, we assessed the transcriptional state of KCs and LSECs extracted from livers of iCdh5-MyD88wt/wt animals using RNA-sequencing (RNAseq). Anticipating a polarized distribution of chemokines (key molecules in immune cell localization20), we sorted LSECs based on CD117 expression to infer their intra-lobule location21 (Extended Figure 5a–b). Using gene correlation to CD117 as a ranking mechanism, we found that many chemokines exhibited gradients of expression across the lobule axis (Extended Figure 5c). CXCL9 had the strongest mRNA PP-enrichment (Extended Figure 5c)21, and KCs and NKT-cells express the cognate receptor CXCR322,23 (Extended Figure 6a–d). Consistent with our sequencing data, CXCL9 reporter animals (REX3)24 showed CXCL9-RFP signal enriched in LSECs closest to the PP-regions of the lobule (Fig. 3a; Extended Figure 5d–e). The role of CXCL9/CXCR3 in liver immune cell localization was then assessed, with both ligand and receptor knock-outs showing decreased PP-enrichment of KCs (Fig. 3b–d) and NKT-cells (Extended Figure 2g–i). These data show that CXCL9 plays a role in shaping liver resident immune cell positioning.
Figure 3. Loss of LSECs MyD88 signalling results in KC spatial disruption.
(a) Representative probability density plot of CXCL9 in REX3 animals, CXCL9 depicted by heat map (IF images: Extended Fig. 6). (b) Representative IF image showing KC distribution of CXCR3−/− and CXCL9−/− animals. (c) Ratio of total KC numbers in CV to PP ROIs of CXCR3−/− and CXCL9−/− animals (dots: lobules), and (d) total numbers of KCs per volume (dots: biological replicates); n= 5 WT, CXCR3−/− mice, 6 CXCL9−/− mice. (e) Log counts per million of CXCL9 in LSECs of iCdh5-MyD88wt/wt and iCdh5-MyD88fl/fl (dots: biological replicates, n= 3 mice/condition); glmLTR by edge-R. (f) Representative IF image of CXCL9 Opal staining in iCdh5-MyD88wt/wt, iCdh5-MyD88fl/fl, and CXCL9−/− animals; single-slice images. (g) Frequency of CD138+ CXCL9+ LSECs (equal image volumes analysed, dots= biological replicates, n= 3 animals/condition). (h) Enrichment score (black bars) and log10 adjusted p-value (red line) for top 10 GSEAs PP pathways in iCdh5-MyD88wt/wt LSECs dysregulated in iCdh5-MyD88fl/fl animals (Details: Extended Fig. 8). (i) Representative IF images showing CXCL9 distribution and intensity in iCdh5-MyD88wt/wt, iCdh5-MyD88fl/fl and CXCL9−/− animals following intra-portal CXCL9 injection, and (j) quantification of CXCL9 MFI in respective PP and CV ROIs (dots: ROIs, n= 3 mice/condition). For all: data pooled from 2–3 independent experiments, Median± quartiles, (c, d, g) Kruskal-Wallis with Dunn’s MC. (j) Two-Way ANOVA with Sidak’s MC. Channel colours and CV as labelled.
To test for a direct link between MyD88-dependent signaling by LSECs and control of KC localization by chemokines such as CXCL9, we repeated the RNAseq analysis using iCdh5-MyD88fl/fl mice. KCs sorted based on F4/80+ Tim4+ expression (markers validated by confocal imaging (Extended Figure 6e–i)) provided evidence that key KC and cell-cycle genes25, were not differentially expressed between iCdh5-MyD88wt/wt and iCdh5-MyD88fl/fl mice (Extended Figure 6j–k), indicating that spatial positioning and not KC phenotypic state, was the major effect of altered LSEC signaling. Surprisingly the majority of chemokine transcript gradients, including that of CXCL9, were largely maintained in iCdh5-MyD88fl/fl mice (Fig. 3e, Extended Figure 5f–h). Eliminating expression of each of the few chemokine and chemokine receptors that did change did not reveal any effect on KC distribution (Extended Figure 5i). In sharp contrast, immunostaining of endogenous CXCL9 protein in livers of iCdh5-MyD88fl/fl mice was significantly reduced when compared to iCdh5-MyD88wt/wt livers (Fig. 3f–g).
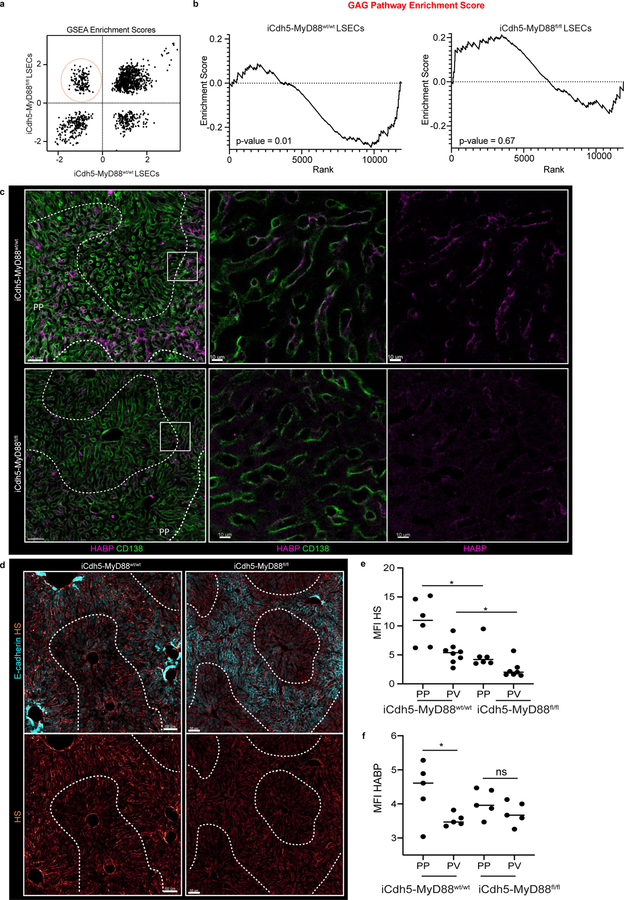
In seeking to understand this difference between mRNA and protein datasets, a Gene-Set Enrichment Analysis (GSEA) was performed on LSECs samples. We focused our attention on gene sets that were highly enriched around the PP-regions (i.e., negatively correlated with CD117) in iCdh5-MyD88wt/wt mice, but that had lost enrichment in iCdh5-MyD88fl/fl animals (Extended Figure 7a). The top GSEA-enriched pathways in this comparison included many processes involved in glycosaminoglycan (GAG) metabolism and extracellular matrix (ECM) composition (Fig. 3h, Extended Figure 7b). Altered glycocalyx composition in iCdh5-MyD88fl/fl animals was confirmed by staining for heparan sulfate (HS) and hyaluronic acid (HA) (Extended Figure 7c–f). Cationic chemokines (such as CXCL9) bind components of the glycocalyx such as GAGs26,27 to create spatial gradients20. Thus, changes in ECM composition of iCdh5-MyD88fl/fl LSECs might affect formation of immobilized chemokine(s) gradients whose genes were still transcribed. To test this hypothesis, we injected CXCL9 into the portal vein and subsequently performed immuno-histochemistry on liver samples. While WT or CXCL9−/− mice exhibited preferential CXCL9 retention in PP-regions, iCdh5-MyD88fl/fl animals showed dramatically decreased retention and a diminished PP-directed gradient of the injected chemokine (Fig. 3i–j). These data indicate that chemokine retention, and consequently the functional chemoattractant gradient, is altered in animals lacking LSEC MyD88-signaling.
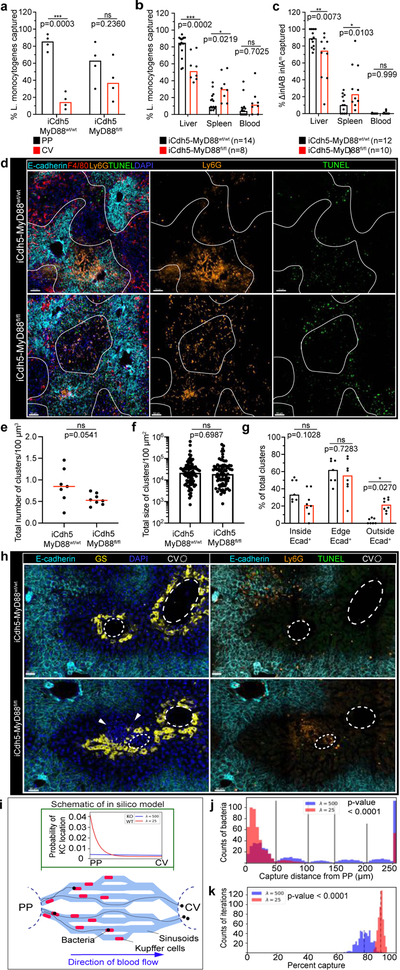
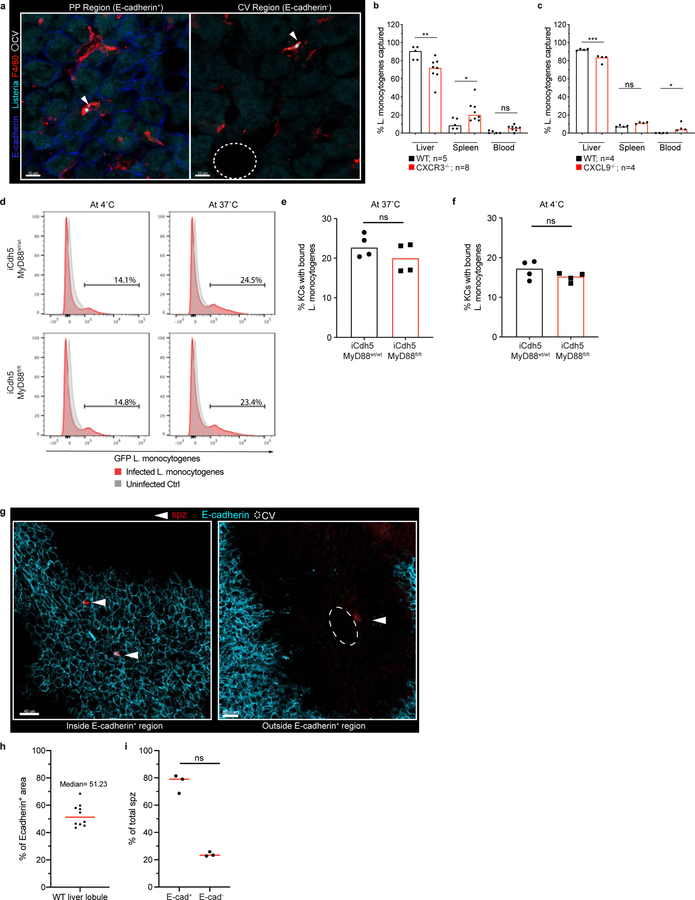
What is the functional value of liver immunological zonation? Altered KC PP-positioning could result in bacteria reaching the CV and then exiting into the general circulation. Using L. monocytogenes as a model pathogen, we investigated the positioning of Listeria capture after portal vein inoculation in iCdh5-MyD88fl/fl vs. iCdh5-MyD88wt/wt animals. When compared to WT controls, the frequency of bacteria reaching the CV regions was increased in iCdh5-MyD88fl/fl mice (Fig. 4a, Extended Figure 8a). Further, iCdh5-MyD88fl/fl, CXCR3−/− or CXCL9−/− animals demonstrated decreased capture of bacteria in livers, and concomitantly, increased bacterial burdens in spleen and peripheral blood (Fig. 4b, Extended Figure 8b–c). We also challenged animals with an internalin mutant of Listeria (ΔintAB inlAm) that undergoes gut-epithelial translocation. Similar to the portal challenge model, the frequency of bacteria captured in iCdh5-MyD88fl/fl livers was lower than in control animals, with an increased splenic burden (Fig. 4c). These data indicate that KC PP-positioning plays a critical role in protecting the host from bacterial dissemination and sepsis.
Figure 4. KC localization plays a critical role in preventing pathogen dissemination.
(a) Percent of Listeria captured around PP (E-cadherin+) and CV (E-cadherin-) regions in iCdh5-MyD88wt/wt and iCdh5-MyD88fl/fl animals 2-hours post i.v. injection, n= 4 animals/group. (b-c) Percent of Listeria captured after (b) PP injection, or (c) oral gavage, in liver, spleen and blood from iCdh5-MyD88wt/wt and iCdh5-MyD88fl/fl animals; n shown in figure. (d-g) iCdh5-MyD88wt/wt and iCdh5-MyD88fl/fl animals D1 post i.v. injection of Listeria. (d) Representative IF image of showing TUNEL+ and Ly6G infectious clusters. Quantification of (e) total number of clusters per volume, (f) total size (dots: clusters), and (g) percent location of total clusters; n= 7 animas/group. (h) Representative IF image of iCdh5-MyD88wt/wt and iCdh5-MyD88fl/fl liver showing infectious clusters around CV. (i) Schematic of in silico bacteria capture model: sinusoidal network from PP to CV, with KCs (red) and bacterial-tracks (black line), and final position of each bacteria (black dot). Green window: schematic of exponential distributions used to sample KC locations along sinusoids, λ=25 (red- WT) and λ=500 (blue- KO). (j) Distributions of the captured bacterial distance from PP using λ=500 or λ=25 for KC locations. Last bin of histogram: number of bacteria that are not captured. Two-tailed t-test (excluding last bin). (k) Distributions of the average percent capture of bacteria by KCs from sampled locations from exponential distributions λ=500, or λ=25. Mean- black dashed line; Two-tailed t-test. Experimental data: pooled from 2–4 independent experiments; Median shown, (a-c, e, g) dots represent biological replicates. (a-c, g) Two-Way ANOVA with Sidak’s MC, (e-f) Two-tailed Mann-Whitney. Channel colours and CV as labelled.
Following bacterial infections, recruited neutrophils form swarms at sites of cell death that can lead to increased tissue disruption28. We speculated that KC zonation might localize infiltrating neutrophils to the PP-regions of the lobule, limiting damage to cells residing around the CV21, such as GS+ hepatocytes and Wnt producing LSECs (both important for liver function and metabolic zonation). We therefore imaged iCdh5-MyD88wt/wt and iCdh5-MyD88fl/fl livers one day after L. monocytogenes challenge, assessing the location of infectious clusters composed of Ly6G+ recruited neutrophils and apoptotic (TUNEL+) cells (Fig. 4d–g). Only iCdh5-MyD88fl/fl mice harbored infectious clusters around both the PP-regions and near the CV. Although rare (approximately 5% of all L. monocytogenes infectious clusters and only in iCdh5-MyD88fl/fl livers), we could see death of GS+ hepatocytes and local tissue disruption around the CV in the mutant animals (Fig. 4h). These data reveal that disrupted KC positioning results in bacterial spread and inflammatory damage across multiple regions of the liver lobule, resulting in damage to peri-central cells.
Based on the concentration of KCs in the PP-region and the results of the bacterial challenge experiments, local KC density appears to be a critical parameter in efficiently handling bacteria. However, we could not exclude that altering KC localization reduced their capacity for pathogen capture on a per-cell basis. As there is no established method to change KC localization while not potentially affecting KC biology, we took in vitro and in silico approaches to investigate whether positioning alone could explain our findings. Despite being misplaced within the lobular structure, KC capacity to capture and/or internalize Listeria bacilli in vitro was similar for cells isolated from iCdh5-MyD88fl/fl and WT animals (Extended Figure 8d–f). We also designed a mathematical model that permitted us to quantitatively investigate the impact of spatial localization of KCs on their ability to capture incoming pathogens (Fig. 4e, Extended Figure 9). We simulated varying density distributions of KCs in the capillary network (λ) and bacterial trajectories, while keeping the bacterial binding probability of each individual KC constant. When the PP-density of KCs was high (λ=25 μm), bacterial capture occurred towards the PP-regions of the lobule (Fig. 4f) and the network’s capturing capacity was higher, preventing bacterial arrival at the CV (Fig. 4g). These data parallel our observations in vivo and, together with our in vitro experiments, supports the notion that KC spatial distribution is a critical factor in preventing overt liver lobule tissue damage.
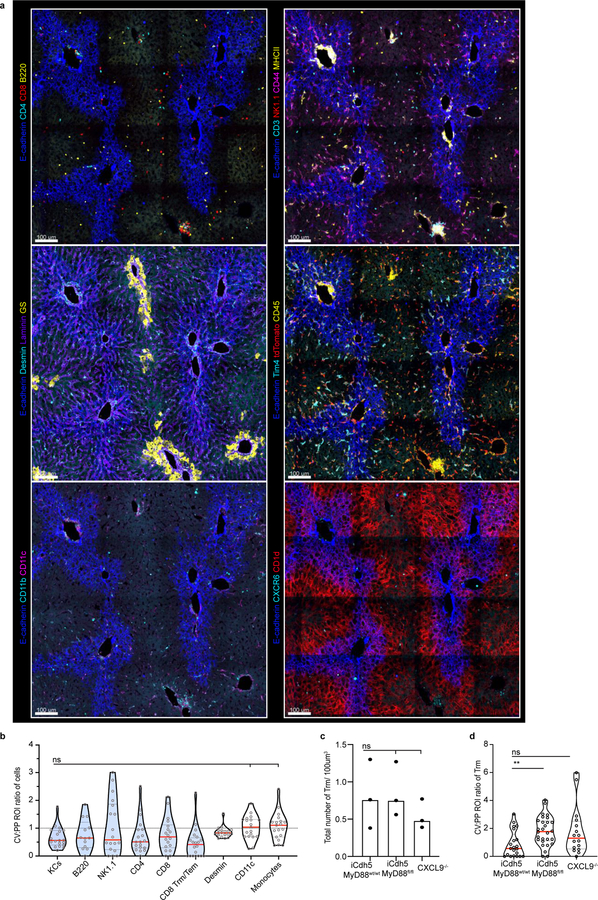
Lastly, we investigated if immune zonation was relevant for protection against other infectious agents by assessing the distribution of malarial sporozoites and of malaria-protective tissue-resident memory (Trm) CD8+ T-cells. Following i.v. administration, we found sporozoites to predominantly infect hepatocytes around E-cadherin+ PP-regions (Extended Figure 8g–h). Importantly, Trm (previously shown to be CXCR3+)29,30 were also enriched in the PP-region (Extended Figure 10a–b, Video 3), and spatially dislocated in iCdh5-MyD88fl/fl and CXCL9−/− animals (Extended Figure 10c–d). Together, these data highlight the strategic prepositioning of innate and adaptive immune cells at sites of entry for liver pathogens.
Our quantitative multiplex imaging revealed that liver myeloid and lymphoid cells are enriched towards the PP-regions of the lobule. This asymmetric immune organization requires sustained LSEC MyD88-signaling, a process triggered at weaning. LSECs operated to establish immune zonation largely by controlling the glycocalyx composition, rather than production of chemokines, to establish tissue chemoattractant gradients such as CXCL9. Beyond this direct role in chemokine gradient formation, changes in the peri-cellular matrix may also result in altered cell adhesion, coagulation, and/or blood flow. Functionally, immune zonation within the liver lobule results in preferentially localized pro-inflammatory responses in PP-areas, which may help protect unique populations of cells around the CV21. Together, these findings reveal how the microbiome establishes liver immune zonation, forming an effective, spatially-organized protective barrier against incoming blood-borne threats while protecting organ functionality.
Methods
Mice.
C57BL/6, Albumin-Cre, LysM-Cre, β-cateninfl/fl, TRIF−/−, MyD88−/−, TLR4−/−, MyD88fl/fl, TLR4fl/fl, CXCR3−/−, CXCL9−/−, B6.Cg-Gt(ROSA)26Sortm14(CAG-tdTomato)Hze/J, CCR2−/−, CCR5−/−, CCL5−/−, CCL2−/−, CX3CR1−/−, and CXCR6-GFP were purchased from Jackson Laboratories. Caspase1/11−/− mice were purchased from Taconic. REX331 and iCdh5-Cre mice32 were provided by Andrew Luster and Ralf H. Adams respectively. Unless specified, mice used in the study were 4–8 week-old females or males (no sex difference was observed). Mice were allocated to groups at random (although no specific randomization was performed), and appropriate sample sizes were chosen from prior experiments and/or by assessing the known literature; no blinding was performed. All mice were maintained in SPF conditions at an Association for Assessment and Accreditation of Laboratory Animal Care-accredited animal facility at the NIAID and were used under study protocol LISB-4E approved by NIAID Animal Care and Use Committee (NIH). iCdh5-Cre MyD88fl/fl and iCdh5-Cre MyD88wt/wt mice (4–6 weeks of age) were injected i.p. with tamoxifen (75 mg tamoxifen/kg in corn oil, both from Sigma-Aldrich) on each of three consecutive days and tissue was harvested two-weeks post injection. We carefully assessed expression of iCdh5-Cre on the LSEC population by crossing iCdh5-Cre animals to a Rosa26-tdTomato mouse reporter line. iCdh5-tdTomato mice showed reporter signal in only 1.5% of KCs in accord with a previous publication (Extended Figure 5)26, indicating that in our hands iCdh5-Cre resulted in functionally specific LSECs targeting. GF mice were maintained in sterile plastic isolator units and fed autoclaved LabDiet5021 mouse chow (LabDiet) and autoclaved water.
Immunofluorescence staining and confocal imaging.
Livers were perfused in 2% PFA solution via the portal vasculature, then incubated in a 0.5% Fix-Perm solution (BD Bioscience, 554722) overnight followed by dehydration in 30% sucrose before embedding in OCT compound (Sakura Finetek). 20-μm sections were cut on a CM3050S cryostat (Leica) and adhered to Superfrost Plus slides (VWR). Frozen sections were blocked in PBS and 0.1% Fc-block (CD16/CD32 Monoclonal Antibody, Thermo; 14–0161-86) followed by staining with antibodies diluted in blocking buffer. The following antibodies were used for staining (see Supplementary Table 1). After staining, slides were mounted with Fluoromount G (Southern Biotech), and examined on a Leica TCS SP8 confocal microscope (40x objective). Images were analysed with Imaris software (Bitplane, v8.4) and Fiji (ImageJ, v). TUNEL staining was performed by using the InSitu Cell Death Detection Kit, Fluorescein (Roche, 11684795910) per the manufacturer’s protocol. In naïve animals only, to assess low levels of CXCL9 chemokine produced, CXCL9 staining was performed using Opal IHC kit (Akoya Biosciences NEL811001KT) and CXCL9-Gt (R&D Systems, Cat# AF-492-NA). Briefly, exogenous peroxidase in livers was first quenched with 0.3% hydrogen peroxide solution for 30 min. Subsequently, tissues were blocked and stained with primary antibodies as previously described. Samples were then stained with Opal Polymer anti-Rabbit HRP (Akoya Biosciences ARR1001KT) secondary antibody according to the protocol, washed into TBST, then stained with the Opal 650 Polymer (Akoya Biosciences FP1496001KT) for 5 minutes. Iterative staining was performed via the IBEX method (Iterative Bleaching Extends MultipleXity), involving multiple rounds of staining, imaging, chemical bleaching, and repeating this staining, imaging, and bleaching cycle (Radtke et al., in preparation). For 3D volume imaging, cleared liver samples were prepared as previously described33. Briefly, following fixation, liver samples were placed in blocking buffer (1x BD Perm/wash solution (BD Bioscience) and 0.1% Fc-block), stained for two-days at 4 °C in blocking buffer, and cleared in Ce3D clearing solution (2 ml of 40% (vol/vol) N-methylacetamide, 4g of Histodenz, an additional 750 μl of 40% (vol/vol) N-methylacetamide, and 5 μl of Triton X-100) over-night at room temperature.
Human samples.
Excisional biopsies (1 cm3) of human liver were obtained at the time of laparotomy with informed consent under NCI protocol 13C-0176. To avoid cautery artifact and to minimize inflammatory changes related to the procedure or the biopsy itself, samples were obtained immediately upon entry into the abdomen and the excision was performed with a scalpel. Liver samples were immediately placed in a 1:4 dilution of BD Cytofix/Cytoperm in 1X PBS (BD Bioscience, 554722) overnight followed by dehydration in 30% sucrose before embedding in OCT compound (Sakura Finetek). All subsequent immunofluorescence imaging was performed as previous outlined for mouse samples, using the anti-human antibodies listed in Supplementary Table 1. In total, liver samples from 7 patients were examined.
Antibiotic treatment, co-housing and LPS-oral gavage.
Antibiotic treatment: Six-week-old C57BL/6 mice were given ampicillin (1 g/l), kanamycin (5 g/l), vancomycin (500 mg/l), neomycin trisulfate (1 g/l) and metronidazole (1 g/l) in sugar drinking water or given just sugar water for 3–6 weeks (all from Sigma-Aldrich). Co-housing: GF and SPF mice were co-housed in cages for 2-weeks. LPS-oral gavage: GF mice were orally gavaged with 0.1 mg/mouse of LPS (Lipopolysaccharides from Salmonella enterica serotype Minnesota, Sigma; L2137) or PBS every 3 days for two weeks.
Listeria monocytogenes challenges.
Mice were injected via the portal vasculature with 1×10⁴ Listeria monocytogenes bacilli (100μl volume) as previously detailed34. Briefly, animals were anesthetized (75 mg/kg Ketamine (Zetamine, Vet One) and 1 mg/kg Medetomidine (Dexmedesed; Dechra) i.p. and placed on a heated pad. Following hair removal, a transverse incision was performed and bacteria were injected via the portal vein using an Ultra-Fine Insulin Syringe Short Needle 31G (BD Syringe: 328440). Celox Rapid Hemostatic Gauze (Medtrade Products Ltd., FG08839011), cut into 3–5 mm2 pieces, was used with pressure to stop blood flow out of the portal vein. Thirty minutes following injection, spleen, liver and blood were harvested, mashed through a 100 μm filter, and plated onto blood agar plates (Thermo; R02049) for CFU counts. Alternatively, mice (previously starved overnight) were orally gavaged with 1×10⁹ Listeria monocytogenes (ΔintAB inlAm)35 in 300 μl; one day post-injection, spleen, liver and blood were harvested as previously described. For confocal imaging of Listeria infectious clusters, mice were injected i.v. with 2×10⁵ Listeria bacilli; livers were harvested for confocal imaging one day post-injection.
CXCL9 injection and staining.
Mice were injected via the portal vasculature with 50 μg of CXCL9 protein (SinuBiological, 50155-MNAE) in 100 μl, as detailed above. Thirty minutes after injection, mice were euthanized and immediately fixed by perfusion into the portal vasculature using a 2% PFA solution. Tissues were subsequently prepared for immunohistochemistry, and CXCL9 staining was performed using the standard protocol, as previously described.
Listeria monocytogenes in vitro capture assay.
KCs were extracted from liver (see bulk RNAseq) from iCdh5-MyD88wt/wt and iCdh5-MyD88fl/fl mice. Following extraction, KCs were selected by plating onto non-tissue culture (TC) treated Petri dishes at 37°C in complete media plus 7 ng/ml M-CSF (Peprotech; 315–02) for 2 hrs, allowing KCs to adhere. KCs were then mechanically dissociated and allowed to re-adhere in TC treated 6-well plates for another 2 hrs at 37°C. Subsequently, cells were washed and 5×10⁶ Listeria-GFP (MOI of 10) were added or left unmanipulated (uninfected control). Bacteria were then spun down onto KCs briefly, and uptake/binding of Listeria-GFP was allowed to take place for 1 hr at 37°C or 4°C. Cells were then lifted with TrypLE Express (10 min at 37°C; Thermo, 12604013), fixed with 4% PFA for 5 min, and subsequently washed and stained with F4/80-Pacific Blue in FACs buffer for 20 min on ice. Cells were analyzed using a BD Fortessa and FlowJo (TreeStar, v10.6.1) software.
Prime and Target and malaria sporozoite administrations.
Mice were vaccinated using a Prime and target strategy as previously described36. Briefly, mice were immunized i.m. into the musculus tibialis with a dose of 1×10⁸ infectious units (iu) of Ad5-OVA (Jenner Institute viral vector core facility, Oxford, UK). Two weeks later, 25 μg of PLGA-OVA nanoparticles were administered i.v. via the tail vein. PLGA-OVA nanoparticles were made in house at Jenner Institute as previously described36. Three weeks following vaccination, livers were harvested for confocal microscopy and IBEX staining was performed. For sporozoite (spz) visualization, spz were isolated by dissecting out the salivary glands of P. berghei infected A. stephensi mosquitoes around day 21 post-feed. Salivary glands were homogenized, spz counted, and naïve mice were administered 50,000 spz/mouse i.v. via the tail vein. Livers were then harvested one day post-injection and prepared for confocal imaging. Due to the sparse nature of spz in infected mouse livers (parasites do not replicate until blood stage malaria is reached), spz were imaged by systematically scanning across all liver sections using the microscope ocular piece and only the field of view in which they were present was acquired. As this data-set has limited lobular morphology, an accurate quantification using PV and CV ROI’s could not be performed. However, when quantifying the % of E-cadherin+ regions across 10 different wild-type mouse liver lobules (Extended Figure 8h), the E-cadherin+ PP regions was found to be around 51% across multiple animals, suggesting that there is no substantial bias in terms of size between E-cadherin+ and E-cadherin- regions analyzed. Hence, spz location was reported as % of total spz imaged (Extended Figure 8i). For assessment of Trm in iCdh5-MyD88wt/wt, iCdh5-MyD8fl/fl, and CXCL9−/− animals, mice were vaccinated with Prime-target vaccination as described above. One-month post-vaccination, mice were treated with tamoxifen or vehicle control (as previously described). Two-weeks post-tamoxifen administration mice were euthanized and Trm localization was quantified using CD8, CD44, CXCR6 and CD69 as marker for Trm identification.
In silico Bacteria Capture Model.
To determine the effect of the spatial localization of macrophages within a capillary network on the efficiency of bacterial capture, we performed the following simulation.
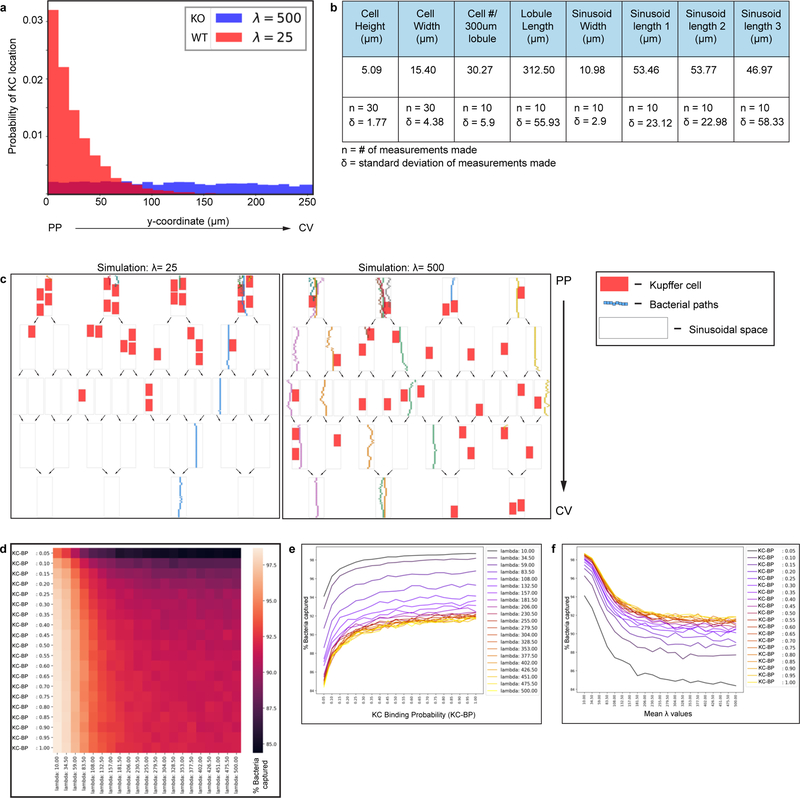
First, we simulated the capillary network by creating a 2D branching network made up of different vessels and strata of varying lengths, as displayed in Extended Figure 9c. The network starts with 4 vessels (stratum 1) that arise from the portal vein. Such vessels then split into 8 vessels (stratum 2), which in turn split into 16 vessels (stratum 3). Moving closer to the central vein, the vessels are randomly merged following the same pattern in reverse, generating first 8 vessels (stratum 4) and then 4 vessels (stratum 5).
Next, we placed macrophages in the capillary network assuming that their spatial distribution along the sinusoid was exponential (P(x) = (1/lambda)*exp(− x/lambda), where x indicates the spatial position along the sinusoid), with maximum probability near the portal vein. We tested different possible spatial distributions by changing the mean of the exponential distribution from 10 to 500 (λ-value). Specifically, we considered 21 possible values, equally spaced between 10 and 500. Notice that when this mean is comparable to or higher than the sinusoid length, the spatial distribution of macrophages within the sinusoid is approximately uniform, as shown in Extended Figure 9. For simplicity, we assumed that macrophages cannot sit at the split or merge of vessels, nor can they overlap with each other. Parameters related to sinusoidal network size, cell number and size were constrained using data obtained by quantifying confocal images in Imaris (as reported in Extended Figure 9b).
Finally, we simulated the motion of bacteria (size: 1×1 μm) through the network. Bacteria randomly enter one of the vessels of stratum 1 and then move along the capillary network, constrained by the vessel walls. For each time step, the bacteria proceed 1 μm towards the central vein, with additional lateral (transversal movement) towards the vessel walls. The laminar flow of bacteria through the vessel was approximated considering a linear decrease of the bacteria velocity from the center of the vessel to its walls. This was achieved by assigning a higher probability to displacements that move the bacteria closer to the center than to the walls of the vessel. Once bacteria arrive at the splitting of a vessel, they randomly choose to proceed in one of the two branches. Lastly, if the bacteria hit the vessel wall, then they will rebound toward the vessel center.
When a bacterium encounters a macrophage (i.e., bacteria overlap with a cell in the model), it is captured with a certain probability. Such probability is interpreted as the macrophage stickiness factor. If the bacterium is not stopped by the macrophage upon first encounter, but continues its trajectory over it, then we increase the probability that the bacterium may be stopped (i.e., the macrophage’s stickiness), by 20%. We considered 21 possible values for the initial stickiness of the macrophages, linearly spaced between 0 and 1.
For each possible combination of macrophage stickiness and of the mean exponential distribution (λ-value), we simulated 500 capillary networks with 30 macrophages. For each network, we simulated the motion of 500 bacteria. From these simulations, we measured the capability of the system of capturing bacteria by computing the percentage of bacteria that were successfully stopped before reaching the end of the simulate sinusoidal system, and the maximum distance that the bacteria reach. Specifically, we computed the mean and standard deviation of the percentage of stopped bacteria in each of the 500 realizations of the network and, considering one network for each setting of parameters, we computed the mean and standard deviation of the maximum distances achieved by the simulated bacteria. Modeling code can be accessed via GitHub at: https://github.com/UniboDIFABiophysics/LiverBacteriaCaptureAssay
Intravital microscopy of the liver.
Intravital imaging was performed on an upright SP8 Dive (Deep In Vivo Explorer) Leica microscope equipped with Mai Tai DeepSee and InSight X3 lasers and a 25x water immersion objective (NA 0.95). CXCR6-GFP+/− animals were prepped for surgery using isoflurane (Baxter FORANE, 1001936040), adding protective eye ointment (LubriFresh P.M., Major, 0904–6488-38) and removing hair. Liver intravital surgery was performed on a heated pad as described37. Briefly, to expose the liver, a transversal incision of the abdominal skin and peritoneal wall was performed using surgical scissors, with cauterizer minimally used only as needed. Without touching the liver surface, the ligament connecting liver and diaphragm (falciform ligament) as well as liver and gastrointestinal tract was cut using curved surgical scissors. A surgical thread (CP Medical; Monomid 5/0 Nylon; 661B) was placed through the xiphoid process to retract the ribs. Lateral supporting stakes (piles of cover slips) were placed at the sides of the animal, approximately the same height as the liver lobe. Next, a taped cover slip was placed transversely across the animal, right underneath the liver. By gently tipping the animal forward, with minimal contact with the liver capsule, one liver lobule was placed onto the taped coverslip. Vacuum seal grease was placed around the sides of the liver, and PBS (50–100 μl) was added on top to maintain tissue moisture. Gently, a cover slip was placed on top without excessive pressure (tissue remains red and well vascularized). To keep the rest of the chest cavity hydrated, surgical lubricant was added in abundance (Surgilube, 281020545). Lastly, E-cadherin-A594 antibody (10 ug, BioLegend) was injected i.v. to demarcate the PP-areas (sodium azide removed by dialysis (Millipore; Amicon Ultracel-10K; UFC501024)).
The animal was then transferred to the microscope and kept in a heated imaging chamber at a constant temperature of 36°C. Animals with damage and/or bleeding due to the surgery were not studied further. Epifluorescence imaging was used to inspect for surgery-related microscopic trauma, and if observed, the animal was also not used for further study. Data were acquired at a resolution of 512 × 512 (8 bit) in stacks of 16 frames (each 4 μm apart), acquiring a large volume tile scan (3×2) using LAS X software (Leica). Raw imaging data were processed and analyzed with Imaris (Bitplane). Three-dimensional tracking of cells was performed using Imaris to generate surfaces of individual objects over time. These data were further used to calculate the number and PV:PP ratio over time (normalized to volume), on a per/frame basis in ImageJ.
Flow-Cytometry, cell sorting of liver non-parenchymal cells and RNA-sequencing.
Mice were humanely euthanized by exposure to CO2. iCdh5-MyD88wt/wt and iCdh5-MyD88fl/fl livers were then processed for extraction of LSECs and KCs for fluorescence-activated cell sorting with modifications of published methodology38. Livers were perfused in a retrograde fashion-for 3 minutes at a rate of 5 ml/min through the inferior vena cava with HBSS without Ca++ or Mg++ (GIBCO) supplemented with 1 μM flavopiridol (Sigma), 0.5 mM EGTA, 0.5 mM EDTA, and 20 mM HEPES (GIBCO). The perfusate was then switched to 30 mL of digestion buffer comprised of HBSS with Ca++ and Mg++ (GIBCO) supplemented with 0.033 mg/ml of Liberase TM (Roche), 20 μg/ml DNase I, 1 μM flavopiridol, and 20 mM HEPES. Livers were then excised, minced, and digested for an additional 15 min at 37°C in 20 mL of fresh digestion buffer. After tissue digestion, cells were passed through a 70 μm cell strainer, and hepatocytes were removed by two low-speed centrifugation steps at 50 X G for 1 minute each. Non-parenchymal cells in the supernatant were further separated from debris by pelleting for 15 minutes at 600 X G in 50 mL of 20% isotonic Percoll (Sigma) at room temperature. Next, cells were washed from Percoll containing buffer and resuspended in 10 mL 28% OptiPrep (Sigma) and carefully underlaid beneath 3 mL of wash buffer. The resulting gradient was centrifuged at 1,400 X G for 25 minutes at 4°C with no brake and cells enriched at the interface were saved and subjected to RBC lysis (Thermo). Enriched non-parenchymal cells were washed, suspended in FACs buffer, then stained for 20 min on ice with CD31-A594, F4/80-Pacific Blue, Tim4- PE, CD117-FITC (all Biolegend) and TO-PRO-3 (Thermo). Markers used for LSECs isolation were used in accordance with a previously published scRNAseq data-set39 and further confirmed by histological analysis (Extended Figure 5). Stained cells were washed twice and strained through a 30 μm strainer, then subjected to cell sorting using a FACS-Aria cell sorter (BD Bioscience) and gated as per Extended Figure 5b. For each cell type, approximately 300,000 cells were sorted directly into TRIzol-LS Reagent (Thermo, 10296010). CXCR3 expression by KCs was assessed by performing the same cell extraction protocol and staining for the following markers at room-temperature: F4/80-Pacific Blue, Tim4- PE, CXCR3-APC, Live/dead-Aqua (Invitrogen).
Total RNA was extracted using Direct-zol RNA MiniPrep Plus (Zymo research, Cat#R2070) and the quality of the RNA was analyzed using a BioAnalyzer RNA Nano chips (Agilant 5067–1513). RNAseq libraries were prepared using TruSeq Stranded mRNA (with TruSeq Dual CD Indexes) (Illumina), and were sequenced on an Illumina NextSeq 500 (using 500/550 Hi Output KT v2.5) to an average read depth of 33 million reads per sample. Sequencing quality control was assessed using FastQC. Data shown in Figure 3, Extended Figure 7 are pooled from three independent biological replicates per condition.
Reads were demultiplexed using bcl2fastq and aligned to the mouse genome (mm10) using STAR aligner v2.740 and gene counts generated using featureCounts Subread v1.6.541. Count files were read into R v3.5, and normalized using edgeR v3.26.842 and cpm generated. Genes with a median log(cpm) less than −3 were removed from the analysis to prevent bias of lowly expressed genes. Expression of CD117 was validated to be unaffected by the iCdh5 gene inactivation and showed a gradient of increased expression from PV to CV (Extended Figure 7f). As this gene showed a strong gradient in LSECs, all genes log(cpm) were correlated to CD117. Correlations were calculated in R using the cor() function (package Stats v3.6.2). Knock-out conditions were confirmed as being specific to LSECs by specific loss of MyD88 gene expression in LSECs from iCdh5-MyD88fl/fl mice but not from iCdh5-MyD88wt/wt mice or in KCs of either animal (Extended Figure 5g). For gene set enrichment analysis, genes were ordered based on their correlation value to CD117 (c-Kit) and the fgsea package in R v1.12.043 was used to determine the enrichment scores. Top hits were determined by ranking of pathways with a significant p-value and ordered by their enrichment scores. Cell-cycle scoring was determined by adding the counts associated with cell cycle genes (G2M and S phase genes) and dividing by the total counts in each sample to get a % cell cycle genes. All data shown were of adjust p-values using MSigdb C2 cp44. RNA-seq data that support the findings of this study have been deposited in the Gene Expression Omnibus database with the accession number GSE144087.
Statistical analysis.
Mice of similar ages were randomly allocated into different groups; no statistical methods were used to predetermine sample size. Prism software (GraphPad, v8.4.3) was used for all statistical analysis, unless otherwise specified. Non-parametric tests were selected so as to not assume normal distribution: Two-tailed Mann-Whitney test or a Kruskal-Wallis test with Dunn’s multiple comparison adjustment were performed as specified. Where needed, and as outline in figure legends, Two-Way ANOVA with Sidak multi-comparison adjustment was performed. For all statistical test, the following p-values were used: ****p< 0.0001, ***p< 0.001, **p< 0.01, *p <0.05, and ns = not significant; exact p-values are reported either in figures or figure legends. All graphs show median and interquartile range highlighted, with each dot representing a liver lobule (unless otherwise specified differently). In figure legends, n numbers refer to biological replicates pooled from at least two different experiments, unless otherwise specified.
Spatial statistical analysis.
To determine CV:PP ratios, cells surfaces were first created in Imaris for each cell of interest. Subsequently, following import of images into Fiji (ImageJ, v2.0), liver lobule Regions of Interest (ROIs) were outlined using E-cadherin staining as guidance and the number of particles was counted per ROI (as outlined in Fig. 1c–d). The ROI volume was used to normalize the computed values, and the ratio between CV and PP was then calculated.
Spatial statistical analysis was performed in R-studio, using spatstat v 1.64–145 and ggplot2 v3.3.246 packages (Wong et al., manuscript in preparation). For REX3 analysis, KC, CD138, and endothelial CXCL9-RFP surfaces were created in Imaris (excluding CXCL9-RFP signal on KCs or hepatocytes). Positional data were subsequently exported and the probability density plots of a spatial point pattern generated using a Kernel smoothed intensity of point pattern (density.ppp) function (bandwidth calculated using bw.diggle function). A Rhohat function was subsequently used to calculate a nonparametric estimate of the intensity of a point process (i.e., KC, CXCL9, CD138), as a function of a continuous spatial covariate (E-cadherin MFI). An object of class “rhohat” is an estimate of the intensity of a point process, as a function of a given spatial covariate. Following calculation of Rhohat function, the plot generated displays the estimated function of rho (ρ) as a value of the spatial covariate (Extended Figure 5e). For MHCII spatial distributions (Extended Figure 1), KC distance to nearest CV was measured using Nearest Neighbours Between Two Patterns distance (nncross function) and plotted against MHCII MFI intensity. A linear model was fitted to the data.
Code and Data Availability
Source data is provided for all figures (see attached Excel files). Modeling code can be accessed via GitHub at: https://github.com/UniboDIFABiophysics/LiverBacteriaCaptureAssay. RNA-seq data that support the findings of this study have been deposited in the Gene Expression Omnibus database with the accession number GSE144087.
Extended Data
Extended Figure 1. Kupffer cell MHCII expression and localization in mouse and human livers.
(a) Representative IF image of F4/80+, MHCII, Collagen IV, and E-cadherin expression in mouse liver lobule. (i-iii) Channel shown labelled in figures, CV highlighted by dashed circles in IFs. (b) Scatter plot of KC MHCII Mean Fluorescence Intensity (MFI) and distance to the centre of CV vasculature (μm) (n=3 mice, 2 lobules/mouse, each dot represents a KC). Linear regression model shown, intercept (m), p-value (Two-Tailed t-test) and R2 indicated in figure. (c) Representative IF human liver image of Kupffer cells (stained by CD163 and HLA-DR) and liver enzymes ASS1 and GS to identify the liver lobule (CV highlighted by dashed circles in IF images). (d) Total number of KCs cells in PP and CV regions normalized to volume, each dot represents an ROI; Median shown. Two-tailed Mann-Whitney; *p =0.0448. (n = 7 donors). Channels and CV as labelled in image.
Extended Figure 2. NKT cells show peri-portal enrichment, and are disrupted in iCdh5-MyD88−/− and CXCL9−/− animals.
(a) Representative IF image with CXCR6-GFP (NKT), E-cadherin, and CD1d, CV highlighted by dashed circles in IF images. (b) Total number of NKT cells in PP and CV regions normalized to volume, each dot represents an ROI. n = 4 mice, Two-tailed Mann-Whitney, **** p<0.0001; Median shown. (c) Representative image from 2P-intravital movie of CXCR6-GFP animal showing E-Cadherin antibody injected intravenously i.v. and NKT cell positioning at time zero; Bottom: compiled NKT cell tracks. (d) Representative ratio of total NKT cell numbers in CV to PP ROIs per frame over time. (e) Total number of NKT cells in PP and CV regions normalized to volume for 2-P intravital movies, each dot represents an ROI. n = 3 mice, Two-tailed Mann-Whitney, **** p<0.0001; Median shown. (f) Ratio of total NKT cell numbers in CV to PP ROIs for 2-P intravital movies, each dot represents a frame. n = 3 mice. (g) Representative IF image CXCR6+ CD3+ cells (NKT cells), and E-cadherin in iCdh5-MyD88wt/wt, iCdh5-MyD88fl/fl and CXCL9−/− animals. (h) Ratio of total NKT cells in PP and CV regions normalized to volume, and (i) total number of cells per volume; each dot represents a lobule. n = 4 mice/condition, Kruskal-Wallis test, Dunn’s multiple comparison test, ***p= 0.0002, **p= 0.0013, ns (not significant) p>0.9999; Median and quartile range shown. Channels and CV as labelled in image.
Extended Figure 3. IF images and total numbers of KCs in animals with distinct commensal microbiomes.
(a) Total number of KCs normalized to volume in AlbCre-βcateninwt/wt and AlbCre-βcateninfl/fl animals, eat dot represent a biological replicate, n = 3 mice/condition, Two-tailed Mann-Whitney test, ns p-value= 0.400; Median shown. (b) Representative IF images of mouse livers at days (D) 3, 8, 13, 20, and 25 post-partum. At D3, GS synthetase expression is absent and E-cadherin is homogenously expressed throughout the liver lobule; by D8 both molecules show zonation. (c) Same representative IF images of mouse livers at days (D) 3, 8, 13, 20, and 25 post-partum showing E-cadherin and F4/80+ KCs (for quantification, see Fig 1h). (d) Total number of KCs normalized to volume at days (D) 3, 8, 13, 20, and 25 post-partum, eat dot represent a biological replicate, n = 5 mice/time point. Kruskal-Wallis test with Dunn’s multiple comparison: For D25 vs D3/D8/D13: ns p-value> 0.9999, for D25 vs D20: ns p-value=0.8492; Median shown. Channels and CV as labelled in image. (e) Representative IF image showing normal germ-free animal liver lobule metabolic zonation depicting glutamine synthetase (GS), arginase 1 (ARG1), argininosuccinate synthase 1 (ASS1) and Cytochrome P450 2E (Cyp2e1) expression, for comparison: see SPF zonation gradients in Fig. 1b. (f-k) Representative IF images showing F4/80+ KC distribution within mouse liver (insets showing F4/80+ staining only) and total number of KCs normalized to volume in (f-g) GF and SPF animals (each dot present a biological replicate), n = 5 mice/condition; Two-Tailed Mann-Whitney test, ns p-value= 0.5159, Median shown; (h-i) GF animals after cohousing with SPF animals (each dot present a biological replicate), n = 6 mice/condition, Kruskal-Wallis test with Dunn’s multiple comparison. For SPF vs D4/D14: ns p-value>0.9999, for SPF vs D2 ns p-value=0.2650, for SPF vs D7 ns p-value=0.5255; Median shown. (j-k) SPF animals after antibiotic (ABX) treatment, (each dot presents a biological replicate), n = 6 mice/condition, Kruskal-Wallis test with Dunn’s multiple comparison. For SPF vs 3-wks: ns p-value=0.8725, for SPF vs 6-wks: ns p-value=0.2936; Median shown. (l) Representative IF image showing F4/80+ KC distribution of GF animals orally gavaged with LPS (two weeks post treatment), and PBS control animals (insets showing F4/80 staining only, CV highlighted by dashed circles in IFs). (m) Ratio of total KC numbers in CV to PP ROIs, each dot represents a lobule. n = 6 mice/condition, Two-tailed Mann-Whitney test, **** p<0.0001; Median and quartiles shown. (n) Total number of KCs normalized to volume in global knock-outs for MyD88, TRL4, TRIF and Caspase1/11 (each dot presents a biological replicate), n = 4 Caspase 1/11−/− mice, n= 5 MyD88−/− and WT mice, n= 6 TLR4−/− and TRIF−/− animals, Kruskal-Wallis test with Dunn’s multiple comparison test. For WT vs TRIF−/−/Caspase 1/11−/−: ns p-value>0.9999, for WT vs MyD88−/−: ns p-value=0.0776, WT vs TLR4−/−: ns p-value=0.0524; Median shown. Channels shown labelled in figures, CV highlighted by dashed circles in IFs.
Extended Figure 4. iCdh5-Cre. Alb-Cre and LysM-Cre livers reporters: loss of MyD88 signalling in hepatocytes and KCs does not alter KC localization.
(a) Representative IF image showing iCdh5-Cre expression when crossed to a Rosa26-tdTomato reporter. (b) Zoomed in image: iCdh5-Cre-tdTomato is predominantly found on CD138+ LSECs, but can also be seen on a small number of KCs. (c) Percentage of total tdTomato+ KCs in iCdh5-Cre-tdTomato animals, each dot represents a biological replicate, n=3 mice. (d) MFI of tdTomato on tdTomato+ F4/80+ KCs and tdTomato+ LSECs from iCdh5-Cre-tdTomato (each dot represents a cell), n = 3 mice/condition, Two-tailed Mann-Whitney test, **** p<0.0001; Median shown. (e-f) Representative IF image showing F4/80+ KC distribution of (e) Alb-MyD88−/− and (f) LysM-MyD88−/− animals with littermate controls, CV highlighted by dashed circles in IFs. (g) Ratio of total KC numbers in CV to PP ROIs, (each dot represents a lobule), n = 4 mice/condition, Kruskal-Wallis test with Dunn’s multiple comparison test. For WT vs LysMCre-MyD88flfl-: ns p-value>0.9999, for WT vs AlbCre-MyD88fl/fl: ns p-value=0.2082; Median shown. (h) total KC numbers per volume; each dot represents a lobule. n = 4 mice/condition, Kruskal-Wallis test with Dunn’s multiple comparison test. For WT vs LysMCre-MyD88flfl-: ns p-value=0.0781, for WT vs AlbCre-MyD88fl/fl: ns p-value=0.0624; Median shown. Channels shown labelled in figures, CV highlighted by dashed circles in IFs.
Extended Figure 5. Sort strategy for LSECs populations and CXCL9 translation and protein expression in iCdh5-MyD88wt/wt, iCdh5-MyD88fl/fl, and CXCL9−/− animals.
(a) Representative IF image of CD117 expression around the CV on iCdh5-MyD88wt/wt, Global MyD88−/− and iCdh5-MyD88fl/fl animals, n=2 mice. CV highlighted by dashed circles in IFs. (b) Representative flow-cytometry gating strategy for bulk RNAseq sort: cells were sorted on forward-side scatter, singlets and live. KCs were identified by expression of F4/80+ and Tim4+. LSECs were identified by CD31+ and sorted into low, medium and high CD117 populations. (c) Chemokine expression across the liver lobule as a correlate to CD117 in iCdh5-MyD88wt/wt animals. Statistical significance determined by edge-R glmLTR test, mean shown from 3 biological replicates; *p-values for: Cxcl9= 0.009785, Ccl17= 0.0147, Cxcl13= 0.03433, Ccl24= 0.01569, Ccl6= 0.0004875. (d) Representative IF image showing CXCL9-RFP expression on CD138+ LSECs in REX3 animals (Density plot of CXCL9 shown in Fig. 3a). (e) Non-parametric estimate of the spatial intensity of KC, CXCL9, and CD138, (ρ(E-cadherin)) as a value of spatial covariate E-cadherin MFI, see Methods for details. n = 3 mice/condition. (f-g) Log counts per million of (f) CD117 (ns p-value= 0.9695) and (g) MyD88 (ns p-value= 1, **** p= 3.549e-23) in LSECs and KCs. Statistical significance determined by edge-R glmLTR test, each dot represents a biological sample from sorted populations (n=3 mice/condition). (h) Chemokine expression across the liver lobule as a correlate to CD117 in iCdh5-MyD88fl/fl animals. In red are chemokines that are PP associated in WT animals. Statistical significance determined by edge-R glmLTR test; *p-values for: Cxcl11= 0.01102, Ccl21a= 0.03187. (i) Ratio of total KC numbers in CV to PP ROIs in global CCR2, CCR5, CCL5, CCL2, CX3CR1 knock-out animals (each dot represents a lobule), n = 4 mice/condition for knock-out animals, and n=3 mice for WT controls. Kruskal-Wallis test with Dunn’s multiple comparison test, for all comparisons: ns p-value>0.9999, with the exception of WT vs CCL5−/−: ns p-value=0.3098; Median shown. Channels shown labelled in figures, CV highlighted by dashed circles in IFs.
Extended Figure 6. Expression of KC putative markers in iCdh5-MyD88wt/wt and iCdh5-MyD88fl/fl animals.
(a) Log counts per million of Cxcr3 in KCs and LSECs from MyD88wt/wt and iCdh5-MyD88fl/fl mice; biological replicates of sorted populations shown, statistical significance determined by edge-R glmLTR test; for all: ns p-value-values LSECs= 0.3191, and ns p-value-values KCs= 1. (b-d) CXCR3 expression on KCs of WT, CXCR3−/− and CXCL9−/− mice as determined by flow-cytometry: (b) Histogram of CXCR3, (c) Quantification of CXCR3 MFI and (d) % of F4/80+ CXCR3+ of total F4/80+ cells (each dot represents a biological replicate). n=4 mice/group; Kruskal-Wallis test with Dunn’s multiple comparison, *p =0.0310, **p= 0.0089; Median shown. (e) Representative IF image of Tim4, Clec4f and F4/80 expression in KCs of iCdh5-MyD88wt/wt and iCdh5-MyD88fl/fl animals. CV highlighted by dashed circles in IFs. Quantification of (f) Percent of Tim4+ Clec4f+ F4/80+ cells (ns p-value = 0.5) and MFI of (g) Tim4 (ns p-value = 0.7), (h) Clec4f (ns p-value = 0.4), and (i) F4/80 (ns p-value >0.9999); n= 3 mice/condition, Two-tailed Mann-Whitney test. (j) Log counts per million of Nr1h3, Id3, Clec4f, Ccr2, Spic, and Timd4 in KCs from MyD88wt/wt and iCdh5-MyD88fl/fl mice; biological replicates of sorted populations shown, statistical significance determined by edge-R glmLTR test; for all: ns p-value-values= 1. (k) Percent of counts associated with cell cycle from RNASeq in KCs and LSECs from MyD88wt/wt and iCdh5-MyD88fl/fl mice, biological replicates shown, Two-Way Anova with Sidak MC test, ns p-value-value for KCs= 0.4710, for LSECs= 0.1591.
Extended Figure 7. RNAseq GAG pathway and histological ECM composition.
(a) GSEA Enrichment scores in relation to CD117 expression in LSECs from iCdh5-MyD88wt/wt (x-axis) and iCdh5-MyD88fl/fl (y-axis). Highlighted, pathways enriched towards the PP regions of iCdh5-MyD88wt/wt disrupted in iCdh5-MyD88fl/fl animals (Top 10 pathways shown in Fig. 3k). (b) GAG pathway enrichment score in iCdh5-MyD88wt/wt and iCdh5-MyD88fl/fl. iCdh5-MyD88wt/wt show strong PP GAG enrichment, lost and/or disrupted in iCdh5-MyD88fl/fl animals. (c) Representative IF image of Hyaluronic acid binding protein (HABP) detecting Hyaluronic acid (HA) in iCdh5-MyD88wt/wt and iCdh5-MyD88fl/fl. (d) Representative IF image of HS in iCdh5-MyD88wt/wt and iCdh5-MyD88fl/fl. (e-f) MFI of HS and HABP (respectively) in PP and CV ROIs of iCdh5-MyD88wt/wt and iCdh5-MyD88fl/fl animals, each dot represents an ROI; n=4 iCdh5-MyD88wt/wt mice and n= 5 iCdh5-MyD88fl/fl animals, Two-Way ANOVA with Sidak multiple comparison test; Median shown. (e) **p =0.0011, ns p-value-value= 0.0654. (f) *p =0.0348, ns p-value-value= 0.5972. Channels shown labelled in figures.
Extended Figure 8. In vivo and in vitro capture of L. monocytogenes and malaria sporozoite spatial location upon following liver infection.
(a) Representative IF image showing L. monocytogenes-GFP captured by KCs in iCdh5-MyD88wt/wt either in PP Region (E-cadherin+) or CV Region (E-cadherin-) two hours post i.v. administration. Quantification and experimental details shown in Fig. 4a. (b-c) Percent of L. monocytogenes captured in liver, spleen and blood after portal vein injection in (b) CXCR3−/− (** p=0.0023, * p=0.0263, ns p-value= 0.7585) and (c) CXCL9−/− animals (*** p=0.0001, * p= 0.0102, ns p-value= 0.209); each dot represents a biological replicate, n= 4–8 animals/group, Two-way ANOVA with Sidak multiple; Median shown. (d-f) In vitro bacteria capture assay of L. monocytogenes-GFP using KCs extracted from iCdh5-MyD88wt/wt and iCdh5-MyD88fl/fl animals. (d) Representative flow cytometry histograms of infected and uninfected KCs at 4°C and 37°C showing L. monocytogenes-GFP intensity. (e-f) Quantification of flow-cytometry data showing percent of KCs with bound L. monocytogenes at 4°C and 37°C; each dot represents a biological replicate, n=4 mice/condition; Two-tailed Mann-Whitney test, ns p-value= 0.3429; Median shown. (g) Representative examples of sporozoites (spz) locations one-day post liver infection in naïve animals; spz stained with anti-CSP antibody. (h-i) Quantification of location of spz infection: (h) % of total liver in WT mice that is E-cadherin+, each dot represents a biological replicate, median shown. (i) % of total spz either in E-cadherin+ regions or outside E-cadherin+ regions; n=250 spz imaged, data pooled from 3 different mice- eat dot represents a mouse (see Methods section regarding quantification); Two-tailed Mann-Whitney (ns p-value= 0.1000).
Extended Figure 9. In silico model of bacterial capture in sinusoidal network.
(a) Example of the exponential distribution used to sample the KC locations along the sinusoid. The two histograms refer to two different values of the mean of the exponential distribution: λ=25 (red- simulating a WT distribution) and λ=500 (blue- simulating a KO distribution). (b) Parameters used to constrain model simulations, obtained from analyzing confocal images, mean number displayed (n= number of measurements made for each parameter, δ= standard deviation of measurements made).
(c) Illustrations of two example simulations in which the KC locations are sampled from an exponential distribution with mean λ=25 (left) and λ=500 (right). The top part of the graph corresponds to the PP region, the bottom part to the CV. White rectangles represent sinusoidal segments. Arrows schematically indicate the splitting and merging of vessels. Red rectangles symbolize KCs, while small colored rectangles are representative of bacteria. The path of each bacterium is described by the string of rectangles of the same color. All bacteria start their motion at the top of the graph (PP region) and only bacteria that are not successfully stopped by KCs reach the bottom (CV). In both simulations we show the path of 10 bacteria. (d-f) Simulating varying KC distributions (λ) and KC bacterial binding probability in parameter space: the network’s capturing capacity is proportional to increases of KC binding probability while inversely proportional to increases of λ values. Average percent of stopped bacteria as a function of KC binding probability (KC-BP - a probabilistic value of KC capture from 0–1), and of the mean of the exponential distribution λ. (d) Results reported in a heat map in which the color corresponds to the average percentage of stopped bacteria, as detailed by the color bar, rows correspond to KC-BP values and columns to different λ-values. (e-f) Results reported as line graphs with average percentages of stopped bacteria reported and increasing values of (e) KC binding probability (KC-BP) or (f) λ-values. Colour of each line corresponds to either changes of KC binding probability or λ-value respectively.
Extended Figure 10. Multi-parameter, iterative staining (IBEX) of Prime and Target vaccinated animals.
(a) Representative IF image of Prime and Target vaccinated animal showing expression of a diverse set of immune and non-parenchymal associated markers in relationship to E-cadherin acquired via IBEX staining (Channels shown labelled in figures). (b) Ratio of total cell numbers in CV to PP ROIs, each dot represents a lobule (each dot represents a lobule); n = 3 mice/condition, Kruskal-Wallis test, Dunn’s multiple comparison test; Median shown. KC vs Desmin: ns p-value=0.3071, KC vs CD11c: ns p-value= 0.0549, KC vs Monocytes: ns p-value=0.0510. (c) Total number of Trm (CD8+ CD44+ CXCR6+ CD69+ T-cells) per volume in iCdh5-MyD88wt/wt, iCdh5-MyD88fl/fl and CXCL9−/− animals (each dot represents a biological replicate). n = 3 mice/condition; Kruskal-Wallis test, Dunn’s multiple comparison test; Median shown, ns p-value>0.9999. (d) Ratio of Trm numbers in CV to PP ROIs, each dot represents a lobule. n = 3 mice/condition; Median shown, Kruskal-Wallis test, Dunn’s multiple comparison test, **p= 0.0035, ns p-value=0.1275.
Supplementary Material
Acknowledgements
We thank A. Luster and J. Lian for providing REX3 animals; E. Miao for providing (ΔintAB inlAm) Listeria stocks; P. Brook for preliminary versions of in silico bacteria capture model; Y. Belkaid and N. Bouladoux for germ-free animals; R.H. Adams for iCdh5-Cre mice; A. Martins for help in RNAseq experiments; C. Chu for critical reading of the manuscript; and, all members of the Laboratory of Immune Systems Biology for their comments during the course of these studies and input during preparation of this manuscript. APB is supported by a Marie Sklodowska-Curie Action (MSCA) fellowship. This research was supported by the Intramural Research Program of NIAID, NIH.
Footnotes
The authors declare no competing interests.
References
- 1.Kubes P & Jenne C Immune Responses in the Liver. Annu Rev Immunol 36, 247–277, doi: 10.1146/annurev-immunol-051116-052415 (2018). [DOI] [PubMed] [Google Scholar]
- 2.Kastenmuller W, Torabi-Parizi P, Subramanian N, Lammermann T & Germain RN A spatially-organized multicellular innate immune response in lymph nodes limits systemic pathogen spread. Cell 150, 1235–1248, doi: 10.1016/j.cell.2012.07.021 (2012). [DOI] [PMC free article] [PubMed] [Google Scholar]
- 3.Baptista AP et al. The Chemoattractant Receptor Ebi2 Drives Intranodal Naive CD4(+) T Cell Peripheralization to Promote Effective Adaptive Immunity. Immunity 50, 1188–1201 e1186, doi: 10.1016/j.immuni.2019.04.001 (2019). [DOI] [PubMed] [Google Scholar]
- 4.Doi Y et al. Development of complementary expression patterns of E- and N-cadherin in the mouse liver. Hepatol Res 37, 230–237, doi: 10.1111/j.1872-034X.2007.00028.x (2007). [DOI] [PubMed] [Google Scholar]
- 5.Braeuning A et al. Differential gene expression in periportal and perivenous mouse hepatocytes. FEBS J 273, 5051–5061, doi: 10.1111/j.1742-4658.2006.05503.x (2006). [DOI] [PubMed] [Google Scholar]
- 6.Bouwens L, Baekeland M, De Zanger R & Wisse E Quantitation, tissue distribution and proliferation kinetics of Kupffer cells in normal rat liver. Hepatology 6, 718–722, doi: 10.1002/hep.1840060430 (1986). [DOI] [PubMed] [Google Scholar]
- 7.Sleyster EC & Knook DL Relation between localization and function of rat liver Kupffer cells. Lab Invest 47, 484–490 (1982). [PubMed] [Google Scholar]
- 8.Itoh Y et al. Functional heterogeneity of rat liver macrophages: interleukin-1 secretion and Ia antigen expression in contrast with phagocytic activity. Liver 12, 26–33, doi: 10.1111/j.1600-0676.1992.tb00551.x (1992). [DOI] [PubMed] [Google Scholar]
- 9.Gerner MY, Kastenmuller W, Ifrim I, Kabat J & Germain RN Histo-cytometry: a method for highly multiplex quantitative tissue imaging analysis applied to dendritic cell subset microanatomy in lymph nodes. Immunity 37, 364–376, doi: 10.1016/j.immuni.2012.07.011 (2012). [DOI] [PMC free article] [PubMed] [Google Scholar]
- 10.MacParland SA et al. Single cell RNA sequencing of human liver reveals distinct intrahepatic macrophage populations. Nat Commun 9, 4383, doi: 10.1038/s41467-018-06318-7 (2018). [DOI] [PMC free article] [PubMed] [Google Scholar]
- 11.Geissmann F et al. Intravascular immune surveillance by CXCR6+ NKT cells patrolling liver sinusoids. PLoS Biol 3, e113, doi: 10.1371/journal.pbio.0030113 (2005). [DOI] [PMC free article] [PubMed] [Google Scholar]
- 12.Benhamouche S et al. Apc tumor suppressor gene is the “zonation-keeper” of mouse liver. Dev Cell 10, 759–770, doi: 10.1016/j.devcel.2006.03.015 (2006). [DOI] [PubMed] [Google Scholar]
- 13.Burke ZD et al. Liver zonation occurs through a beta-catenin-dependent, c-Myc-independent mechanism. Gastroenterology 136, 2316–2324 e2311–2313, doi: 10.1053/j.gastro.2009.02.063 (2009). [DOI] [PubMed] [Google Scholar]
- 14.Shiojiri N et al. Heterogeneous hepatocellular expression of glutamine synthetase in developing mouse liver and in testicular transplants of fetal liver. Lab Invest 72, 740–747 (1995). [PubMed] [Google Scholar]
- 15.Schloss PD et al. Stabilization of the murine gut microbiome following weaning. Gut Microbes 3, 383–393, doi: 10.4161/gmic.21008 (2012). [DOI] [PMC free article] [PubMed] [Google Scholar]
- 16.Mao K et al. Innate and adaptive lymphocytes sequentially shape the gut microbiota and lipid metabolism. Nature 554, 255–259, doi: 10.1038/nature25437 (2018). [DOI] [PubMed] [Google Scholar]
- 17.Jacob AI, Goldberg PK, Bloom N, Degenshein GA & Kozinn PJ Endotoxin and bacteria in portal blood. Gastroenterology 72, 1268–1270 (1977). [PubMed] [Google Scholar]
- 18.Lynch RW et al. An efficient method to isolate Kupffer cells eliminating endothelial cell contamination and selective bias. J Leukoc Biol 104, 579–586, doi: 10.1002/JLB.1TA0517-169R (2018). [DOI] [PMC free article] [PubMed] [Google Scholar]
- 19.Greenhalgh SN, Conroy KP & Henderson NC Cre-ativity in the liver: transgenic approaches to targeting hepatic nonparenchymal cells. Hepatology 61, 2091–2099, doi: 10.1002/hep.27606 (2015). [DOI] [PMC free article] [PubMed] [Google Scholar]
- 20.Weber M et al. Interstitial dendritic cell guidance by haptotactic chemokine gradients. Science 339, 328–332, doi: 10.1126/science.1228456 (2013). [DOI] [PubMed] [Google Scholar]
- 21.Halpern KB et al. Paired-cell sequencing enables spatial gene expression mapping of liver endothelial cells. Nat Biotechnol 36, 962–970, doi: 10.1038/nbt.4231 (2018). [DOI] [PMC free article] [PubMed] [Google Scholar]
- 22.Garcia-Lopez MA et al. CXCR3 chemokine receptor distribution in normal and inflamed tissues: expression on activated lymphocytes, endothelial cells, and dendritic cells. Lab Invest 81, 409–418, doi: 10.1038/labinvest.3780248 (2001). [DOI] [PubMed] [Google Scholar]
- 23.Thomas SY et al. CD1d-restricted NKT cells express a chemokine receptor profile indicative of Th1-type inflammatory homing cells. J Immunol 171, 2571–2580, doi: 10.4049/jimmunol.171.5.2571 (2003). [DOI] [PubMed] [Google Scholar]
- 24.Groom JR et al. CXCR3 chemokine receptor-ligand interactions in the lymph node optimize CD4+ T helper 1 cell differentiation. Immunity 37, 1091–1103, doi: 10.1016/j.immuni.2012.08.016 (2012). [DOI] [PMC free article] [PubMed] [Google Scholar]
- 25.Sakai M et al. Liver-Derived Signals Sequentially Reprogram Myeloid Enhancers to Initiate and Maintain Kupffer Cell Identity. Immunity 51, 655–670 e658, doi: 10.1016/j.immuni.2019.09.002 (2019). [DOI] [PMC free article] [PubMed] [Google Scholar]
- 26.Metzemaekers M, Vanheule V, Janssens R, Struyf S & Proost P Overview of the Mechanisms that May Contribute to the Non-Redundant Activities of Interferon-Inducible CXC Chemokine Receptor 3 Ligands. Front Immunol 8, 1970, doi: 10.3389/fimmu.2017.01970 (2017). [DOI] [PMC free article] [PubMed] [Google Scholar]
- 27.Vanheule V et al. CXCL9-Derived Peptides Differentially Inhibit Neutrophil Migration In Vivo through Interference with Glycosaminoglycan Interactions. Front Immunol 8, 530, doi: 10.3389/fimmu.2017.00530 (2017). [DOI] [PMC free article] [PubMed] [Google Scholar]
- 28.Lammermann T et al. Neutrophil swarms require LTB4 and integrins at sites of cell death in vivo. Nature 498, 371–375, doi: 10.1038/nature12175 (2013). [DOI] [PMC free article] [PubMed] [Google Scholar]
- 29.Fernandez-Ruiz D et al. Liver-Resident Memory CD8(+) T Cells Form a Front-Line Defense against Malaria Liver-Stage Infection. Immunity 45, 889–902, doi: 10.1016/j.immuni.2016.08.011 (2016). [DOI] [PubMed] [Google Scholar]
- 30.Gola A et al. Prime and target immunization protects against liver-stage malaria in mice. Sci Transl Med 10, doi: 10.1126/scitranslmed.aap9128 (2018). [DOI] [PubMed] [Google Scholar]
Methods References
- 31.Groom JR et al. CXCR3 chemokine receptor-ligand interactions in the lymph node optimize CD4+ T helper 1 cell differentiation. Immunity 37, 1091–1103, doi: 10.1016/j.immuni.2012.08.016 (2012). [DOI] [PMC free article] [PubMed] [Google Scholar]
- 32.Sorensen I, Adams RH & Gossler A DLL1-mediated Notch activation regulates endothelial identity in mouse fetal arteries. Blood 113, 5680–5688, doi: 10.1182/blood-2008-08-174508 (2009). [DOI] [PubMed] [Google Scholar]
- 33.Li W, Germain RN & Gerner MY Multiplex, quantitative cellular analysis in large tissue volumes with clearing-enhanced 3D microscopy (Ce3D). Proc Natl Acad Sci U S A 114, E7321–E7330, doi: 10.1073/pnas.1708981114 (2017). [DOI] [PMC free article] [PubMed] [Google Scholar]
- 34.Goddard ET, Fischer J & Schedin P A Portal Vein Injection Model to Study Liver Metastasis of Breast Cancer. J Vis Exp, doi: 10.3791/54903 (2016). [DOI] [PMC free article] [PubMed] [Google Scholar]
- 35.Pentecost M, Kumaran J, Ghosh P & Amieva MR Listeria monocytogenes internalin B activates junctional endocytosis to accelerate intestinal invasion. PLoS Pathog 6, e1000900, doi: 10.1371/journal.ppat.1000900 (2010). [DOI] [PMC free article] [PubMed] [Google Scholar]
- 36.Gola A et al. Prime and target immunization protects against liver-stage malaria in mice. Sci Transl Med 10, doi: 10.1126/scitranslmed.aap9128 (2018). [DOI] [PubMed] [Google Scholar]
- 37.Heymann F et al. Long term intravital multiphoton microscopy imaging of immune cells in healthy and diseased liver using CXCR6.Gfp reporter mice. J Vis Exp, doi: 10.3791/52607 (2015). [DOI] [PMC free article] [PubMed] [Google Scholar]
- 38.Sakai M et al. Liver-Derived Signals Sequentially Reprogram Myeloid Enhancers to Initiate and Maintain Kupffer Cell Identity. Immunity 51, 655–670 e658, doi: 10.1016/j.immuni.2019.09.002 (2019). [DOI] [PMC free article] [PubMed] [Google Scholar]
- 39.Halpern KB et al. Paired-cell sequencing enables spatial gene expression mapping of liver endothelial cells. Nat Biotechnol 36, 962–970, doi: 10.1038/nbt.4231 (2018). [DOI] [PMC free article] [PubMed] [Google Scholar]
- 40.Dobin A et al. STAR: ultrafast universal RNA-seq aligner. Bioinformatics 29, 15–21, doi: 10.1093/bioinformatics/bts635 (2013). [DOI] [PMC free article] [PubMed] [Google Scholar]
- 41.Liao Y, Smyth GK & Shi W featureCounts: an efficient general purpose program for assigning sequence reads to genomic features. Bioinformatics 30, 923–930, doi: 10.1093/bioinformatics/btt656 (2014). [DOI] [PubMed] [Google Scholar]
- 42.McCarthy DJ, Chen Y & Smyth GK Differential expression analysis of multifactor RNA-Seq experiments with respect to biological variation. Nucleic Acids Res 40, 4288–4297, doi: 10.1093/nar/gks042 (2012). [DOI] [PMC free article] [PubMed] [Google Scholar]
- 43.Sergushichev AA An algorithm for fast preranked gene set enrichment analysis using cumulative statistic calculation. BioRxiv, doi: 10.1101/060012 (2016). [DOI] [Google Scholar]
- 44.Subramanian A et al. Gene set enrichment analysis: a knowledge-based approach for interpreting genome-wide expression profiles. Proc Natl Acad Sci U S A 102, 15545–15550, doi: 10.1073/pnas.0506580102 (2005). [DOI] [PMC free article] [PubMed] [Google Scholar]
- 45.Turner A. B. a. R. spatstat: An R Package for Analyzing Spatial Point Patterns. Journal of Statistical Software 12, 1–42 (2005). [Google Scholar]
- 46.Wickham H ggplot2: Elegant Graphics for Data Analysis. (2016).
Associated Data
This section collects any data citations, data availability statements, or supplementary materials included in this article.
Supplementary Materials
Data Availability Statement
Source data is provided for all figures (see attached Excel files). Modeling code can be accessed via GitHub at: https://github.com/UniboDIFABiophysics/LiverBacteriaCaptureAssay. RNA-seq data that support the findings of this study have been deposited in the Gene Expression Omnibus database with the accession number GSE144087.


