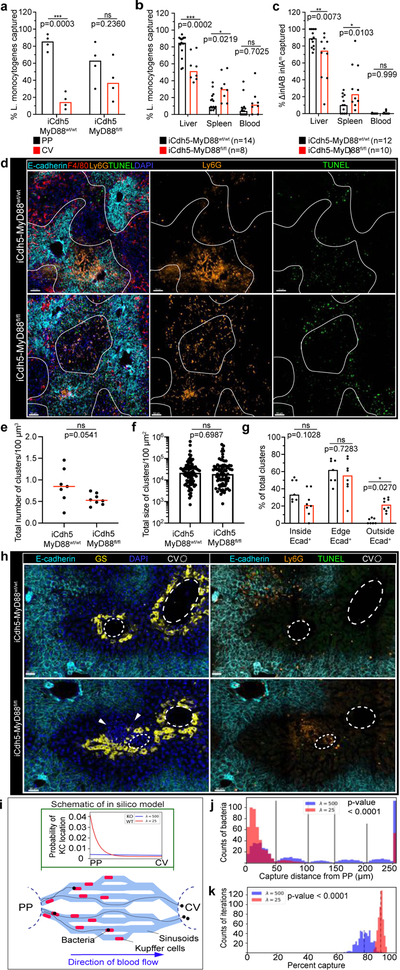
Figure 4. KC localization plays a critical role in preventing pathogen dissemination.
(a) Percent of Listeria captured around PP (E-cadherin+) and CV (E-cadherin-) regions in iCdh5-MyD88wt/wt and iCdh5-MyD88fl/fl animals 2-hours post i.v. injection, n= 4 animals/group. (b-c) Percent of Listeria captured after (b) PP injection, or (c) oral gavage, in liver, spleen and blood from iCdh5-MyD88wt/wt and iCdh5-MyD88fl/fl animals; n shown in figure. (d-g) iCdh5-MyD88wt/wt and iCdh5-MyD88fl/fl animals D1 post i.v. injection of Listeria. (d) Representative IF image of showing TUNEL+ and Ly6G infectious clusters. Quantification of (e) total number of clusters per volume, (f) total size (dots: clusters), and (g) percent location of total clusters; n= 7 animas/group. (h) Representative IF image of iCdh5-MyD88wt/wt and iCdh5-MyD88fl/fl liver showing infectious clusters around CV. (i) Schematic of in silico bacteria capture model: sinusoidal network from PP to CV, with KCs (red) and bacterial-tracks (black line), and final position of each bacteria (black dot). Green window: schematic of exponential distributions used to sample KC locations along sinusoids, λ=25 (red- WT) and λ=500 (blue- KO). (j) Distributions of the captured bacterial distance from PP using λ=500 or λ=25 for KC locations. Last bin of histogram: number of bacteria that are not captured. Two-tailed t-test (excluding last bin). (k) Distributions of the average percent capture of bacteria by KCs from sampled locations from exponential distributions λ=500, or λ=25. Mean- black dashed line; Two-tailed t-test. Experimental data: pooled from 2–4 independent experiments; Median shown, (a-c, e, g) dots represent biological replicates. (a-c, g) Two-Way ANOVA with Sidak’s MC, (e-f) Two-tailed Mann-Whitney. Channel colours and CV as labelled.

