Abstract
Background
The 5-year overall survival rate of ovarian cancer (OC) patients is less than 40%. Hypoxia promotes the proliferation of OC cells and leads to the decline of cell immunity. It is crucial to find potential predictors or risk model related to OC prognosis. This study aimed at establishing the hypoxia-associated gene signature to assess tumor immune microenvironment and predicting the prognosis of OC.
Methods
The gene expression data of 378 OC patients and 370 OC patients were downloaded from datasets. The hypoxia risk model was constructed to reflect the immune microenvironment in OC and predict prognosis.
Results
8 genes (AKAP12, ALDOC, ANGPTL4, CITED2, ISG20, PPP1R15A, PRDX5, and TGFBI) were included in the hypoxic gene signature. Patients in the high hypoxia risk group showed worse survival. Hypoxia signature significantly related to clinical features and may serve as an independent prognostic factor for OC patients. 2 types of immune cells, plasmacytoid dendritic cell and regulatory T cell, showed a significant infiltration in the tissues of the high hypoxia risk group patients. Most of the immunosuppressive genes (such as ARG1, CD160, CD244, CXCL12, DNMT1, and HAVCR1) and immune checkpoints (such as CD80, CTLA4, and CD274) were upregulated in the high hypoxia risk group. Gene sets related to the high hypoxia risk group were associated with signaling pathways of cell cycle, MAPK, mTOR, PI3K-Akt, VEGF, and AMPK.
Conclusion
The hypoxia risk model could serve as an independent prognostic indicator and reflect overall immune response intensity in the OC microenvironment.
1. Introduction
Ovarian cancer (OC) is characterized by relatively high incidence, high mortality rate, and poor prognosis [1, 2]. Poor differentiation of tumor, higher stage of disease, the presence of residual disease after cytoreductive surgery, older age, smoking, excessive weight, and lack of physical activity are associated with the poor prognosis of OC [3–7]. While the majority of patients initially respond well to chemotherapy, some patients relapse and become chemoresistant [8, 9]. Therefore, the identification of potential predictors that improve the prognosis for women diagnosed with OC may have clinical importance.
Under hypoxic conditions, tumor cells adapt by generating energy in oxygen-independent ways by inducing the expression of genes involved in tumor progression [10]. Additionally, hypoxia can increase the resistance to radiotherapy and chemotherapy and lead to the decline of cell immunity [11–13]. Moreover, hypoxic environment is significantly related to the poor prognosis in patients with OC [14]. Up to now, the detailed mechanisms by which hypoxia regulates the status of OC cells resulting in physiological changes remain unclear. Hence, exploring the effect of hypoxia on OC may offer opportunities for potential therapeutic purposes. Nowadays, cancer immunotherapy can target the cells of the immune system [15]. A detailed understanding of the interactions between cancer, hypoxia, and the immune system may be vital for the recognition of potential new immunotherapeutic strategies and targets for OC patients. In this study, we tried to use gene expression data to develop a hypoxia risk model to predict the immune microenvironment in OC patients.
2. Materials and Methods
2.1. Dataset Sources and Preprocessing
Firstly, the RNA sequencing data for gene expression (FPKM value) and clinical information were downloaded from UCSC Xena in The Cancer Genome Atlas (TCGA) dataset as a training cohort. The FPKM value was then converted to a transcript of millions per kilobase (TPM) value. Secondly, the gene expression data were downloaded from GSE17260 and GSE32062 datasets in the Gene Expression Omnibus (GEO) database as a validation set. Patient characteristics of the above three cohorts are shown in Table 1. The average value of multiple probes corresponding to the same gene was used as its expression quantity to obtain the gene expression matrix file. The “SVA” software package in R language was used for batch normalization of expression data to obtain a standardized gene expression matrix file. The detailed information of the above datasets is shown in Table 2. A list of hypoxia-related genes was obtained from Hallmark gene sets [16] of the Molecular Signatures Database. Totally, 191 genes were included, all of which responded to low oxygen levels.
Table 1.
Patient characteristics of three cohorts.
| TCGA | GSE17260 | GSE32062 | |
|---|---|---|---|
| Number of patients | 378 | 110 | 260 |
| Age (median, range) | 59 (30–87) | NA | NA |
| Grade (%) | |||
| Grade 1 | 1 (0.26%) | 26 (23.64%) | NA |
| Grade 2 | 45 (11.90%) | 41 (37.27%) | 131 (50.38%) |
| Grade 3 | 321 (84.92%) | 43 (39.09%) | 129 (49.62%) |
| Grade 4 | 1 (0.26%) | NA | NA |
| Unknown | 10 (2.65%) | NA | NA |
| Stage (%) | |||
| I | 1 (0.26%) | NA | NA |
| II | 23 (6.08%) | NA | NA |
| III | 294 (77.78%) | 93 (84.55%) | 204 (78.46%) |
| IV | 57 (15.08%) | 17 (15.45%) | 56 (21.54%) |
| Unknown | 3 (0.79%) | NA | NA |
| Lymphatic invasion | |||
| Yes | 101 (26.72%) | NA | NA |
| No | 48 (12.70%) | NA | NA |
| Unknown | 229 (60.58%) | NA | NA |
| Venous invasion | |||
| Yes | 64 (16.93%) | NA | NA |
| No | 41 (10.85%) | NA | NA |
| Unknown | 273 (72.22%) | NA | NA |
| OS days (median) | 1024 | 915 | 1245 |
OS: overall survival; NA: not applicable.
Table 2.
Basic information of all datasets.
| Accession number | Platform | Number of patients | Survival data |
|---|---|---|---|
| TCGA | Illumina RNA-seq | OC = 378 | OS |
| GSE17260 | Agilent-014850 Whole Human Genome Microarray 4 × 44K G4112F | OC = 110 | OS |
| GSE32062 | Agilent-014850 Whole Human Genome Microarray 4 × 44K G4112F | OC = 260 | OS |
OC: ovarian cancer; OS: overall survival.
2.2. Construction and Verification of Hypoxic Gene Signature
The analysis method was referred to the previous literature [17]. In the training cohort, the prognosis-related hypoxic genes were identified by univariate Cox regression analysis and lasso regression analysis. p < 0.01 was considered statistically significant. The hypoxic gene signature for predicting the prognosis of OC patients was constructed through Cox and lasso regression analyses by using the “glmnet” software package in R language. In the analysis, the lasso penalty was applied. At the same time, shrinkage and variable selection were taken into account. The composition of the final gene signature was selected to generate the risk score based on the following formula:
| (1) |
The cases were divided into two groups (high risk and low risk) based on the risk score median. In addition, the same formula was used to calculate the risk score in the validation set.
2.3. Survival Analysis
Overall survival (OS) was compared between the high hypoxia risk group and the low hypoxia risk group via Kaplan–Meier analysis. The multivariate Cox regression analysis was used to determine risk score as an independent risk factor for OS in OC. The receiver operating characteristic (ROC) curve was generated to validate the accuracy of the risk model in predicting the patients' OS via the “timeROC” software package in R language.
2.4. Gene Set Enrichment Analysis (GSEA)
Underlying mechanisms were studied through gene set enrichment analysis (GSEA) [18] with the Java program in the TCGA dataset. The adjusted p value was calculated by using the method of Benjamini–Hochberg false discovery rate (FDR). The FDR value of ≤0.05 of the enriched gene set was considered to be statistically significant.
2.5. Estimation of Tumor Immune Microenvironment (TIME) Cell Infiltration
The single-sample gene set enrichment analysis (ssGSEA) algorithm was used to quantify the relative abundance of TIME cell infiltration in each OC sample. The gene set for marking each TIME infiltration immune cell type was obtained from the previous study [19, 20]. The enrichment scores (calculated by ssGSEA) were used to represent the relative abundance of each TIME infiltrating cell in each sample. The immune score, matrix score, purity of tumor, and ESTIMATE score were calculated [21]. The violin plot and boxplot were used to compare the levels of immune cell infiltration and immune score between the high and low hypoxia risk groups.
2.6. Expression Analysis of Genes That Negatively Regulated the Cancer Immune Cycle
Cancer immune cycle describes a cycle of processes involved in the eradication of cancer by the immune system [22]. In this study, the gene signature was downloaded from the Tracking Tumor Immunophenotype website [23] to study the gene expression that negatively regulated the cancer immune cycle between the high and low hypoxia risk groups.
2.7. Analysis of Immune Checkpoint and Somatic Mutation
To further clarify the potential association between TIME hypoxia and clinical immunotherapy, the expression of 6 immune checkpoints including PDCD1 (PD1), CD274 (PDL1), PDCD1LG2 (PDL2), CTLA4, CD80, and CD86 were analyzed in the high hypoxia risk group and low hypoxia risk group. In addition, somatic mutation analysis was performed to identify mutation status in the high and low hypoxia risk groups. The somatic mutation data of OC patients were downloaded from the TCGA dataset. The numbers of variant types and classifications were visualized with Oncoplot.
2.8. In Vitro Expression Analysis of Hypoxic Gene Signature
In order to study the expression of hypoxic gene signature at the mRNA level, the RT-qPCR was performed in tissue samples. Totally, 5 patients with OC were enrolled. The inclusion criteria of the enrolled OC patients were as follows: (1) patients were diagnosed with OC, which was confirmed by pathological examination; (2) patients received no radiation, chemotherapy, immunotherapy, or molecular targeted therapy prior to diagnosis; (3) patients had no other malignant tumors and autoimmune diseases; and (4) age of patients ranging from 18 to 70. The exclusion criteria were as follows: (1) patients had other malignant tumors; (2) patients received preoperative adjuvant chemotherapy, radiotherapy, or targeted therapy; (3) patients had incomplete clinical data; and (4) patients had a history of cancer. Tumor tissue samples and adjacent tissue samples were collected from 5 OC patients. Tissue samples and clinical data were collected with informed consent of patients. This study was approved by the Ethics Committee of The Second Affiliated Hospital of Xi'an Jiaotong University (2021241).
Total RNA of the samples was extracted using the TRIzol® reagent. Then, RT-qPCR was performed in an ABI 7300 RT-qPCR system with SuperReal PreMix Plus. Relative gene expressions were analyzed by the 2-△△ct method and represented as fold change (compared with healthy control). Fold change >1 and fold change <1 represented upregulation and downregulation, respectively. GAPDH and ACTB were used for internal reference.
2.9. Statistical Analysis
All statistics were performed using the R software. Wilcoxon test was used to identify differentially expressed genes and infiltrating immune cells. In addition, the Wilcoxon test was used to screen for differentially expressed infiltrating immune cells and to analyze statistical differences in the expression of risk scores in different clinical features. Kaplan–Meier curves were plotted, and a log-rank test was used to check the significant difference in OS between the high and low hypoxia risk groups. The t-test was used to test the significant difference in hypoxic gene expression between the high and low hypoxia risk groups. The value of p less than 0.05 was set as statistically significant.
3. Results
3.1. Construction of Hypoxic Gene Signature Prognostic Model in OC
The prognostic role of 191 hypoxic genes in OC patients was investigated. Based on the univariate Cox regression analysis, 9 hypoxia-related genes were significantly related to patients' OS (Figure 1(a)). In the lasso and Cox regression analyses, 8 hypoxia-related genes were chosen to build the predictive model consisting of A-kinase anchoring protein 12 (AKAP12), aldolase, fructose-bisphosphate C (ALDOC), angiopoietin-like 4 (ANGPTL4), Cbp/p300 interacting transactivator with Glu/Asp-rich carboxy-terminal domain 2 (CITED2), interferon-stimulated exonuclease gene 20 (ISG20), protein phosphatase 1 regulatory subunit 15A (PPP1R15A), peroxiredoxin 5 (PRDX5), and transforming growth factor beta-induced protein (TGFBI) (Figures 1(b) and 1(c)).
Figure 1.
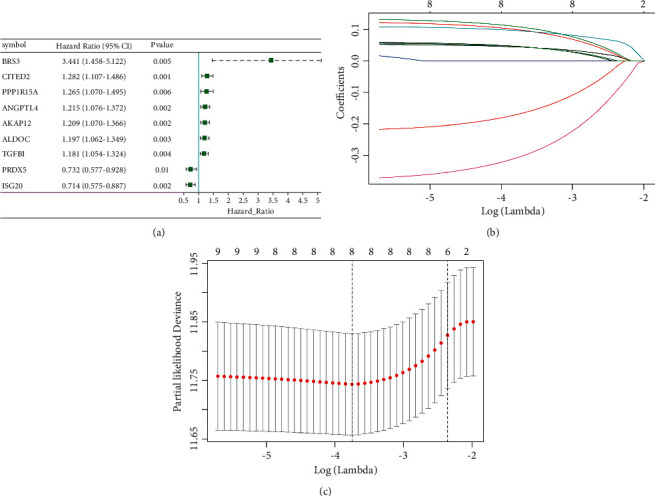
Construction of hypoxic gene signature prognostic model in OC. (a) The forest map of univariate Cox regression analysis results of hypoxia gene. (b) The coefficient profile plot. (c) Optimal parameter (lambda) selection in the lasso model used tenfold cross-validation via minimum criteria.
3.2. Prognostic Value of the Hypoxia Risk Signature in OC
The risk scores of the training and validation cohorts were calculated using the coefficients obtained by the lasso algorithm. Patients were divided into high and low hypoxia risk groups. The distribution of the risk scores, OS, OS status, and expression profiles of the 8 hypoxic gene signature in the training cohort and validation cohort is displayed in Figures 2(a) and 2(b). Heat map results showed that 6 hypoxic genes, including AKAP12, ALDOC, ANGPTL4, CITED2, PPP1R15A, and TGFBI, were highly expressed in the high hypoxia risk group, which indicated that patients in the group tended to develop hypoxic microenvironments. The mortality was significantly higher in the high hypoxia risk group. The OS of the high hypoxia risk group was shorter in the training and validation cohorts (Figures 2(c) and 2(d)).
Figure 2.
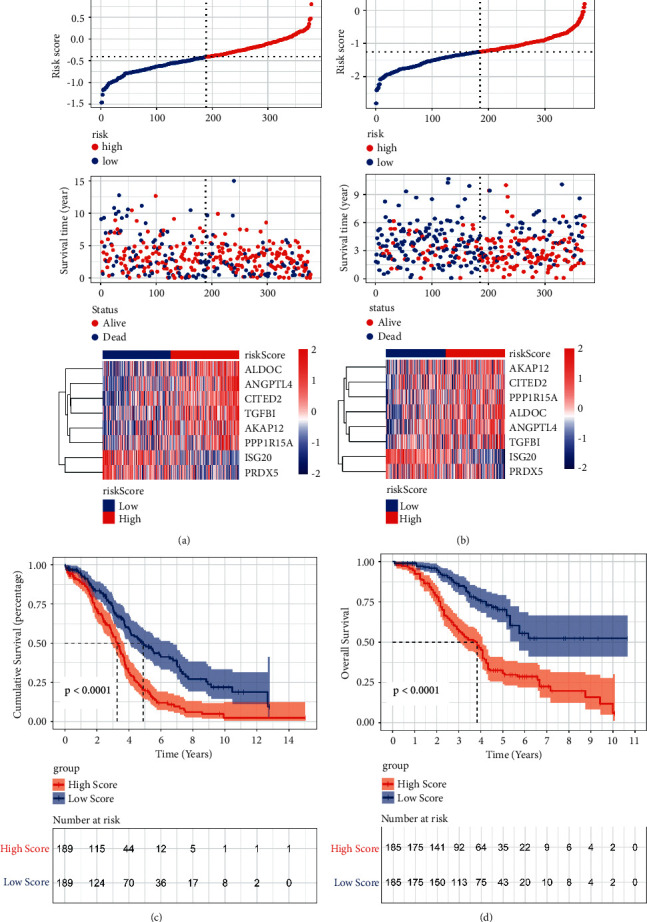
Construction and validation of prognostic hypoxia risk signature in OC. (a) Distribution of risk score, OS, and OS status and heatmap of the 8 prognostic hypoxia risk gene signature in the training cohort; (b) distribution of risk score, OS, and OS status and heatmap of the 8 prognostic hypoxia risk gene signature in the validation cohort; (c) Kaplan–Meier curves of OS for OC patients based on the risk score in the training cohort; (d) Kaplan–Meier curves of OS for OC patients based on the risk score in the validation cohort.
3.3. Strong Power of Hypoxia Risk Signature for Prognosis Assessment in OC
To evaluate the predictive efficiency of the hypoxia risk signature in the 1-, 3-, and 5-year survival rates, the ROC curve was performed. The AUC was 0.67 at 1 year, 0.64 at 3 years, and 0.71 at 5 years, respectively, indicating a high predictive value (Figure 3(a)). This was further validated in the validation cohort (Figure 3(b)). This indicated that patients with high risk score could develop hypoxia tumor microenvironment. The univariate analysis suggested that high hypoxia risk score was significantly associated with poor OS (Figure 3(c)). Multivariate analysis showed that high hypoxia risk score was significantly related to poorer OS of OC patients (Figure 3(d)). These were validated in the validation cohort (Figures 3(e) and 3(f)). In addition, the relationship between the hypoxia signature and clinical parameters (such as age, grade, stage, therapy outcome, lymphatic invasion, and venous invasion) is shown in Figure 4. The risk score for grade III/IV was significantly higher than that for grade I/II. The risk score of G3/4 was significantly higher than that of G1/2. In therapy outcome, the risk score of PD/SD was significantly higher than that of CR/PR.
Figure 3.
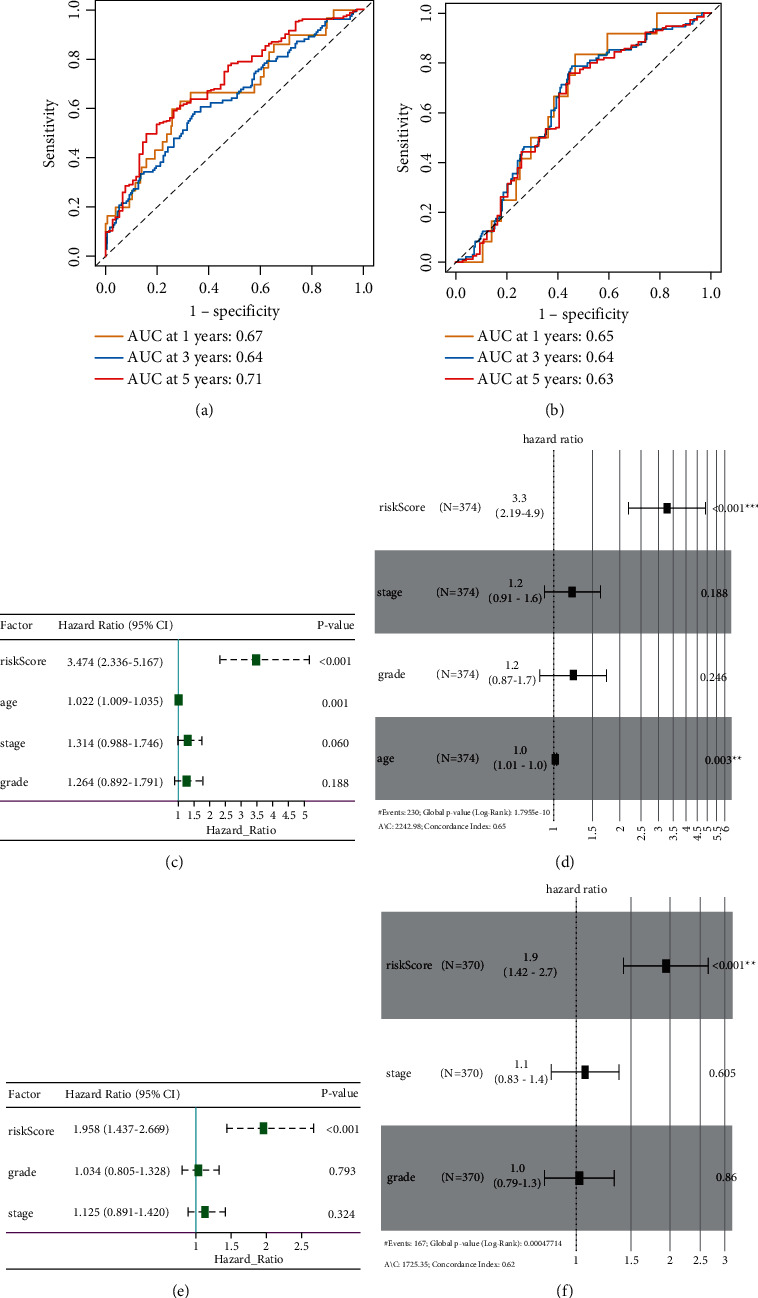
Prognostic value of the hypoxia risk signature in OC. (a, b) ROC curves showing the predictive efficiency of the hypoxia risk signature; (c–f) univariate and multivariate Cox analyses of the hypoxia signature.
Figure 4.
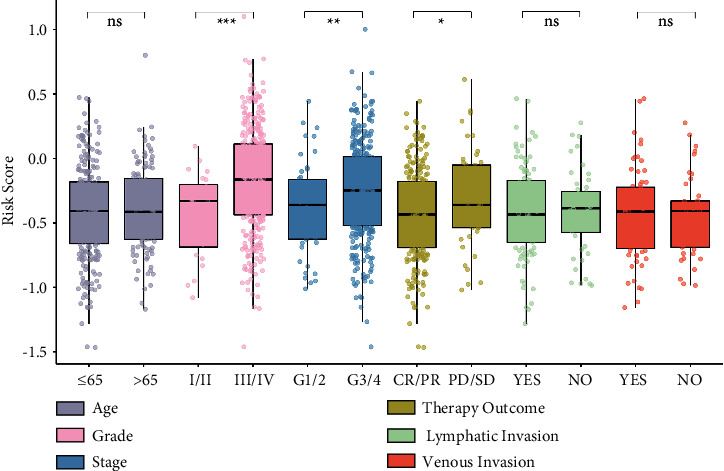
The relationship between the hypoxia signature and clinical parameters. ∗p < 0.05; ∗∗p < 0.01; ∗∗∗p < 0.001.
3.4. Identification of Hypoxia-Related Signaling Pathways in OC
GSEA results showed that processes associated with stimulating tumor proliferation and antiapoptosis were significantly enriched in the high hypoxia risk group (Figure 5), including cell cycle, MAPK signaling pathway, mTOR signaling pathway, PI3K-Akt signaling pathway, VEGF signaling pathway, and AMPK signaling pathway.
Figure 5.
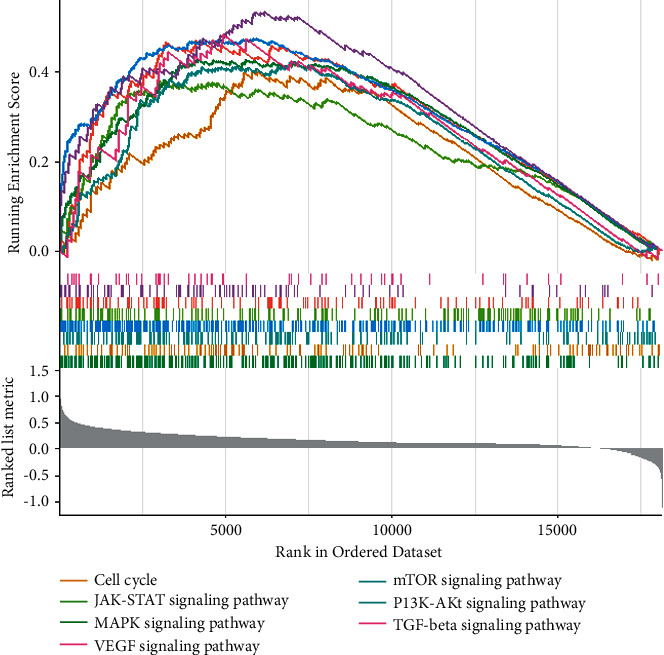
Enrichment plots of activated signaling pathways in the high hypoxia risk group.
3.5. Immunity Analysis between High and Low Hypoxia Risk Groups in OC
The ability to assess hypoxia risk signals in the immune microenvironment was investigated through ssGSEA. Patients at high risk of hypoxia had significantly higher percentages of cells (such as plasmacytoid dendritic cell and regulatory T cell) and significantly lower percentages of activated dendritic cell, type 17 T helper cell, and natural killer cell (Figures 6(a), 6(b)). This suggested that immunosuppressive cells may drive the immunosuppressive microenvironment. The results of the ESTIMATE algorithm also confirmed that the immune score (Figure 6(c)) and matrix score (Figure 6(d)) were significantly lower in patients with high hypoxia. The tumor purity was significantly higher in patients with low hypoxia (Figure 6(e)).
Figure 6.
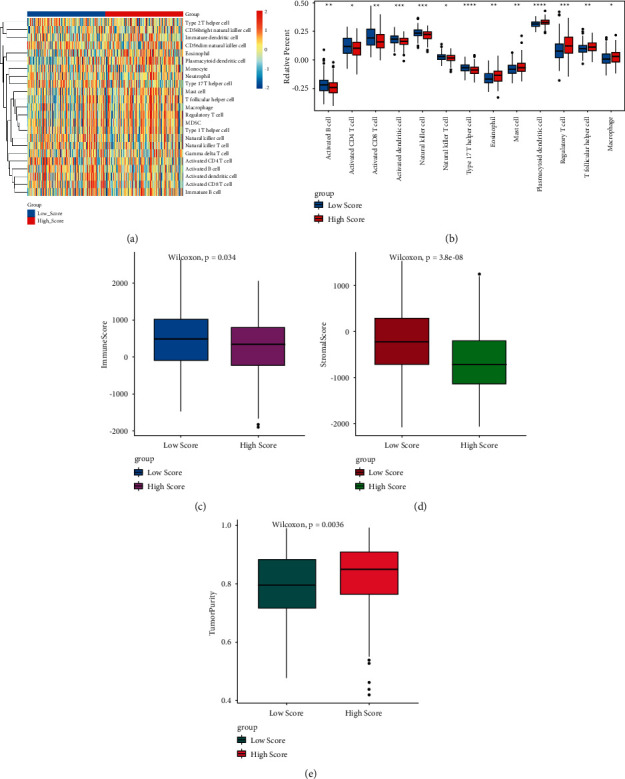
Immunity analysis between the high and low hypoxia risk groups. (a) All the immune cells; (b) differential immune cells; (c) immune score; (d) matrix score; (e) tumor purity.
3.6. A High Risk Score Indicates the Immunosuppressive Microenvironment in OC
The gene signature that negatively regulated cancer immune cycle was downloaded from the website “Tracking Tumor Immunophenotype.” The results showed that most of these genes, such as arginase 1 (ARG1), CD 160 molecule (CD160), CD 244 molecule (CD244), C-X-C motif chemokine ligand 12 (CXCL12), DNA methyltransferase 1 (DNMT1), and hepatitis A virus cellular receptor 1 (HAVCR1), were upregulated in the high hypoxia risk group (Figure 7).
Figure 7.
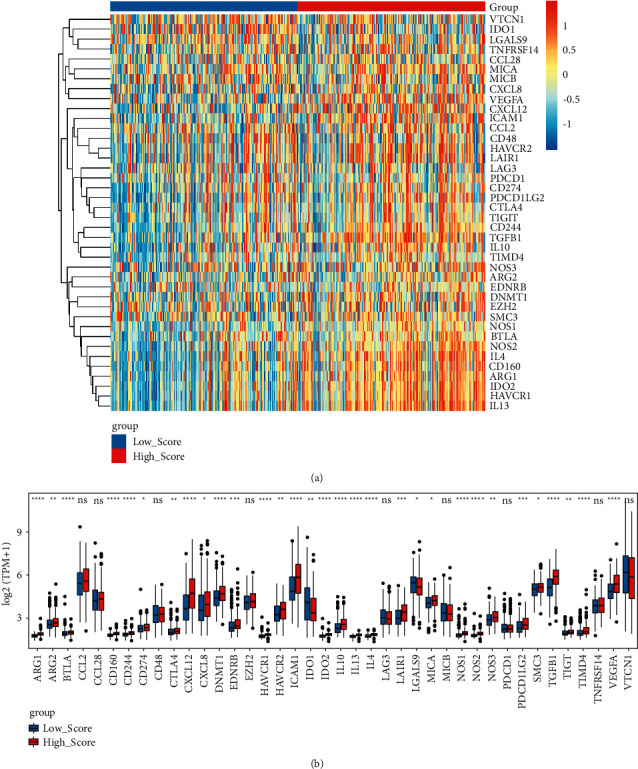
Expression of genes that negatively regulated cancer immune cycle in the high and low hypoxia risk groups. (a) Heat maps of genes that negatively regulated cancer immune cycle in the high and low hypoxia risk groups; (b) boxplots of genes that negatively regulated cancer immune cycle in the high and low hypoxia risk groups.
3.7. Analysis of Expression Patterns and Mutation Types of Immune Checkpoints in OC
The expression of immune checkpoints was investigated in the high and low hypoxia risk groups. The results showed that the expression of most immune checkpoints, such as CD80 molecule (CD80), cytotoxic T-lymphocyte-associated protein 4 (CTLA4), and cd274 molecule (CD274), were significantly higher in the high hypoxia risk group (Figure 8(a)), which was validated in the validation cohort (Figure 8(b)). These results suggested that the immune microenvironment in the high hypoxia risk group was suppressed by upregulating immunosuppressive cytokines and immune checkpoints. In addition, the difference in gene mutation frequency was analyzed between the high and low hypoxia risk groups (Figure 9). The mutation frequency of ALDOC, ANGPTL4, and PPP1R15A was slightly higher in the high hypoxia risk group (1%) compared with that in the low hypoxia risk group (did not show any mutations). This suggested that mutation of these genes may be associated with hypoxia.
Figure 8.
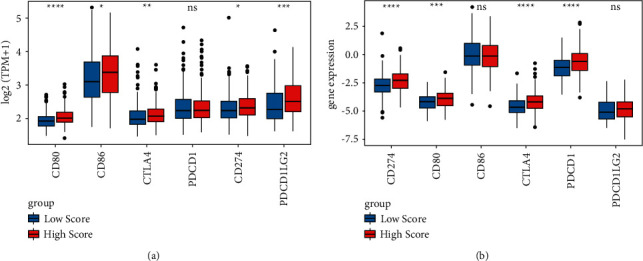
Expression of immune checkpoints in the high and low hypoxia risk groups. (a) In the training cohort; (b) in the validation cohort.
Figure 9.
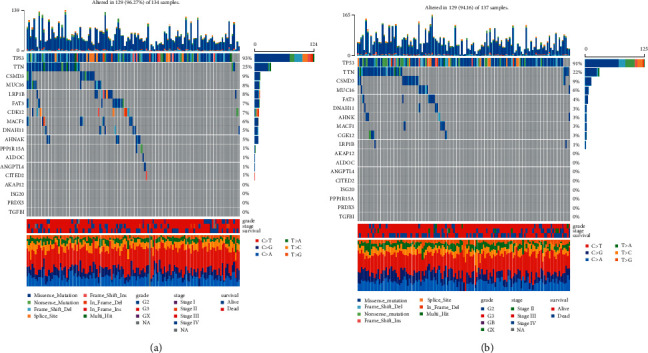
The waterfall plot of tumor somatic mutation established by mutations. (a) High hypoxia risk group; (b) low hypoxia risk group. Each column represents individual patients. The upper barplot shows tumor mutation burden, and the number on the right indicates the mutation frequency in each gene. The right barplot shows the proportion of each variant type.
3.8. RT-qPCR
The tumor tissues from 5 patients with OC were used to test the expression of hypoxic gene signature. The clinical information of these patients is shown in Table 3. In addition, the sequence of the primers used for the RT-qPCR is listed in Table 4. The results showed that ALDOC, CITED2, ISG20, and PRDX5 were significantly upregulated, AKAP12, ANGPTL4, and PPP1R15A were remarkably downregulated, and TGFBI was downregulated without significant difference (Figure 10). This suggested that the expression level of these genes in tumor tissue was different from that under the hypoxic tumor environment.
Table 3.
The clinical information of enrolled patients in intro validation.
| Number | Age | Height (cm) | Weight (kg) | Tumor size (cm) |
|---|---|---|---|---|
| 1 | 58 | 156 | 54 | 1 |
| 2 | 62 | 157 | 59 | 10 |
| 3 | 70 | 159 | 50 | 8 |
| 4 | 73 | 168 | 46 | 20 |
| 5 | 56 | 165 | 53 | 10 |
Table 4.
The sequence of the primers used for the RT-qPCR.
| Primer name | Primer sequences (5′ to 3′) | Size (bp) |
|---|---|---|
| GAPDH-F (internal reference) | CTGGGCTACACTGAGCACC | 101 |
| GAPDH-R (internal reference) | AAGTGGTCGTTGAGGGCAATG | |
| ACTB-F (internal reference) | GATCAAGATCATTGCTCCTCCT | 108 |
| ACTB-R (internal reference) | TACTCCTGCTTGCTGATCCA | |
| AKAP12-F | AGAGGTTGCCTCCGAGAAACT | 185 |
| AKAP12-R | CAAACACTTCTGTCGCCAACG | |
| ALDOC-F | CGCAGCCTCATTTACCAGA | 165 |
| ALDOC-R | GCTCCTTCCAAGGCTTCAG | |
| ANGPTL4-F | GGCTCAGTGGACTTCAACCG | 103 |
| ANGPTL4-R | CCGTGATGCTATGCACCTTCT | |
| CITED2-F | ACAAACCAGCACTTCCGAGAT | 212 |
| CITED2-R | TCTATGACATTGGGCGGCAG | |
| ISG20-F | CGACAAGTTCATCCGGCCT | 176 |
| ISG20-R | GCCACAACAGCCTGTCAGT | |
| PPP1R15A-F | ATGATGGCATGTATGGTGAGC | 120 |
| PPP1R15A-R | AACCTTGCAGTGTCCTTATCAG | |
| PRDX5-F | GCAAGACGGTGCAGTGAAG | 98 |
| PRDX5-R | ATGGCATCTCCCACCTTGATT | |
| TGFBI-F | CTTCGCCCCTAGCAACGAG | 155 |
| TGFBI-R | TGAGGGTCATGCCGTGTTTC |
Figure 10.

Expression of detection of hypoxic gene signature by RT-qPCR. ∗p < 0.05; ∗∗p < 0.01.
4. Discussion
In the present study, we developed a risk model consisted of 8 hypoxia-associated genes in OC. Among which, AKAP12, ALDOC, ANGPTL4, CITED2, PPP1R15A, and TGFBI were highly expressed, whereas ISG20 and PRDX5 were lowly expressed in the high hypoxia risk patients. The upregulation of AKAP12 is related to poor survival of colorectal cancer [24]. It is suggested that AKAP12 plays a crucial role in ovarian granulosa cells and is involved in invasion and metastasis in OC [25–27]. Elevated AKAP12 transcript expression is related to poor survival in patients with ovarian cancer and high-grade serous ovarian carcinomas [28–30]. ALDOC, a glycolytic enzyme, is known to be upregulated by hypoxia. In OC, increased mRNA expression of ALDOC fuels the tricarboxylic acid cycle and promotes sustained mitochondrial respiration [31]. ANGPTL4, an immune gene, has important functions in lipid and glucose metabolism [32, 33]. ANGPTL4 is activated by hypoxia-inducible factor-1α (HIF-1α) and confers protection against hypoxia-induced apoptosis [34]. It is demonstrated that ANGPTL4 is overexpressed in OC and related to shorter relapse-free survival times in serous OC [35–37]. In addition, ANGPTL4 is significantly related to the poor prognosis of patients with non-small-cell lung cancer, lung adenocarcinoma, and cervical cancer [38–40]. CITED2 is significantly enriched in regulatory T cells and granulosa cells [41, 42]. It is reported that CITED2 is associated with primary ovarian insufficiency [43]. Upregulation of CITED2 is related to shorter recurrence times in serous ovarian tumors [44]. It is shown that TGFBI functions as a tumor promoter in OC [31]. It is reported that TGFBI is related to an extracellular matrix signature and is implicated in poor prognosis and drug resistance in OC [45–48]. Overexpression of TGFBI is related to poor prognosis in cervical cancer [49]. ISG20, an immune-related gene, is downregulated in small atretic follicles with respect to healthy follicles [50]. The expression level of ISG20 is lower in tumor tissues of OC and is associated with the prognosis of OC [51, 52]. PRDX5 can be used to predict poor progression-free survival for OC patients [53]. Our results suggested that the above 8 hypoxia-associated gene risk model could be used as an independent prognostic factor for OC patients, which may represent a convenient detection in clinic.
In OC, regulatory T cells play roles in reducing survival [54]. In the TIME, the presence of immature plasmacytoid dendritic cells is associated with the poor clinical outcome in patients with breast cancer and epithelial OC [55, 56], which indicates that plasmacytoid dendritic cells could play roles in establishing the TIME mediated by forkhead box P3 (Foxp3)+ regulatory T cells. Activated dendritic cells can boost the patients' immune system to fight against cancer [57, 58]. In this study, we found that patients with high hypoxia risk had significantly higher proportions of regulatory T-cell and plasmacytoid dendritic cell phenotypes. Besides, activated dendritic cells were decreased in the high hypoxia group. In addition, the immune score and matrix score were significantly lower in patients with high hypoxia. Our results showed that the hypoxia risk model could predict the immune microenvironment in OC.
Identification of immunosuppressive factors produced within the TIME and the ability to target these factors can enhance antitumor immune responses. The expression of ARG1 in immune cells is a potent suppressor of antitumor T cells [59]. CD160 is significantly upregulated in OC [60]. CD244 is an exhaustion marker of T cells in OC [61]. Hypoxia induces the expression of CXCL12 in primary human ovarian tumor cells [62]. It is suggested that CXCL12 is an independent predictor of poor survival in OC [63]. Overexpression of DNMT1 contributes to gene promoter hypermethylation and is associated with the malignant potential and poor prognosis of breast cancer [64, 65]. HAVCR1 serves as the marker for ovarian clear cell carcinoma susceptibility [66]. In the present study, the above immunosuppressive cytokines were upregulated in the high hypoxia risk group, which further promoted immunosuppression in OC.
The immune checkpoint inhibitor-based antibody has improved survival for patients with various cancer types, such as lung cancer, malignant melanoma, and bladder cancer [67]. High levels of CD80 contribute to the maintenance of tolerance and immunosuppression in epithelial OC [68]. The OC microenvironment can induce migration of CTLA4+ regulatory T cells via C-C motif chemokine ligand 22 (CCL22) and C-C motif chemokine receptor 4 (CCR4) [54, 69]. CTLA4 immunotherapy has shown an optimistic antitumor effect in OC [70]. PD-L1 interacts with the corresponding receptor, inhibits the antitumor activity of immune cells, and allows cancer cells to escape immune surveillance [71]. Drug-resistant OC cells exhibit repression of immune-stimulatory molecules, with concomitant augmented expression of CD274 [72]. In this study, we found that the above immune checkpoints including CD80, CTLA4, and CD274 were all upregulated in the high hypoxia risk group, which indicated these immune checkpoints play an important immunosuppression action in OC.
Based on functional analysis, we found that gene sets associated with the high hypoxia risk group were involved in signaling pathways of cell cycle, MAPK, mTOR, PI3K-Akt, JAK-STAT, VEGF, TGF-beta, and AMPK. Genes involved in cell cycle play a key role in OC development and prognosis [73]. In in vitro conditions, induction of CD8+ regulatory T cell is critically mediated by the activation of p38MAPK in OC immunotherapy [74]. The mTOR pathway is found to be activated in about half of patients with high-grade serous OC [75]. The PI3K-Akt signaling pathway plays crucial roles in the process of mesenchymal stem cells induced by hypoxia [76]. Activation of the PI3K/Akt/mTOR pathways is found in OC [77]. VEGF, an important angiogenic factor in advanced OC, is related to tumor aggression and the poor prognosis of OC [78, 79]. AMPK protects living cells from hypoxia, which results in elevations in the cellular AMP/ATP ratio [80–82]. It is found that AMPK subunits are generally upregulated in OC [83]. Our results indicated that the above signaling pathways may play important roles in the low oxygen environment of OC.
CA: carcinoma antigen; HE4: rabbit anti-human HE4 antibody.
5. Conclusions
We developed and validated a risk model based on 8 hypoxia-associated genes, which could serve as an independent prognostic factor for OC patients and reflect the overall intensity of the immune response in the OC microenvironment. Our study may offer a novel understanding of how hypoxia status affects prognosis and the TIME in OC and benefits future hypoxia-targeted therapies. However, there are limitations to our study. More molecular investigation in the experimental model is further needed.
Acknowledgments
This study was funded by the Natural Science Basic Research Program of Shanxi Province (2019JZ-46) and Xi'an Science and Technology Planning Project (201805098YX6SF32(4)).
Data Availability
All data are available in the article.
Conflicts of Interest
The authors declare that there are no conflicts of interest regarding the publication of this study.
References
- 1.Goff B. A. Ovarian cancer. Obstetrics & Gynecology Clinics of North America . 2012;39(2):183–194. doi: 10.1016/j.ogc.2012.02.007. [DOI] [PubMed] [Google Scholar]
- 2.Momenimovahed Z., Tiznobaik A., Taheri S., Salehiniya H. Ovarian cancer in the world: epidemiology and risk factors. International Journal of Women’s Health . 2019;11:287–299. doi: 10.2147/ijwh.s197604. [DOI] [PMC free article] [PubMed] [Google Scholar]
- 3.Cannioto R. A., LaMonte M. J., LaMonte M. J., et al. Recreational physical inactivity and mortality in women with invasive epithelial ovarian cancer: evidence from the Ovarian Cancer Association Consortium. British Journal of Cancer . 2016;115(1):95–101. doi: 10.1038/bjc.2016.153. [DOI] [PMC free article] [PubMed] [Google Scholar]
- 4.Præstegaard C., Jensen A., Jensen S. M., et al. Cigarette smoking is associated with adverse survival among women with ovarian cancer: results from a pooled analysis of 19 studies. International Journal of Cancer . 2017;140(11):2422–2435. doi: 10.1002/ijc.30600. [DOI] [PMC free article] [PubMed] [Google Scholar]
- 5.Nagle C. M., Dixon S. C., Dixon S. C., et al. Obesity and survival among women with ovarian cancer: results from the Ovarian Cancer Association Consortium. British Journal of Cancer . 2015;113(5):817–826. doi: 10.1038/bjc.2015.245. [DOI] [PMC free article] [PubMed] [Google Scholar]
- 6.Nagle C. M., Bain C. J., Webb P. M. Cigarette smoking and survival after ovarian cancer diagnosis. Cancer Epidemiology Biomarkers & Prevention . 2006;15(12):2557–2560. doi: 10.1158/1055-9965.epi-06-0592. [DOI] [PubMed] [Google Scholar]
- 7.Protani M. M., Nagle C. M., Webb P. M. Cancer Prevention Research . 7. Vol. 5. Philadelphia, Pa: 2012. Obesity and ovarian cancer survival: a systematic review and meta-analysis; pp. 901–910. [DOI] [PubMed] [Google Scholar]
- 8.Holschneider C. H., Berek J. S. Ovarian cancer: epidemiology, biology, and prognostic factors. Seminars in Surgical Oncology . 2000;19(1):3–10. doi: 10.1002/1098-2388(200007/08)19:1<3::aid-ssu2>3.0.co;2-s. [DOI] [PubMed] [Google Scholar]
- 9.Thigpen T., Brady M. F., Omura G. A., et al. Age as a prognostic factor in ovarian carcinoma: the gynecologic oncology group experience. The Gynecologic Oncology Group experience. Cancer . 1993;71(S2):606–614. doi: 10.1002/cncr.2820710218. [DOI] [PubMed] [Google Scholar]
- 10.Dang C. V., Semenza G. L. Oncogenic alterations of metabolism. Trends in Biochemical Sciences . 1999;24(2):68–72. doi: 10.1016/s0968-0004(98)01344-9. [DOI] [PubMed] [Google Scholar]
- 11.Lee C.-T., Mace T., Repasky E. A. Hypoxia-driven immunosuppression: a new reason to use thermal therapy in the treatment of cancer? International Journal of Hyperthermia . 2010;26(3):232–246. doi: 10.3109/02656731003601745. [DOI] [PMC free article] [PubMed] [Google Scholar]
- 12.Semenza G. L. Hypoxia-inducible factors: mediators of cancer progression and targets for cancer therapy. Trends in Pharmacological Sciences . 2012;33(4):207–214. doi: 10.1016/j.tips.2012.01.005. [DOI] [PMC free article] [PubMed] [Google Scholar]
- 13.Chouaib S., Messai Y., Couve S., Escudier B., Hasmim M., Noman M. Z. Hypoxia promotes tumor growth in linking angiogenesis to immune escape. Frontiers in Immunology . 2012;3:p. 21. doi: 10.3389/fimmu.2012.00021. [DOI] [PMC free article] [PubMed] [Google Scholar]
- 14.Ai Z., Lu Y., Qiu S., Fan Z. Overcoming cisplatin resistance of ovarian cancer cells by targeting HIF-1-regulated cancer metabolism. Cancer Letters . 2016;373(1):36–44. doi: 10.1016/j.canlet.2016.01.009. [DOI] [PMC free article] [PubMed] [Google Scholar]
- 15.Coosemans A., Baert T., Vergote I. A view on dendritic cell immunotherapy in ovarian cancer: how far have we come? Facts, views & vision in ObGyn . 2015;7(1):73–78. [PMC free article] [PubMed] [Google Scholar]
- 16.Bray F., Ferlay J., Soerjomataram I., Siegel R. L., Torre L. A., Jemal A. Global cancer statistics 2018: GLOBOCAN estimates of incidence and mortality worldwide for 36 cancers in 185 countries. CA: A Cancer Journal for Clinicians . 2018;68(6):394–424. doi: 10.3322/caac.21492. [DOI] [PubMed] [Google Scholar]
- 17.Lin W., Wu S., Chen X., et al. Characterization of hypoxia signature to evaluate the tumor immune microenvironment and predict prognosis in glioma groups. Frontiers in oncology . 2020;10:p. 796. doi: 10.3389/fonc.2020.00796. [DOI] [PMC free article] [PubMed] [Google Scholar]
- 18.Subramanian A., Tamayo P., Mootha V. K., et al. Gene set enrichment analysis: a knowledge-based approach for interpreting genome-wide expression profiles. Proceedings of the National Academy of Sciences . 2005;102(43):15545–15550. doi: 10.1073/pnas.0506580102. [DOI] [PMC free article] [PubMed] [Google Scholar]
- 19.Natalia P., Stephanie S., Justin J.-L. W. Aberrant expression of enzymes regulating m6A mRNA methylation: implication in cancer. Cancer Biology & Medicine . 2018;15(4):323–334. doi: 10.20892/j.issn.2095-3941.2018.0365. [DOI] [PMC free article] [PubMed] [Google Scholar]
- 20.Tong J., Cao G., Zhang T., et al. m6A mRNA methylation sustains Treg suppressive functions. Cell Research . 2018;28(2):253–256. doi: 10.1038/cr.2018.7. [DOI] [PMC free article] [PubMed] [Google Scholar]
- 21.Yoshihara K., Shahmoradgoli M., Martínez E., et al. Inferring tumour purity and stromal and immune cell admixture from expression data. Nature Communications . 2013;4(1):p. 2612. doi: 10.1038/ncomms3612. [DOI] [PMC free article] [PubMed] [Google Scholar]
- 22.Chen D. S., Mellman I. Oncology meets immunology: the cancer-immunity cycle. Immunity . 2013;39(1):1–10. doi: 10.1016/j.immuni.2013.07.012. [DOI] [PubMed] [Google Scholar]
- 23.Xu L., Deng C., Pang B., et al. TIP: a web server for resolving tumor immunophenotype profiling. Cancer Research . 2018;78(23):6575–6580. doi: 10.1158/0008-5472.can-18-0689. [DOI] [PubMed] [Google Scholar]
- 24.Martinez-Romero J., Bueno-Fortes S., Martín-Merino M., Ramirez de Molina A., De Las Rivas J. Survival marker genes of colorectal cancer derived from consistent transcriptomic profiling. BMC Genomics . 2018;19(S8):p. 857. doi: 10.1186/s12864-018-5193-9. [DOI] [PMC free article] [PubMed] [Google Scholar]
- 25.Erlichman J., Gutierrez-Juarez R., Zucker S., Mei X., Orr G. A. Developmental expression of the protein kinase C substrate/binding protein (clone 72/SSeCKS) in rat testis. Identification as a scaffolding protein containing an A-kinase-anchoring domain which is expressed during late-stage spermatogenesis. European Journal of Biochemistry . 1999;263(3):797–805. doi: 10.1046/j.1432-1327.1999.00561.x. [DOI] [PubMed] [Google Scholar]
- 26.Binder A. K., Rodriguez K. F., Hamilton K. J., Stockton P. S., Reed C. E., Korach K. S. The absence of ER-β results in altered gene expression in ovarian granulosa cells isolated from in vivo preovulatory follicles. Endocrinology . 2013;154(6):2174–2187. doi: 10.1210/en.2012-2256. [DOI] [PMC free article] [PubMed] [Google Scholar]
- 27.O’Donnell A. J. M., Macleod K. G., Burns D. J., Smyth J. F., Langdon S. P. Estrogen receptor-α mediates gene expression changes and growth response in ovarian cancer cells exposed to estrogen. Endocrine-Related Cancer . 2005;12(4):851–866. doi: 10.1677/erc.1.01039. [DOI] [PubMed] [Google Scholar]
- 28.Riester M., Wei W., Waldron L., et al. Risk prediction for late-stage ovarian cancer by meta-analysis of 1525 patient samples. Journal of the National Cancer Institute: Journal of the National Cancer Institute . 2014;106(5) doi: 10.1093/jnci/dju048. [DOI] [PMC free article] [PubMed] [Google Scholar]
- 29.Verhaak R. G. W., Tamayo P., Yang J.-Y., et al. Prognostically relevant gene signatures of high-grade serous ovarian carcinoma. Journal of Clinical Investigation . 2013;123(1):517–525. doi: 10.1172/jci65833. [DOI] [PMC free article] [PubMed] [Google Scholar]
- 30.Bateman N. W., Jaworski E., Ao W., et al. Elevated AKAP12 in paclitaxel-resistant serous ovarian cancer cells is prognostic and predictive of poor survival in patients. Journal of Proteome Research . 2015;14(4):1900–1910. doi: 10.1021/pr5012894. [DOI] [PMC free article] [PubMed] [Google Scholar]
- 31.Ricci F., Brunelli L., Affatato R., et al. Overcoming platinum-acquired resistance in ovarian cancer patient-derived xenografts. Therapeutic advances in medical oncology . 2019;11 doi: 10.1177/1758835919839543. [DOI] [PMC free article] [PubMed] [Google Scholar]
- 32.Kersten S. Regulation of lipid metabolism via angiopoietin-like proteins. Biochemical Society Transactions . 2005;33(5):1059–1062. doi: 10.1042/bst20051059. [DOI] [PubMed] [Google Scholar]
- 33.Oike Y., Akao M., Kubota Y., Suda T. Angiopoietin-like proteins: potential new targets for metabolic syndrome therapy. Trends in Molecular Medicine . 2005;11(10):473–479. doi: 10.1016/j.molmed.2005.08.002. [DOI] [PubMed] [Google Scholar]
- 34.Khong T. L., Thairu N., Larsen H., Dawson P. M., Kiriakidis S., Paleolog E. M. Identification of the angiogenic gene signature induced by EGF and hypoxia in colorectal cancer. BMC Cancer . 2013;13(1):p. 518. doi: 10.1186/1471-2407-13-518. [DOI] [PMC free article] [PubMed] [Google Scholar]
- 35.Wu Y., Gao J., Liu X. Deregulation of angiopoietin-like 4 slows ovarian cancer progression through vascular endothelial growth factor receptor 2 phosphorylation. Cancer Cell International . 2021;21(1):p. 171. doi: 10.1186/s12935-021-01865-4. [DOI] [PMC free article] [PubMed] [Google Scholar]
- 36.Conway G. D., Buzza M. S., Martin E. W., et al. PRSS21/testisin inhibits ovarian tumor metastasis and antagonizes proangiogenic angiopoietins ANG2 and ANGPTL4. Journal of Molecular Medicine . 2019;97(5):691–709. doi: 10.1007/s00109-019-01763-3. [DOI] [PMC free article] [PubMed] [Google Scholar]
- 37.Schumann T., Adhikary T., Wortmann A., et al. Deregulation of PPARβ/δ target genes in tumor-associated macrophages by fatty acid ligands in the ovarian cancer microenvironment. Oncotarget . 2015;6(15):13416–13433. doi: 10.18632/oncotarget.3826. [DOI] [PMC free article] [PubMed] [Google Scholar]
- 38.Tian W.-J., Liu S.-S., Li B.-R. The combined detection of immune genes for predicting the prognosis of patients with non-small cell lung cancer. Technology in Cancer Research and Treatment . 2020;19:p. 153303382097750. doi: 10.1177/1533033820977504. [DOI] [PMC free article] [PubMed] [Google Scholar]
- 39.Shi X., Li R., Dong X., et al. IRGS: an immune-related gene classifier for lung adenocarcinoma prognosis. Journal of Translational Medicine . 2020;18(1):p. 55. doi: 10.1186/s12967-020-02233-y. [DOI] [PMC free article] [PubMed] [Google Scholar]
- 40.Cai L., Hu C., Yu S., et al. Identification and validation of a six-gene signature associated with glycolysis to predict the prognosis of patients with cervical cancer. BMC Cancer . 2020;20(1):p. 1133. doi: 10.1186/s12885-020-07598-3. [DOI] [PMC free article] [PubMed] [Google Scholar]
- 41.Lyons Y. A., Wu S. Y., Overwijk W. W., Baggerly K. A., Sood A. K. Immune cell profiling in cancer: molecular approaches to cell-specific identification. NPJ precision oncology . 2017;1(1):p. 26. doi: 10.1038/s41698-017-0031-0. [DOI] [PMC free article] [PubMed] [Google Scholar]
- 42.Lipskind S., Lindsey J. S., Gerami-Naini B., et al. An embryonic and induced pluripotent stem cell model for ovarian granulosa cell development and steroidogenesis. Reproductive Sciences . 2018;25(5):712–726. doi: 10.1177/1933719117725814. [DOI] [PMC free article] [PubMed] [Google Scholar]
- 43.Fortuño C., Labarta E. Genetics of primary ovarian insufficiency: a review. Journal of Assisted Reproduction and Genetics . 2014;31(12):1573–1585. doi: 10.1007/s10815-014-0342-9. [DOI] [PMC free article] [PubMed] [Google Scholar]
- 44.Mankoo P. K., Shen R., Schultz N., Levine D. A., Sander C. Time to recurrence and survival in serous ovarian tumors predicted from integrated genomic profiles. PLoS One . 2011;6(11) doi: 10.1371/journal.pone.0024709. [DOI] [PMC free article] [PubMed] [Google Scholar]
- 45.Etemadmoghadam D., deFazio A., Beroukhim R., et al. Integrated genome-wide DNA copy number and expression analysis identifies distinct mechanisms of primary chemoresistance in ovarian carcinomas. Clinical Cancer Research . 2009;15(4):1417–1427. doi: 10.1158/1078-0432.ccr-08-1564. [DOI] [PMC free article] [PubMed] [Google Scholar]
- 46.Cecco L. D., Marchionni L., Gariboldi M., et al. Gene expression profiling of advanced ovarian cancer: characterization of a molecular signature involving fibroblast growth factor 2. Oncogene . 2004;23(49):8171–8183. doi: 10.1038/sj.onc.1207979. [DOI] [PubMed] [Google Scholar]
- 47.Jazaeri A. A., Awtrey C. S., Chandramouli G. V. R., et al. Gene expression profiles associated with response to chemotherapy in epithelial ovarian cancers. Clinical Cancer Research . 2005;11(17):6300–6310. doi: 10.1158/1078-0432.ccr-04-2682. [DOI] [PubMed] [Google Scholar]
- 48.Stein W. D., Litman T., Fojo T., Bates S. E. A serial analysis of gene expression (SAGE) database analysis of chemosensitivity. Cancer Research . 2004;64(8):2805–2816. doi: 10.1158/0008-5472.can-03-3383. [DOI] [PubMed] [Google Scholar]
- 49.Karlan B. Y., Dering J., Walsh C., et al. POSTN/TGFBI-associated stromal signature predicts poor prognosis in serous epithelial ovarian cancer. Gynecologic Oncology . 2014;132(2):334–342. doi: 10.1016/j.ygyno.2013.12.021. [DOI] [PubMed] [Google Scholar]
- 50.Hatzirodos N., Hummitzsch K., Irving-Rodgers H. F., Harland M. L., Morris S. E., Rodgers R. J. Transcriptome profiling of granulosa cells from bovine ovarian follicles during atresia. BMC Genomics . 2014;15(1):p. 40. doi: 10.1186/1471-2164-15-40. [DOI] [PMC free article] [PubMed] [Google Scholar]
- 51.Yu J., Liu T.-T., Liang L.-L., et al. Identification and validation of a novel glycolysis-related gene signature for predicting the prognosis in ovarian cancer. Cancer Cell International . 2021;21(1):p. 353. doi: 10.1186/s12935-021-02045-0. [DOI] [PMC free article] [PubMed] [Google Scholar]
- 52.He C., Huang F., Zhang K., Wei J., Hu K., Liang M. Establishment and validation of an RNA binding protein-associated prognostic model for ovarian cancer. Journal of Ovarian Research . 2021;14(1):p. 27. doi: 10.1186/s13048-021-00777-1. [DOI] [PMC free article] [PubMed] [Google Scholar]
- 53.Li S., Hu X., Ye M., Zhu X. The prognostic values of the peroxiredoxins family in ovarian cancer. Bioscience Reports . 2018;38(5) doi: 10.1042/bsr20180667. [DOI] [PMC free article] [PubMed] [Google Scholar]
- 54.Curiel T. J., Coukos G., Zou L., et al. Specific recruitment of regulatory T cells in ovarian carcinoma fosters immune privilege and predicts reduced survival. Nature Medicine . 2004;10(9):942–949. doi: 10.1038/nm1093. [DOI] [PubMed] [Google Scholar]
- 55.Treilleux I., Blay J.-Y., Bendriss-Vermare N., et al. Dendritic cell infiltration and prognosis of early stage breast cancer. Clinical Cancer Research . 2004;10(22):7466–7474. doi: 10.1158/1078-0432.ccr-04-0684. [DOI] [PubMed] [Google Scholar]
- 56.Labidi-Galy S. I., Sisirak V., Meeus P., et al. Quantitative and functional alterations of plasmacytoid dendritic cells contribute to immune tolerance in ovarian cancer. Cancer Research . 2011;71(16):5423–5434. doi: 10.1158/0008-5472.can-11-0367. [DOI] [PubMed] [Google Scholar]
- 57.Van der Jeught K., Joe P. T., Bialkowski L., et al. Intratumoral administration of mRNA encoding a fusokine consisting of IFN-β and the ectodomain of the TGF-β receptor II potentiates antitumor immunity. Oncotarget . 2014;5(20):10100–10113. doi: 10.18632/oncotarget.2463. [DOI] [PMC free article] [PubMed] [Google Scholar]
- 58.Jansen Y., Kruse V., Corthals J., et al. A randomized controlled phase II clinical trial on mRNA electroporated autologous monocyte-derived dendritic cells (TriMixDC-MEL) as adjuvant treatment for stage III/IV melanoma patients who are disease-free following the resection of macrometastases. Cancer Immunology, Immunotherapy . 2020;69(12):2589–2598. doi: 10.1007/s00262-020-02618-4. [DOI] [PMC free article] [PubMed] [Google Scholar]
- 59.Triner D., Shah Y. M. Hypoxia-inducible factors: a central link between inflammation and cancer. Journal of Clinical Investigation . 2016;126(10):3689–3698. doi: 10.1172/jci84430. [DOI] [PMC free article] [PubMed] [Google Scholar]
- 60.Wu M., Lou J., Zhang S., et al. Gene expression profiling of CD8+ T cells induced by ovarian cancer cells suggests a possible mechanism for CD8+ Treg cell production. Cell Proliferation . 2016;49(6):669–677. doi: 10.1111/cpr.12294. [DOI] [PMC free article] [PubMed] [Google Scholar]
- 61.Zhang J., Zhang Q., Yang Y., Wang Q. Association between succinate receptor SUCNR1 expression and immune infiltrates in ovarian cancer. Frontiers in molecular biosciences . 2020;7:p. 150. doi: 10.3389/fmolb.2020.00150. [DOI] [PMC free article] [PubMed] [Google Scholar]
- 62.Kryczek I., Lange A., Mottram P., et al. CXCL12 and vascular endothelial growth factor synergistically induce neoangiogenesis in human ovarian cancers. Cancer Research . 2005;65(2):465–472. [PubMed] [Google Scholar]
- 63.Popple A., Durrant L. G., Spendlove I., et al. The chemokine, CXCL12, is an independent predictor of poor survival in ovarian cancer. British Journal of Cancer . 2012;106(7):1306–1313. doi: 10.1038/bjc.2012.49. [DOI] [PMC free article] [PubMed] [Google Scholar]
- 64.Bernardino J., Roux C., Almeida A., et al. DNA hypomethylation in breast cancer: an independent parameter of tumor progression? Cancer Genetics and Cytogenetics . 1997;97(2):83–89. doi: 10.1016/s0165-4608(96)00385-8. [DOI] [PubMed] [Google Scholar]
- 65.Soares J., Pinto A. n. E., Cunha C. V., et al. Global DNA hypomethylation in breast carcinoma. Cancer . 1999;85(1):112–118. doi: 10.1002/(sici)1097-0142(19990101)85:1<112::aid-cncr16>3.0.co;2-t. [DOI] [PubMed] [Google Scholar]
- 66.Lin F., Zhang P. L., Yang X. J., et al. Human kidney injury molecule-1 (hKIM-1): a useful immunohistochemical marker for diagnosing renal cell carcinoma and ovarian clear cell carcinoma. The American Journal of Surgical Pathology . 2007;31(3):371–381. doi: 10.1097/01.pas.0000213353.95508.67. [DOI] [PubMed] [Google Scholar]
- 67.Wei Y., Ou T., Lu Y., et al. Classification of ovarian cancer associated with BRCA1 mutations, immune checkpoints, and tumor microenvironment based on immunogenomic profiling. PeerJ . 2020;8 doi: 10.7717/peerj.10414. [DOI] [PMC free article] [PubMed] [Google Scholar]
- 68.Macpherson A. M., Barry S. C., Ricciardelli C., Oehler M. K. Epithelial ovarian cancer and the immune system: biology, interactions, challenges and potential advances for immunotherapy. Journal of Clinical Medicine . 2020;9(9):p. 2967. doi: 10.3390/jcm9092967. [DOI] [PMC free article] [PubMed] [Google Scholar]
- 69.Landskron J., Helland Ø., Torgersen K. M., et al. Activated regulatory and memory T-cells accumulate in malignant ascites from ovarian carcinoma patients. Cancer Immunology, Immunotherapy . 2015;64(3):337–347. doi: 10.1007/s00262-014-1636-6. [DOI] [PMC free article] [PubMed] [Google Scholar]
- 70.Konstantinopoulos P. A., Waggoner S., Vidal G. A., et al. Single-arm phases 1 and 2 trial of niraparib in combination with pembrolizumab in patients with recurrent platinum-resistant ovarian carcinoma. JAMA oncology . 2019;5(8):1141–1149. doi: 10.1001/jamaoncol.2019.1048. [DOI] [PMC free article] [PubMed] [Google Scholar]
- 71.Chen J., Jiang C. C., Jin L., Zhang X. D. Regulation of PD-L1: a novel role of pro-survival signalling in cancer. Annals of Oncology . 2016;27(3):409–416. doi: 10.1093/annonc/mdv615. [DOI] [PubMed] [Google Scholar]
- 72.Cacan E. Epigenetic-mediated immune suppression of positive co-stimulatory molecules in chemoresistant ovarian cancer cells. Cell Biology International . 2017;41(3):328–339. doi: 10.1002/cbin.10729. [DOI] [PubMed] [Google Scholar]
- 73.Crijns A. P. G., Fehrmann R. S. N., de Jong S., et al. Survival-related profile, pathways, and transcription factors in ovarian cancer. PLoS Medicine . 2009;6(2):p. e1000024. doi: 10.1371/journal.pmed.1000024. [DOI] [PMC free article] [PubMed] [Google Scholar]
- 74.Wu M., Chen X., Lou J., et al. TGF-β1 contributes to CD8+ Treg induction through p38 MAPK signaling in ovarian cancer microenvironment. Oncotarget . 2016;7(28):44534–44544. doi: 10.18632/oncotarget.10003. [DOI] [PMC free article] [PubMed] [Google Scholar]
- 75.Mabuchi S., Kuroda H., Takahashi R., Sasano T. The PI3K/AKT/mTOR pathway as a therapeutic target in ovarian cancer. Gynecologic Oncology . 2015;137(1):173–179. doi: 10.1016/j.ygyno.2015.02.003. [DOI] [PubMed] [Google Scholar]
- 76.Zhang Y., Lv J., Guo H., Wei X., Li W., Xu Z. Hypoxia-induced proliferation in mesenchymal stem cells and angiotensin II-mediated PI3K/AKT pathway. Cell Biochemistry and Function . 2015;33(2):51–58. doi: 10.1002/cbf.3080. [DOI] [PubMed] [Google Scholar]
- 77.Wang S., Zhu M., Wang Q., et al. Alpha-fetoprotein inhibits autophagy to promote malignant behaviour in hepatocellular carcinoma cells by activating PI3K/AKT/mTOR signalling. Cell Death & Disease . 2018;9(10):p. 1027. doi: 10.1038/s41419-018-1036-5. [DOI] [PMC free article] [PubMed] [Google Scholar]
- 78.Zhang L., Yang N., Conejo-Garcia J. R., et al. Expression of endocrine gland-derived vascular endothelial growth factor in ovarian carcinoma. Clinical Cancer Research: An Official Journal of the American Association for Cancer Research . 2003;9(1):264–272. [PubMed] [Google Scholar]
- 79.Cheng D., Liang B., Li Y. Serum vascular endothelial growth factor (VEGF-C) as a diagnostic and prognostic marker in patients with ovarian cancer. PLoS One . 2013;8(2) doi: 10.1371/journal.pone.0055309. [DOI] [PMC free article] [PubMed] [Google Scholar]
- 80.Nievergall E., Lackmann M., Janes P. W. Eph-dependent cell-cell adhesion and segregation in development and cancer. Cellular and Molecular Life Sciences . 2012;69(11):1813–1842. doi: 10.1007/s00018-011-0900-6. [DOI] [PMC free article] [PubMed] [Google Scholar]
- 81.Wu J., Xie N., Zhao X., Nice E. C., Huang C. Dissection of aberrant GPCR signaling in tumorigenesis--a systems biology approach. CANCER GENOMICS and PROTEOMICS . 2012;9(1):37–50. [PubMed] [Google Scholar]
- 82.He M., Wei M.-J. Reversing multidrug resistance by tyrosine kinase inhibitors. Chinese Journal of Cancer . 2012;31(3):126–133. doi: 10.5732/cjc.011.10315. [DOI] [PMC free article] [PubMed] [Google Scholar]
- 83.Li C., Liu V. W., Chiu P. M., Chan D. W., Ngan H. Y. Over-expressions of AMPK subunits in ovarian carcinomas with significant clinical implications. BMC Cancer . 2012;12(1):p. 357. doi: 10.1186/1471-2407-12-357. [DOI] [PMC free article] [PubMed] [Google Scholar]
Associated Data
This section collects any data citations, data availability statements, or supplementary materials included in this article.
Data Availability Statement
All data are available in the article.


