

Abstract
Background
Differentiation of low‐grade intestinal T‐cell lymphoma (LGITL) from lymphoplasmacytic enteritis (LPE) in cats is a diagnostic challenge for pathologists.
Objective
Characterize histologic, immunohistochemical, and molecular features of LGITL and LPE.
Animals
Forty‐four client‐owned cats, 22 diagnosed with LGITL and 22 with LPE.
Methods
Prospective, cohort study. Clinical suspicion of LGITL or LPE was based on persistent gastrointestinal signs, unresponsive to empirical treatments. All cats underwent a standardized diagnostic evaluation, including biopsy (preferentially full‐thickness), and were diagnosed with LGITL or LPE after review of clinical, laboratory, sonographic, histologic, immunohistochemical, and clonality results.
Results
A monomorphic lymphocytic population (22/22, 100%) and in‐depth mucosal infiltration (15/22, 68%) were hallmarks of LGITL. Epithelial patterns (nests and plaques) were significantly more frequent in LGITL (11/22, 50%) than in LPE (1/22, 5%) cases (P = .001). A CD3+ lymphocytic apical‐to‐basal gradient was observed in 9/22 (41%) of LGITL vs 1/22 (5%) of LPE cases (P = .004). Most LPE cases (17/18, 94%) featured marked fibrosis in the superficial part of the lamina propria. The Ki‐67 20%‐ and 30%‐thresholds discriminated between LGITL and LPE within both the epithelium (specificity >95%) and lamina propria (specificity >95%), respectively. All LGITL cases were CD3+ pSTAT3− and pSTAT5+. T‐cell receptor gamma chain gene rearrangements indicated monoclonality in 86% of LGITL cases. Surprisingly, 70% of LPE cases featured monoclonality (40%) or monoclonality on a polyclonal background (30%).
Conclusions and Clinical Importance
We identified new histologic, immunohistochemical, and clonality criteria to distinguish LGITL from LPE.
Keywords: alimentary lymphoma, CD20, CD3, clonality, epithelium, fibrosis, full‐thickness intestinal biopsies, gradient, histology, immunohistochemistry, inflammatory bowel disease, JAK‐STAT, Ki‐67, lamina propria, monoclonal, nest, PARR, plaque, polyclonal
Abbreviations
- FFPE
formalin‐fixed and paraffin‐embedded
- IEL
intraepithelial lymphocyte
- IHC
immunohistochemistry
- LGITL
low‐grade intestinal T‐cell lymphoma
- LPE
lymphoplasmacytic enteritis
- PARR
polymerase chain reaction (PCR) to assess antigen receptor gene rearrangements
1. INTRODUCTION
Low‐grade intestinal T‐cell lymphoma (LGITL) is an indolent disease of older cats. Its incidence has increased over the last 2 decades. 1 , 2 , 3 A challenge for both veterinary clinicians and pathologists is to distinguish lymphoplasmacytic enteritis (LPE) from LGITL. 1 , 2 An extensive diagnostic approach is mandatory, and intestinal biopsies are required to reach a final diagnosis. Indolent lymphomas mainly infiltrate the small intestinal mucosa. In cats, the jejunum and ileum represent the most frequent sites affected by the disease. 3 , 4 Although invasive, full‐thickness intestinal biopsy is recommended for diagnosis. 5 , 6 Nevertheless, diagnosis remains challenging given the frequent lack of specific changes associated with LGITL and the marked cellularity observed in some LPE cases. Histologic evaluation usually is performed according to the guidelines of the World Small Animal Veterinary Association (WSAVA) Gastrointestinal Standardization Group 7 and the World Health Organization (WHO) classification of lymphoid neoplasms. 8 Histologically, LGITL is defined by an infiltration of small to intermediate‐sized neoplastic lymphocytes, involving both the epithelium and the lamina propria of the villi, although submucosal or muscularis infiltrations or both have been reported. 4 , 9 , 10 , 11 , 12
Histologic features of intraepithelial lymphocytes (IEL), intraepithelial nests and plaques have been suggested to differentiate LGITL from LPE. 4 , 11 , 13 Other lesions reported in LGITL include villous blunting, residual plasma cells within the lamina propria, and neutrophilic cryptitis within the epithelium. 12
Immunohistochemistry (IHC) is necessary to confirm diagnosis with LGITL being of the CD3+ T‐cell phenotype, 12 whereas LPE shares a combination of T‐ and B‐cell phenotypes. 4 , 13 , 14 Interestingly, Ki67 assessment has not been used in this context and may help discriminate both entities, LGITL potentially showing a higher proliferative activity than LPE. Finally, JAK/STAT pathway alterations recently have been reported in gastrointestinal T‐cell lymphoproliferative disorders (GI‐TLPDs) in humans. 15 , 16 Low‐grade intestinal T‐cell lymphoma recently has been confirmed as a relevant model for GI‐LPDs, highlighting the diagnostic value of phosphoSTAT5. 17
Molecular analyses of T‐cell receptor gamma (TCRγ) chain gene rearrangements have been validated to better differentiate reactive and neoplastic lymphoid proliferation, in addition to morphology and IHC. 4 , 18 , 19 , 20 Polymerase chain reaction (PCR) to assess antigen receptor gene rearrangements (PARR) targets the CDR3 region of the TCRγ chain for T‐cells, and immunoglobulin heavy chain genes (IGH) for B‐cells. 9 , 19 , 20 , 21 , 22 As a result, LPEs usually feature a polyclonal pattern whereas >90% of LGITLs exhibit clonal or oligoclonal TCRγ gene rearrangements. 4 In previous studies, PARR sensitivity and specificity was nearly 90% for the diagnosis of TCRγ gene rearrangements in cats. 1 , 12 As such, it has been suggested that clonality testing be integrated in the routine diagnostic evaluation of LGIL. 18
We aimed to prospectively establish new comparative histologic, immunohistochemical, and clonality features to distinguish LGITL from LPE and provide specific criteria to discriminate uncertain cases.
2. MATERIALS AND METHODS
2.1. Cat recruitment
The cohort of cats diagnosed with LGITL in our study has already been compared to its counterpart in humans in another study. 17 The cohort of cats, subsequently diagnosed with LPE, was recruited for the present study. This second cohort was recruited at the same referral center, Alfort School of Veterinary Medicine, Paris, France, between July 2016 and July 2018, and the study was approved by the ethical committee of our institution (ENVA COMERC n°2017‐05‐09). Furthermore, all owners gave written consent for the investigation. In both cohorts, clinical suspicion of LGITL or LPE was based on persistent (≥3 weeks) gastrointestinal clinical signs (weight loss, vomiting, anorexia, diarrhea, and lethargy) 1 , 2 , 3 , 23 , 24 without response to dietary (hypoallergenic diets) and symptomatic (parasiticides, antibiotics, and gastrointestinal protectants) treatments. Cats underwent a standardized diagnostic evaluation including history, physical examination, CBC, serum biochemistry profile (including serum cobalamin concentration), urinalysis, fecal analysis, and abdominal ultrasound examination (days 1‐7). Abdominal ultrasound examination was performed within 48 hours of biopsy. Cats were excluded from the study if another tumor was suspected before surgery or if other comorbidities were present that could lead to complications (data presented in companion article). 25
2.2. Abdominal ultrasound criteria
A complete abdominal ultrasonographic evaluation was performed. Furthermore, standardized images were collected including all regions of the gastrointestinal tract: stomach, duodenum, jejunum, ileum, cecum, and colon. Total wall thickness was assessed for each segment, including maximal measurement as well as thickness of the mucosa, submucosa, and muscularis layers. Altered echogenicity and loss of layering were noted. All images were reviewed by a board‐certified radiologist.
2.3. Biopsy sampling
Surgical biopsies were performed in all cases to assess all layers of the intestinal wall, taking into consideration the risks of complications. 5 In cases where the surgical procedure was declined, endoscopic biopsies were performed. Biopsy sites were selected according to: (a) the literature data, with the most reported sites involving the jejunum and ileum, 1 , 3 , 4 (b) abdominal ultrasonographic data (data are presented in companion article), 25 and (c) macroscopic changes observed during surgery (eg, intestinal wall thickness of each digestive segment, lymph node enlargement). Surgical biopsy samples were immediately mounted on a moisturized synthetic foam sponge, placed in a fenestrated plastic cassette and immersed in 10% formalin.
2.4. Histologic study
Formalin‐fixed tissues were paraffin‐embedded (FFPE), and 4 μm tissue sections were stained with hematoxylin & eosin saffron (HES) and Masson's trichrome, the latter was performed to identify the extent and distribution of fibrosis, if present. All cases were classified according to WSAVA recommendations and WHO 2016 revised classification of lymphoid neoplasms, 7 , 26 and detailed macroscopic criteria are listed in Table 1. Moreover, lymphocytic cellularity was graded from 1 to 3 within the lamina propria according to density (mild: 1/3; moderate: 2/3; severe: 3/3), as described previously. 27
TABLE 1.
Histologic analytic criteria separately applied to biopsy samples by the 2 pathologists 17
| Histologic criteria | Analytic criteria description | |
|---|---|---|
| Villi |
Villus atrophy A global assessment of all the villi identified on the slide is performed |
0: no villus atrophy 1: villus‐to‐crypt ratio below 3:1 2: shortened and enlarged villi |
| Epithelium | Epithelial infiltration by small lymphocytes |
0: no mucosal diffuse lymphocytic infiltration 1: diffuse infiltration |
| Patchy infiltration by small lymphocytes: nests and/or plaques |
0: no intraepithelial lymphocytes (IEL) nests or plaque 1: nest and/or plaque (≥1) |
|
| Lamina propria | Lymphocytic cellularity |
1: mild lymphocytic cellularity 2: moderate lymphocytic cellularity 3: marked lymphocytic cellularity |
| Patchy infiltration of lamina propria |
0: no heterogeneous infiltration 1: heterogeneous infiltration (≥1 heterogeneous area) |
|
| Apical to basal gradient of small lymphocytes |
0: no gradient 1: gradient |
|
| Crypts | Compensatory hyperplasia |
0: no compensatory hyperplasia 1: mild hyperplasia 2: moderate hyperplasia 3: marked hyperplasia |
| Lymphocytic cryptitis |
0: no lymphocytic cryptitis 1: mild lymphocytic cryptitis 2: moderate lymphocytic cryptitis 3: marked lymphocytic cryptitis |
|
| Neutrophilic cryptitis |
0: no neutrophilic cryptitis 1: mild neutrophilic cryptitis 2: moderate neutrophilic cryptitis 3: marked neutrophilic cryptitis |
|
| Crypt abscesses |
0: no 1: yes (≥1) |
|
| Epithelial apoptosis |
0: no apoptosis 1: epithelial apoptosis |
|
| Monomorphism | Monomorphic small lymphoid cells population in lamina propria and epithelium |
0: no 1: yes |
| Immune cells repartition/presence | Lymphocytes, plasmocytes, neutrophils, eosinophils, macrophages, histiocytes | |
| Depth of infiltration | Sub‐mucosal infiltration by lymphocytic population |
0: no lymphocytic infiltration 1: lymphocytic infiltration |
| Muscularis infiltration by lymphocytic population |
0: no lymphocytic infiltration 1: lymphocytic infiltration |
|
| Serosal infiltration by lymphocytic population |
0: no lymphocytic infiltration 1: lymphocytic infiltration |
|
| Fibrosis | Fibrosis located to lamina propria |
0: no fibrosis 1: fibrosis |
| Fibrosis located to deep lamina propria and sub mucosa layers |
0: no fibrosis 1: fibrosis |
|
A separate quantitative assessment was performed for the epithelium and lamina propria. To prevent observer bias, 28 , 29 slide interpretations were performed blindly by both a specialized veterinary pathologist (Nathalie Cordonnier) and a medical pathologist qualified in lymphoproliferative disorders (Julie Bruneau). Both were not aware of the clinician's tentative diagnosis. Scoring systems were used to describe histological features and are presented in Table 1.
2.5. Immunohistochemistry assessment
Immunolabeling was performed and analyzed on FFPE tissue sections using a quantitative assessment. Each cluster of differentiation was independently assessed by both veterinary and medical pathologists. Quantification was performed in the most infiltrated areas where the neoplastic population was heterogeneously distributed. Sections from each sample were labeled using a panel of antibodies. In a previous study, proper controls were performed for each of the antibodies. 17 Anti‐CD3 antibody staining was performed to identify the T‐cell lineage (1:20 dilution, F7.2.38, DakoCytomation, Santa Clara, California). Anti‐CD20 antibodies staining was used to identify the B‐cell lineage (1:400 dilution, RB‐9013‐P1c, Lab Vision Corporation, Fremont, California). Mac 387 antibodies staining identified L1 macrophages protein (myeloid/histiocyte antigen; 1:200 dilution, MAC387, DakoCytomation, Santa Clara, California). The MIB‐1 antibodies were examined with respect to Ki‐67 proliferative index activity within the neoplastic population (1:75 dilution, MIB‐1, DakoCytomation, Santa Clara, California). This index normally is expressed in the nucleus during all phases of the cell division cycle, with its concentration increasing during the cell cycle, becoming maximal in the M phase, and then completely disappearing after mitosis. The STAT3/STAT5 pathway was evaluated using pSTAT3Y705 antibodies (Phospho‐STAT3; 1:100 dilution, D3A7, Cell Signaling, Danvers, Massachusetts) and pSTAT5Y694/699 antibodies (Phospho‐STAT5; 1:100 dilution, polyclonal antibody, Biorbyt, Cambridge, United Kingdom). The IHC approach consisted of a separate quantitative assessment in the epithelial and lamina propria compartments. In LGITL cases, IHC specifically was quantified on tumor cells. Discordant cases were resolved by consensus review. If the infiltration was not uniformly distributed, the most infiltrated areas were examined. Lastly, a semiquantitative immunohistochemical assessment of the epithelium and lamina propria was performed. Discordant cases were resolved in consensus review (Figure S1).
2.6. Clonality testing
Molecular detection of clonal B‐cell receptor (BCR) and T‐cell receptor (TCRγ) gene rearrangements was performed in all cases on DNA extracted from FFPE tissue slides or from frozen intestinal biopsy samples or both by multiplex PCR at the Genefast Laboratory (Forlì, Italy), as previously reported. 9 , 21 Both T‐ and B‐cell PCR reactions were performed in duplicate. Results were reviewed by both experts in veterinary and human sample clonality. A monoclonal rearrangement is defined by the detection of a single peak and a polyclonal rearrangement is defined by the presence of >4 peaks or the absence of peaks. Oligoclonality is defined by the presence of 1 to 3 peaks on a polyclonal background.
2.7. Statistical analysis
Statistical analyses and graphs were made using GraphPad PRISM 9 software version 8.1.1 (San Diego, California). Fisher's exact test was performed when comparing qualitative variables, and the Mann‐Whitney test was performed for comparing quantitative data, using a Bonferroni correction for multiple comparisons. P values <.05 were considered significant. For categorical variables, 2 × 2 contingency tables were constructed, and groups were compared using the Chi‐squared test or Fisher's exact tests, when expected counts within cells were <5. The P value thresholdswere expressed according to Ronald Fisher classification: nonsignificant (ns, P > .05), *(.01 < P ≤ .05), **(.001 < P ≤ .01), ***(.0001 < P ≤ .001), ****(P ≤ .0001). Survival time was defined as the time from histologic and immunohistochemical diagnosis until the animal died or was censored. Cats that were lost to follow‐up were censored from statistical evaluation of survival. Cats that were still alive at the time of analysis had their survival times censored at the time of analysis. Survival curves were calculated using Kaplan‐Meier analysis and a log‐rank test (Mantel‐Cox) was used to compare curves.
2.8. Treatment and diet
All cats were treated according to the final diagnosis: cats diagnosed with LGITL all were treated with prednisolone and chlorambucil according to previous studies, 1 , 3 , 30 and cats diagnosed with LPE were treated with prednisolone alone. 1 All cats were fed with either gastrointestinal, hypoallergenic, or nonallergenic diets.
3. RESULTS
3.1. Patients
Forty‐four cats were recruited over the study period, 22 diagnosed with LIGTL and 22 diagnosed with LPE. Epidemiologic, clinical, and clinicopathologic data are presented in a companion article. 25 Most of the cats included in both groups were older domestic shorthair cats suffering from chronic gastrointestinal signs (data not shown).
3.2. Lesion localization
Full‐thickness intestinal (duodenum, jejunum, ileum) biopsy samples were obtained from 41 of the 44 cats. Multiple endoscopic biopsies were performed in the 3 remaining cats for which exploratory laparotomy was declined by the owners. No large intestine biopsies were performed because neither clinical signs nor ultrasound examinations were suggestive of colonic involvement. Furthermore, this localization has not been reported for indolent lymphoproliferative disorders in cats. Among the 22 cats diagnosed with LGITL, 14 (64%) had infiltration of the jejunum only, 6 (27%) had infiltration in both the jejunum and ileum, and 2 (9%) had infiltration in the ileum only. A single LGITL case was identified by endoscopic duodenal biopsy in the 3 cases for which exploratory laparotomy was declined by the owner. For the remaining 2 cases, an LPE diagnosis was favored in the absence of evident monomorphic lymphoid infiltrate.
3.3. Histologic findings
Based on the histologic criteria listed in Table 1, discriminating histologic results are presented in Table 2. The most common histologic feature in cats with LGITL was a marked infiltration of both the epithelium and lamina propria by small‐sized monomorphic lymphoid T‐cells. A polymorphic pattern was characteristic of LPE cases. The LGITL cases often had accompanying intraepithelial infiltration. Analysis of crypts identified significant differences between the groups: lymphocytic cryptitis strongly discriminated between LGITL and LPE (91% and 23%, respectively; P < .0001). However, neutrophilic cryptitis and microabscesses were identified in both groups. Interestingly, 10 of the 22 cats (45%) with LGITL had certain histopathological features of concomitant inflammatory bowel disease, such as prominent or minor cellular polymorphisms with mixed lymphoid and plasmacytic inflammatory infiltrates, neutrophilic cryptitis, abscesses, or some combination of these. Villous atrophy was much more frequent in LGITL than in LPE. Moreover, an apical‐to‐basal gradient of small lymphocytes was observed in 41% of LGITL vs 5% in LPE cases. An apical‐to‐basal gradient is characterized by a more severe apical than basal neoplastic cell infiltration. Neither muscularis nor serosal lymphocytic infiltration was noted in cats with LPE. Surprisingly, results from Masson's trichrome staining were consistent with superficial fibrosis in the LPE group, whereas exclusive deep fibrosis characterized the LGITL group. All comparative and relevant histologic criteria, including architecture, epithelium, and lamina propria, are illustrated in Figure 1.
TABLE 2.
Method of semiquantitative assessment of immunohistochemistry staining based on double reading
| Localization | Histologic criteria (number of cases, %) | LGITL | LPE | P | Test |
|---|---|---|---|---|---|
| Villi | Villus atrophy | 19/22 (86%, CI 67%‐95%) | 2/22 (9%, CI 3%‐28%) | <.0001**** | Chi2 |
| Epithelium | Epithelial infiltration by small intraepithelial lymphocytes | 19/22 (86%, CI 67%‐95%) | 3/22 (14%, CI 5%‐33%) | <.0001**** | Chi2 |
| Intraepithelial lymphocytes nests or plaques or both | 11/22 (50%, CI 31%‐69%) | 1/22 (5%, CI 1%‐22%) | .0007*** | Chi2 | |
| Lamina propria | Dense infiltration of lamina propria | 21/22 (95%, CI 78%‐99%) | 0/22 (0%, CI 0%‐15%) | <.0001**** | Chi2 |
| Heterogeneous lymphocytic infiltration | 5/22 (23%, CI 10%‐43%) | 0/22 (0%, CI 0%‐15%) | .05* | Fisher | |
| Apical to basal gradient of small lymphocytes | 9/22 (41%, CI 23%‐61%) | 1/22 (5%, CI 1%‐22%) | .004** | Chi2 | |
| Crypts | Compensatory hyperplasia | 17/22 (77%, CI 57%‐90%) | 6/22 (27%, CI 13%‐48%) | .0009*** | Chi2 |
| Epithelial apoptosis | 1/22 (5%, CI 1%‐22%) | 8/22 (36%, CI 20%‐57%) | .02* | Fisher | |
| Lymphocytic cryptitis | 20/22 (91%, CI 72%‐97%) | 5/22 (23%, CI 10%‐43%) | <.0001**** | Chi2 | |
| Neutrophilic cryptitis | 3/22 (14%, CI 5%‐33%) | 8/22 (36%, CI 20%‐57%) | .15 | Chi2 | |
| Crypt abscesses | 6/22 (27%, CI 13%‐48%) | 5/22 (23%, CI 10%‐43%) | .73 | Chi2 | |
| Monomorphism | Monomorphic small lymphoid cells population in lamina propria and epithelium | 22/22 (100%, CI 85%‐100%) | 1/22 (5%, CI 1%‐22%) | <.0001**** | Fisher |
| Lymphocytic cellularity | Strong lymphocytic cellularity (2/3 or 3/3) | 21/22 (95%, CI 78%‐99%) | 3/22 (14%, CI 5%‐33%) | <.0001**** | Chi2 |
| Depth of infiltration | Sub‐mucosal infiltration by lymphocytic population | 15/22 (68%, CI 10%‐43%) | 2/22 (9%, CI 3%‐28%) | <.0001**** | Chi2 |
| Muscularis infiltration by lymphocytic population | 10/21 (48%, CI 28%‐67%) | 0/20 (0%, CI 0%‐16%) | .0005*** | Fisher | |
| Serosal infiltration by lymphocytic population | 5/21 (24%, CI 11%‐45%) | 0/20 (0%, CI 0%‐16%) | .05* | Fisher | |
| Fibrosis | Fibrosis located to the superficial lamina propria | 7/21 (33%, CI 17%‐55%) | 17/18 (94%, CI 74%‐99%) | <.0001**** | Chi2 |
| Fibrosis located to deep lamina propria and submucosal layers | 9/21 (43%, CI 24%‐63%) | 0/18 (0%, CI 0%‐18%) | .0016** | Fisher |
Note: Data have been retained when absolute difference between reading values from human and veterinary pathologists was ≤5 for the [0‐10; 90‐100] range values and ≤10 for the [10‐90] range values. Higher discrepancies have been discussed and reviewed until agreements were found. Average percent of positive cells is calculated out of 100 cells in each compartment. 95% binomial confidence intervals (CI) are reported for each percent in the LGITL and LPE columns.
Abbreviations: LGITL, low‐grade intestinal T‐cell lymphoma; LPE, lymphoplasmacytic enteritis.
FIGURE 1.

Pattern A shows apical‐to‐basal gradient and massive infiltration by low‐grade intestinal T‐cell lymphoma (LGITL) (HES ×100) with small and monomorphous CD3+ T‐cells, displaying an intraepithelial lymphocytosis (HES ×400) or lymphocytic cryptitis. In rare cases neutrophilic cryptitis are observed. Both cases present variable villous blunting. Masson Trichrome staining show a thin fibrosis of the lamina propria in the apical‐to‐basal gradient onset and no fibrosis of the lamina propria in the massive infiltrative onset. Pattern B represents 2 cases of lymphoplasmacytic enteropathies. HES staining shows a superficial fibrosis of the lamina propria in both cases, confirmed by Masson's Trichrome staining. High power field magnification pictures show a polymorphous infiltrate including neutrophilic cryptitis or abscesses. CD3 staining confirms the absence of IEL increase and show a heterogeneous CD3+ inflammatory infiltrate in the lamina propria
3.4. Immunophenotyping
Table 3 and Figure 2 present the global immunohistochemical differences between the LGITL and LPE cases groups. Most of the LGITL cases had diffuse and extensive infiltration of the small intestinal lamina propria by small T‐CD3+ lymphocytes. A significant increase in the number of CD3+ T‐cells also was observed within the epithelium, with a median count of 97% (range, 20‐100) epithelial cells (P < .0001). As expected in LGITL cases, the proportion of CD20+ B‐cells in the epithelium and in the lamina propria was very low (5% [range, 1‐5] and 20% [range, 10‐40], respectively). In contrast with the LGITL cases, CD3 expression was low in the LPE group, both within the epithelium and lamina propria, whereas CD20 was highly expressed in the lamina propria. Surprisingly, we observed weak and aberrant CD20 expression on CD3+ tumor cells in 10 LGITL cases (45%). Intracytoplasmic L1 protein, which typically is expressed in neutrophils and macrophages, was low and nonsignificant in our study groups. Median expression levels of Ki‐67 in the neoplastic population in the lamina propria were significantly higher in LGITL (30%) than in LPE (10%) cases (P = .0001). Comparable results were observed in the epithelium, with proliferation indexes of 20% in LGITL vs 5% in LPE cases (P < .0001). Hence, cut‐offs of 20% and 30% were chosen to discriminate LGITL from LPE, both in the epithelium (specificity >95%) and lamina propria (specificity >95%), respectively, as shown in Figure 3. The STAT3/STAT5 pathway activation was assessed by phospho‐STAT labeling. Phospho‐STAT3 (pSTAT3) was not expressed, whereas phospho‐STAT5 (pSTAT5) was positive in 100% of the LGITL tumor cells. By comparison, in LPE cases, pSTAT3 expression was high in inflammatory reactive cells of the lamina propria in LPE cases, whereas pSTAT5 expression was lower (P < .0001).
TABLE 3.
Immunophenotypic comparative findings between LGITL and LPE groups
| Immunophenotypic findings (%) (median, range) | LGITL | LPE | P | |
|---|---|---|---|---|
| CD3 expression | Lamina propria | 91 [20‐99], n = 22 | 20 [10‐70], n = 22 | <.0001**** |
| Epithelium | 97 [20‐100], n = 22 | 23 [3‐70], n = 22 | <.0001**** | |
| CD20 expression | Lamina propria | 20 [10‐40], n = 22 | 80 [60‐95], n = 22 | <.0001**** |
| Epithelium | 5 [1‐5], n = 22 | 5 [0‐5], n = 22 | .804 | |
| Ki‐67 expression | Lamina propria | 30 [7.5‐65], n = 22 | 10 [5‐50], n = 22 | <.0001*** |
| Epithelium | 20 [5‐45], n = 22 | 5 [1‐25], n = 22 | <.0001**** | |
| PhosphoStat3 expression | Global assessment | <10, n = 22 | 30, n = 18 | .04* |
| PhosphoStat5 expression | Global assessment | 100, n = 22 | 35, n = 18 | <.0001**** |
Abbreviations: LGITL, low‐grade intestinal T‐cell lymphoma; LPE, lymphoplasmacytic enteritis.
FIGURE 2.
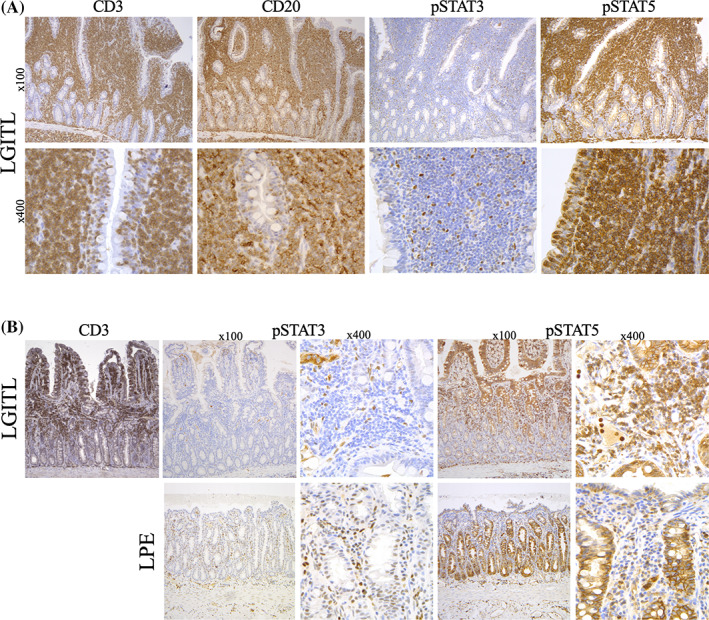
Pattern A shows low‐grade intestinal T‐cell lymphoma (LGITL) case with CD20 aberrant expression and differential expression of negative pSTAT3 and positive pSTAT5. At higher magnification (×400), intraepithelial and lamina propria lymphocytes display the same phenotype. Pattern B shows LGITL case with an apical‐to‐basal infiltration (CD3+ partial infiltration of the villi and superficial lamina propria) and a lymphoplasmacytic enteritis (LPE) case. Differential expression of pSTAT3 and pSTAT5 between LGITL and LPE may help to discriminate both diagnoses: tumoral T‐cells are pSTAT3− and pSTAT5+ whereas reactive inflammatory cells are pSTAT3+ and pSTAT5 mostly negative
FIGURE 3.

Receiver operator characteristic (ROC) curve for differentiating cats with low‐grade intestinal T‐cell lymphoma (LGITL) from cats with lymphoplasmacytic enteritis (LPE) based on Ki67 expression in the epithelium and lamina propria. AUC, area under the curve
3.5. Clonality results
Table 4 shows the results of TCRγ molecular detection in both groups. At the time of diagnosis, molecular detection of TCRγ chain gene rearrangements indicated monoclonality in 19 of the 22 LGITL cases (86%). Surprisingly, 70% of LPE cases showed monoclonality, with 30% showing monoclonality in a polyclonal background. In addition, molecular detection of clonal B‐cell receptor (BCR) was performed. All LGITL cases were polyclonal, whereas in LPE cases, 90% displayed BCR polyclonality and 10% showed oligoclonality.
TABLE 4.
Clonality comparative analysis between LGITL and LPE groups
| LGITL | LPE | |
|---|---|---|
| Monoclonality | 19/22 (86%, CI 67%‐95%) | 8/20 (40%, CI 22%‐61%) |
| Monoclonality in a polyclonal background | 0/22 (0%, CI 0%‐15%) | 6/20 (30%, CI 15%‐52%) |
| Oligoclonality | 0/22 (0%, CI 0%‐15%) | 2/20 (10%, CI 3%‐30%) |
| Polyclonality with minor clones | 1/22 (5%, CI 1%‐22%) | 0/20 (0%, CI 0%‐16%) |
| Polyclonality | 2/22 (9%, CI 3%‐28%) | 4/20 (20%, CI 8%‐42%) |
Note: 95% binomial confidence intervals (CI) are reported for each percent in the LGITL and LPE columns.
Abbreviations: LGITL, low‐grade intestinal T‐cell lymphoma; LPE, lymphoplasmacytic enteritis.
3.6. Survival time
Both LGITL and LPE cohorts were recruited between July 2016 and July 2018. Survival analyses were performed in May 2021. Survival data were available for 20/22 cats with LGITL and 21/22 cats with LPE. Finally, in this cohort, long‐term follow‐up data was only available for 17 cats: 12 LGITL cats and 5 LPE cats. Two LGITL cats and 1 LPE cat died of postoperative complications before the results of histology and IHC were available. Eight LGITL cats were censored, because they were all lost to follow‐up at the time of analysis. Sixteen LPE cats were censored, including 14 cats that were lost to follow‐up at the completion of the study period and 2 cats that were still alive at the time of analysis.
Among the 12 deceased LGITL cats, 5/12 (42%) died from relapse of the lymphoma, 4/12 (33%) died from other neoplasia (nonlymphoproliferative tumors), and 3/12 (25%) died from other comorbidities (heart failure, chronic kidney disease, feline infectious peritonitis). Among the 5 deceased LPE cats, 4/5 (80%) died from comorbidities and 1/5 (20%) died from a splenic large granular lymphocytic lymphoma.
Median survival time was 719 days in LGITL cats but could not be defined in LPE cats, because >50% of owners declined long‐term follow‐up and those cases had to be censored. The LGITL cats had shorter (but not statistically different) overall survival times than LPE cats (P = .06; Figure 4).
FIGURE 4.
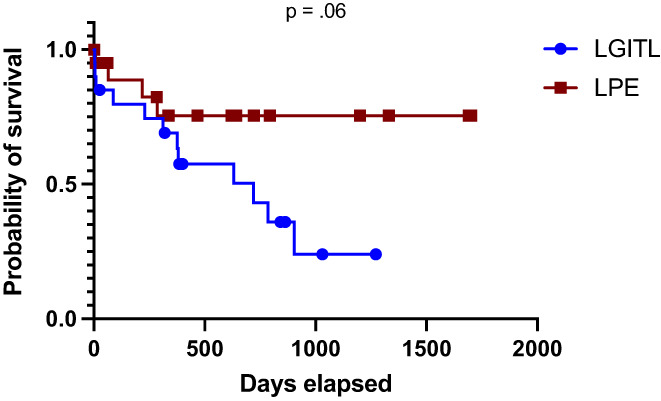
Survival data for 20 cats with low‐grade intestinal T‐cell lymphoma (LGITL) and 21 cats with lymphoplasmacytic enteritis (LPE). Eight LGITL cats were censored, as they were all lost to follow‐up at the time of analysis. Sixteen LPE cats were censored, including 14 cats that were lost to follow‐up at the completion of the study period and 2 cats that were still alive at the time of analysis. Median survival time for LGITL cats was 719 days (range, 4‐1272 days). Median survival times for LPE cats was not defined because more than 50% of the LPE cohort was censored
3.7. Treatment and long‐term follow‐up
In the current cohort, long‐term follow‐up data were only available for 17 cats (12 LGITL cats and 5 LPE cats). All treatments and diet recommendations are still ongoing within the 2 groups for all noncensored cats.
4. DISCUSSION
Our prospective study included cats diagnosed with LGITL or LPE identified on full‐thickness or endoscopically obtained intestinal biopsy samples with the aim of differentiating these diseases more accurately. A previous study reported that small intestinal full‐thickness surgical biopsy specimens were superior to endoscopic biopsy specimens for differentiating LPE from LGITL because in‐depth lymphocytic infiltration of the intestinal wall was a major diagnostic feature. 13 In our study, the most infiltrated intestinal segment in LGITL and LPE cases was the jejunum (65% and 88%, respectively). Hence, the jejunum was preferentially chosen for biopsy sampling according to ultrasonographic findings (intestinal wall thickening, tunica muscularis thickening in the jejunum, enlarged jejunal lymph nodes). Moreover, jejuno‐ileal localization was consistent with previously published data. 1 , 3 Indeed, only 13% of LGITL lesions were identified in the duodenum and 22% in the ileum. This distribution was the major reason for performing surgical biopsies in our prospective cohort, although at the owner's request, 3 cats underwent only endoscopic biopsy. More than 80% of the LGITL cases were characterized by a diffuse and extensive monomorphic infiltration of small lymphocytes both within the epithelium and the lamina propria, invading at least the submucosa in 68% of the cases. These features already have been reported in the literature. 4 , 9 , 12 , 31 Interestingly, 10 of the 22 cats (45%) with LGITL had certain histopathological features of concomitant inflammatory bowel disease, such as prominent or minor cellular polymorphisms with mixed lymphoid and plasmacytic inflammatory infiltrates, neutrophilic cryptitis, abscesses or some combination of these.
The physiopathology of LPE and LGITL still remains unknown. Partial and deep infiltration of the lamina propria by a polymorphous infiltrate potentially could result from either secondary inflammation or an antitumor reaction to LGITL. Alternatively, the emergence of neoplastic T‐cells may be secondary to chronic inflammation or chronic antigenic stimulation. All LPE cases had polymorphous infiltrates, including lymphocytes, plasma cells, neutrophils, rare eosinophils, and rare macrophages. Only 2 cases (2/22; 9%) had submucosal inflammation, whereas neither muscularis nor serosal infiltrates were noted, in agreement with previous studies. 24 Regarding epitheliotropism, our study confirmed its prevalence in LGITL vs LPE cases (86% and 14%, respectively). This prevalence was higher than observed in a previous study. 12 In agreement with previous studies, 4 , 12 , 13 , 24 , 32 , 33 epithelial patterns (nests and plaques) were significantly more frequent in LGITL than in LPE cases (50% and 5% respectively). This finding raises the question of whether in LPE nests and plaques may precede emergent LGITL. However, even if epitheliotropism and epithelial patterns point toward LGITL, their absence does not exclude the latter. Villous atrophy and crypt hyperplasia also were significantly more frequent in LGITL than in LPE cases and may be a result of more severe mucosal damage in LGITL. Moreover, neutrophilic cryptitis with or without crypt abscesses should not be used to eliminate a diagnosis of LGITL. In our study, 14% of LGITL cases had neutrophilic cryptitis and 27% had crypt abscesses. These findings also support the hypothesis of a continuum between chronic enteritis and emergent LGITL in cats.
We identified an apical‐to‐basal lymphocytic gradient in 41% of LGITL cases. High cellularity in the lamina propria (2‐3 of 3) was more common in LGITL than in LPE cases. However, a previous study described high cellularity in cats with LPE, but infiltration still was higher in alimentary lymphoma cases according to WSAVA guidelines. 27 , 34 The hypothesis of a continuum between LPE and LGITL may be strengthened by these observations. Interestingly, differential fibrosis identified by Masson's trichrome staining discriminated between groups. The extent of lymphocytic infiltration in the lamina propria may explain this specific marked fibrosis in LGITL cases.
Recent studies indicate that low‐grade intestinal lymphoma is of a T‐cell phenotype. 1 , 3 , 17 In our LGITL cohort, the 22 cats were confirmed to have T‐cell low‐grade intestinal lymphoma. The small intestinal lamina propria was diffusely and extensively infiltrated by small T CD3+ lymphocytes in LGITL compared to LPE cases, supporting epitheliotropism and monomorphism in neoplastic T‐cell cases. Furthermore, CD3 labeling highlighted the histologic features described above: apical‐to‐basal gradient, nests, and plaques in LGITL cases. These findings should increase suspicion of LGITL, and warrant systematic study of CD3 expression in this context, emphasizing the focal and superficial T‐cell infiltrate. Regarding the lamina propria, heterogeneous areas of T‐cell clusters were found in LGITL cases (23%) whereas lymphocyte distribution was homogeneous in LPE cases.
As expected, median expression of CD20 (labeling both plasma cells and B‐cell lymphocytes in cats) in the lamina propria was significantly higher in the LPE group compared to the LGITL group (80% vs 30%, respectively). These results reflect the polymorphism associated with chronic inflammatory enteropathies. Interestingly, we observed weak, but diffuse and aberrant, CD20 expression in 30%‐40% of the neoplastic T‐cells in the lamina propria in approximately 45% of LGITL cases. Furthermore, median epithelial expression of CD20 was similar between groups. This finding could result from aberrant expression of B‐cell epitopes by T‐lymphocytes within the epithelium, as suggested in a recent study. 35 Interestingly, aberrant CD20 staining in peripheral T‐cell lymphomas of humans is common and was first described in 1994. 36 Because no significant differences in L1 epitope (myeloid and histiocytic population) expression were detected between groups, we hypothesize that L1 epitope evaluation may not be a useful marker to differentiate LGITL from LPE in cats. However, substantial and significant differences were noted between groups when analyzing Ki67 expression. Intraepithelial expression of Ki67 was significantly higher in the LGITL group compared to the LPE group (20% vs 5%, respectively). A similar difference was observed in the lamina propria between LGITL and LPE cases (30% vs 5%, respectively). Although Ki67 expression previously has been documented in several studies involving other neoplasms, to our knowledge, ours is the first study to establish prospectively a Ki67 expression cut‐off to differentiate LGITL from LPE. Thus, the 20% and 30% thresholds appear to be relevant to discriminate LGITL from LPE in both the epithelium (59% in LGITL vs 4.5% in LPE, specificity >95%), and lamina propria (82% in LGITL vs 32% in LPE, specificity >95%), respectively.
Data from recent literature have shown that LPE cases usually display a polyclonal pattern whereas >90% of LGITL cases exhibit clonal or oligoclonal TCRγ gene rearrangement. 4 , 20 In our study, clonality testing was performed in all LGITL and LPE cases. Fourteen percent of LGITL cases showed TCR polyclonal rearrangement, with 1 case having a strong apical‐to‐basal gradient, and a high percentage of LPE cases showed monoclonality or monoclonality in a polyclonal background. This finding possibly can be explained by the coexistence of neoplastic and inflammatory cells in the same area of the sample, where inflammatory cells react to clonal T‐lymphocytes. Mild neoplastic populations characterized by nests and plaques also could emerge in an inflammatory background. Notably, clonality recently has been questioned in reclassifying doubtful cases. 37 , 38 , 39 In humans, inflammatory bowel disease can be associated with a clonal lymphoid population that is not correlated or predictive of an associated lymphoid neoplasia. 13 , 33 , 40 Moreover, clonal TCR rearrangement frequently is observed among the elderly, 41 but to our knowledge, this finding has not been identified in cats. For now, we still recommend a combination of conventional histopathology and IHC as the gold‐standard diagnostic approach. Thus, in routine practice, quantitative assessment of the epithelium and lamina propria, including immunolabeling for CD3, CD20, and Ki67, may more accurately discriminate LGITL from LPE in cats. Although a clonal rearrangement is present in most LGITL cases, our analyses of T‐cell clonality do not allow us to discriminate between LPE and LGITL.
To gain an understanding of the pathophysiology of T‐cell lymphoproliferation, we focused on the JAK/STAT signaling pathway, constitutively activated in the genesis of several malignant tumors. Indeed, the JAK/STAT pathway is known to promote lymphoid differentiation and proliferation, and its deregulation has emerged over the past years as a major oncogenic mechanism in several T‐ and NK‐leukemia and lymphoma subtypes. 42 We hypothesize that genetic or epigenetic events or both (eg, JAK/STAT pathway deregulation leading to STAT5 activation) may lead to T‐cell clone emergence and promote transformation and expansion. In this context, pSTAT3 negativity associated with pSTAT5 activation could be a new hallmark of LGITL in cats.
Regarding survival analyses, LGITL cats showed shorter (but not statistically different) overall survival times than LPE cats. Both groups included older cats, with frequent comorbidities. Analysis of survival times of 2 slowly progressive diseases (LGITL and LPE) over 1‐2 years should be interpreted with caution, because long survival times have been reported in LGITL cases. 1 Indeed, a significant difference in survival times was not expected. Although LGITL in cats is a lymphoproliferative disorder, it recently has been shown to have an indolent course, as reported in indolent T‐cell lymphoproliferative disorder of humans. 12 Moreover, all LGITL and LPE cases were double‐blindly classified according to the 2016 revision of the WHO classification of lymphoma in humans and the WSAVA classification. 8 , 9 As previously mentioned, this data was recently validated for LGITL cats in an original comparative prospective study. 17
Our study had several limitations. The overrepresentation of jejunal localization should be cautiously interpreted because this choice was justified by previous field experiences. The lesions in LGITL lesions can be unevenly distributed along the small intestine. Thus, it may be difficult to evaluate the actual extent of neoplastic lesions. Furthermore, because full‐thickness biopsy samples had to be of a sufficient size for analysis, their overall numbers were limited and, as a result, localized lymphomatous areas may have been missed. Considering the new macroscopic and molecular criteria, a validation cohort is being recruited prospectively with the aim of validating all of the data. Finally, a larger cohort is needed for survival analysis.
A separate assessment of the epithelium and lamina propria improved histologic and immunohistochemical analyses. New useful histologic criteria included apical‐to‐basal gradient and fibrosis distribution, differentiating LGITL from LPE. Regarding immunophenotyping, as expected, CD3 and Ki67 expression suggested lymphoproliferation. Moreover, the negativity of pSTAT3 associated with strong expression of pSTAT5 in LGITL cases potentially could represent a new hallmark of LGITL. Given the clonality results, the current gold standard tests still should be a combination of conventional histopathology and IHC. Therefore, clinicians should be cautious about reclassifying doubtful lymphoma cases based on PARR results.
CONFLICT OF INTEREST DECLARATION
Dr Maria Elena Turba works at Genefast Laboratory (Italy). Otherwise, the authors declare no conflict of interest with respect to the research, authorship, and publication of this article.
OFF‐LABEL ANTIMICROBIAL USE DECLARATION
Authors declare no off‐label use of antimicrobials.
INSTITUTIONAL ANIMAL CARE AND USE COMMITTEE (IACUC) OR OTHER APPROVAL DECLARATION
Approved by Ecole Nationale Vétérinaire d'Alfort's Ethical Committee (ENVA COMERC n°2017‐05‐09).
HUMAN ETHICS APPROVAL DECLARATION
Authors declare human ethics approval was not needed for this study.
Supporting information
Figure S1 Semiquantitative, 2‐expert assessment of immunohistochemistry staining. Data were considered when the absolute difference between the 2 ratings was ≤5 for the range [0‐10; 90‐100] values and ≤10 for the range [10‐90]. Greater discrepancies were discussed and resolved by consensus. *: the mean number of positive cells per 100 cells in each compartment.
ACKNOWLEDGMENT
No funding was received for this study. We are grateful to Dr Maxence Delverdier and Dr Marie‐Odile Semin (Pathology Department, Ecole Nationale Vétérinaire de Toulouse, France) for their advice.
Freiche V, Paulin MV, Cordonnier N, et al. Histopathologic, phenotypic, and molecular criteria to discriminate low‐grade intestinal T‐cell lymphoma in cats from lymphoplasmacytic enteritis. J Vet Intern Med. 2021;35(6):2673-2684. 10.1111/jvim.16231
REFERENCES
- 1. Paulin MV, Couronne L, Beguin J, et al. Feline low‐grade alimentary lymphoma: an emerging entity and a potential animal model for human disease. BMC Vet Res. 2018;14:306‐319. [DOI] [PMC free article] [PubMed] [Google Scholar]
- 2. Russell KJ, Beatty JA, Dhand N, et al. Feline low‐grade alimentary lymphoma: how common is it? J Feline Med Surg. 2012;14:910‐912. [DOI] [PMC free article] [PubMed] [Google Scholar]
- 3. Lingard AE, Briscoe K, Beatty JA, et al. Low‐grade alimentary lymphoma: clinicopathological findings and response to treatment in 17 cases. J Feline Med Surg. 2009;11:692‐700. [DOI] [PMC free article] [PubMed] [Google Scholar]
- 4. Moore PF, Rodriguez‐Bertos A, Kass PH. Feline gastrointestinal lymphoma: mucosal architecture, immunophenotype, and molecular clonality. Vet Pathol. 2012;49:658‐668. [DOI] [PubMed] [Google Scholar]
- 5. Evans SE, Bonczynski JJ, Broussard JD, et al. Comparison of endoscopic and full‐thickness biopsy specimens for diagnosis of inflammatory bowel disease and alimentary tract lymphoma in cats. J Am Vet Med Assoc. 2006;229:1447‐1450. [DOI] [PubMed] [Google Scholar]
- 6. Norsworthy GD, Estep JS, Hollinger C, et al. Prevalence and underlying causes of histologic abnormalities in cats suspected to have chronic small bowel disease: 300 cases (2008‐2013). J Am Vet Med Assoc. 2015;247:629‐635. [DOI] [PubMed] [Google Scholar]
- 7. Washabau RJ, Day MJ, Willard MD, et al. Endoscopic, biopsy, and histopathologic guidelines for the evaluation of gastrointestinal inflammation in companion animals. J Vet Intern Med. 2010;24:10‐26. [DOI] [PubMed] [Google Scholar]
- 8. Swerdlow SH, Campo E, Pileri SA, et al. The 2016 revision of the World Health Organization classification of lymphoid neoplasms. Blood. 2016;127:2375‐2390. [DOI] [PMC free article] [PubMed] [Google Scholar]
- 9. Briscoe KA, Krockenberger M, Beatty JA, et al. Histopathological and immunohistochemical evaluation of 53 cases of feline lymphoplasmacytic enteritis and low‐grade alimentary lymphoma. J Comp Pathol. 2011;145:187‐198. [DOI] [PubMed] [Google Scholar]
- 10. Waly NE, Gruffydd‐Jones TJ, Stokes CR, et al. Immunohistochemical diagnosis of alimentary lymphomas and severe intestinal inflammation in cats. J Comp Pathol. 2005;133:253‐260. [DOI] [PubMed] [Google Scholar]
- 11. Vail DM, Moore AS, Ogilvie GK, et al. Feline lymphoma (145 cases): proliferation indices, cluster of differentiation 3 immunoreactivity, and their association with prognosis in 90 cats. J Vet Intern Med. 1998;12:349‐354. [DOI] [PubMed] [Google Scholar]
- 12. Carreras JK, Goldschmidt M, Lamb M, et al. Feline epitheliotropic intestinal malignant lymphoma: 10 cases (1997‐2000). J Vet Intern Med. 2003;17:326‐331. [DOI] [PubMed] [Google Scholar]
- 13. Kiupel M, Smedley RC, Pfent C, et al. Diagnostic algorithm to differentiate lymphoma from inflammation in feline small intestinal biopsy samples. Vet Pathol. 2011;48:212‐222. [DOI] [PubMed] [Google Scholar]
- 14. Gianella P, Pietra M, Crisi PE, et al. Evaluation of clinicopathological features in cats with chronic gastrointestinal signs. Pol J Vet Sci. 2017;20:403‐410. [DOI] [PubMed] [Google Scholar]
- 15. Sharma A, Oishi N, Boddicker RL, et al. Recurrent STAT3‐JAK2 fusions in indolent T‐cell lymphoproliferative disorder of the gastrointestinal tract. Blood. 2018;131:2262‐2266. [DOI] [PMC free article] [PubMed] [Google Scholar]
- 16. Soderquist CR, Patel N, Murty VV, et al. Genetic and phenotypic characterization of indolent T‐cell lymphoproliferative disorders of the gastrointestinal tract. Haematologica. 2020;105:1895‐1906. [DOI] [PMC free article] [PubMed] [Google Scholar]
- 17. Freiche V, Cordonnier N, Paulin MV, et al. Feline low‐grade intestinal T cell lymphoma: a unique natural model of human indolent T cell lymphoproliferative disorder of the gastrointestinal tract. Lab Invest. 2021;101:794‐804. [DOI] [PubMed] [Google Scholar]
- 18. Sabattini S, Bottero E, Turba ME, et al. Differentiating feline inflammatory bowel disease from alimentary lymphoma in duodenal endoscopic biopsies. J Small Anim Pract. 2016;57:396‐401. [DOI] [PubMed] [Google Scholar]
- 19. Keller SM, Vernau W, Moore PF. Clonality testing in veterinary medicine: a review with diagnostic guidelines. Vet Pathol. 2016;53:711‐725. [DOI] [PubMed] [Google Scholar]
- 20. Moore PF, Woo JC, Vernau W, et al. Characterization of feline T cell receptor gamma (TCRG) variable region genes for the molecular diagnosis of feline intestinal T cell lymphoma. Vet Immunol Immunopathol. 2005;106:167‐178. [DOI] [PubMed] [Google Scholar]
- 21. Hammer SE, Groiss S, Fuchs‐Baumgartinger A, et al. Characterization of a PCR‐based lymphocyte clonality assay as a complementary tool for the diagnosis of feline lymphoma. Vet Comp Oncol. 2017;15:1354‐1369. [DOI] [PubMed] [Google Scholar]
- 22. Werner JA, Woo JC, Vernau W, et al. Characterization of feline immunoglobulin heavy chain variable region genes for the molecular diagnosis of B‐cell neoplasia. Vet Pathol. 2005;42:596‐607. [DOI] [PubMed] [Google Scholar]
- 23. Barrs VR, Beatty JA. Feline alimentary lymphoma: 1. Classification, risk factors, clinical signs and non‐invasive diagnostics. J Feline Med Surg. 2012;14:182‐190. [DOI] [PMC free article] [PubMed] [Google Scholar]
- 24. Jergens AE. Feline idiopathic inflammatory bowel disease: what we know and what remains to be unraveled. J Feline Med Surg. 2012;14:445‐458. [DOI] [PMC free article] [PubMed] [Google Scholar]
- 25. Freiche V, Fages J, Paulin MV, et al. Clinical, laboratory data and ultrasonographic features differentiating feline low‐grade intestinal T‐cell lymphoma from lymphoplasmacytic enteritis. J Vet Intern Med. 2021. Review process phase (companion article). [DOI] [PMC free article] [PubMed] [Google Scholar]
- 26. Wolfesberger B, Fuchs‐Baumgartinger A, Gress V, et al. World Health Organisation classification of lymphoid tumours in veterinary and human medicine: a comparative evaluation of gastrointestinal lymphomas in 61 cats. J Comp Pathol. 2018;159:1‐10. [DOI] [PubMed] [Google Scholar]
- 27. Jergens AE, Willard MD, Allenspach K. Maximizing the diagnostic utility of endoscopic biopsy in dogs and cats with gastrointestinal disease. Vet J. 2016;214:50‐60. [DOI] [PubMed] [Google Scholar]
- 28. Willard MD, Jergens AE, Duncan RB, et al. Interobserver variation among histopathologic evaluations of intestinal tissues from dogs and cats. J Am Vet Med Assoc. 2002;220:1177‐1182. [DOI] [PubMed] [Google Scholar]
- 29. Renshaw AA. Measuring and reporting errors in surgical pathology. Lessons from gynecologic cytology. Am J Clin Pathol. 2001;115:338‐341. [DOI] [PubMed] [Google Scholar]
- 30. Kiselow MA, Rassnick KM, McDonough SP, et al. Outcome of cats with low‐grade lymphocytic lymphoma: 41 cases (1995‐2005). J Am Vet Med Assoc. 2008;232:405‐410. [DOI] [PubMed] [Google Scholar]
- 31. Gieger T. Alimentary lymphoma in cats and dogs. Vet Clin North Am Small Anim Pract. 2011;41:419‐432. [DOI] [PubMed] [Google Scholar]
- 32. Swanson CM, Smedley RC, Saavedra PV, et al. Expression of the Bcl‐2 apoptotic marker in cats diagnosed with inflammatory bowel disease and gastrointestinal lymphoma. J Feline Med Surg. 2012;14:741‐745. [DOI] [PMC free article] [PubMed] [Google Scholar]
- 33. Andrews C, Operacz M, Maes R, et al. Cross lineage rearrangement in feline enteropathy‐associated T‐cell lymphoma. Vet Pathol. 2016;53:559‐562. [DOI] [PubMed] [Google Scholar]
- 34. Day MJ, Bilzer T, Mansell J, et al. Histopathological standards for the diagnosis of gastrointestinal inflammation in endoscopic biopsy samples from the dog and cat: a report from the World Small Animal Veterinary Association Gastrointestinal Standardization Group. J Comp Pathol. 2008;138(Suppl 1):S1‐S43. [DOI] [PubMed] [Google Scholar]
- 35. Noland EL, Kiupel M. Coexpression of CD3 and CD20 in canine enteropathy‐associated T‐cell lymphoma. Vet Pathol. 2018;55:241‐244. [DOI] [PubMed] [Google Scholar]
- 36. Matnani RG, Stewart RL, Pulliam J, et al. Peripheral T‐cell lymphoma with aberrant expression of CD19, CD20, and CD79a: case report and literature review. Case Rep Hematol. 2013;2013:183134. [DOI] [PMC free article] [PubMed] [Google Scholar]
- 37. Freiche V. Novel extensive characterization of feline low‐grade T‐cell intestinal lymphoma. In: Proceeding of the ECVIM 2019 Congress; September 2019‐2021; Milan, Italy; 2019.
- 38. Freiche V, Cordonnier N, Turba ME, et al. Feline T‐cell low‐grade intestinal lymphoma: a novel model of lymphomagenesis according to the One‐Health concept. In: 2020 ACVIM Forum on Demand Research Abstract Program. J Vet Intern Med. 2020;34:2830. [Google Scholar]
- 39. Chow B, Hill SL, Richter KP, et al. Comprehensive comparison of upper and lower endoscopic small intestinal biopsy in cats with chronic enteropathy. J Vet Intern Med. 2021;35:190‐198. [DOI] [PMC free article] [PubMed] [Google Scholar]
- 40. Doorenspleet ME, Westera L, Peters CP, et al. Profoundly expanded T‐cell clones in the inflamed and uninflamed intestine of patients with Crohn's disease. J Crohns Colitis. 2017;11:831‐839. [DOI] [PubMed] [Google Scholar]
- 41. Posnett DN, Sinha R, Kabak S, et al. Clonal populations of T cells in normal elderly humans: the T cell equivalent to “benign monoclonal gammapathy”. J Exp Med. 1994;179:609‐618. [DOI] [PMC free article] [PubMed] [Google Scholar]
- 42. Waldmann TA, Chen J. Disorders of the JAK/STAT pathway in T cell lymphoma pathogenesis: implications for immunotherapy. Annu Rev Immunol. 2017;35:533‐550. [DOI] [PMC free article] [PubMed] [Google Scholar]
Associated Data
This section collects any data citations, data availability statements, or supplementary materials included in this article.
Supplementary Materials
Figure S1 Semiquantitative, 2‐expert assessment of immunohistochemistry staining. Data were considered when the absolute difference between the 2 ratings was ≤5 for the range [0‐10; 90‐100] values and ≤10 for the range [10‐90]. Greater discrepancies were discussed and resolved by consensus. *: the mean number of positive cells per 100 cells in each compartment.