

Abstract
The solubilities of clemastine fumarate in supercritical carbon dioxide (ScCO2) were measured for the first time at temperature (308 to 338 K) and pressure (12 to 27 MPa). The measured solubilities were reported in terms of mole faction (mol/mol total) and it had a range from 1.61 × 10⁻⁶ to 9.41 × 10⁻⁶. Various models were used to correlate the data. The efficacy of the models was quantified with corrected Akaike’s information criterion (AICc). A new cluster salvation model was derived to correlate the solubility data. The new model was able to correlate the data and deviation was 10.3% in terms of average absolute relative deviation (AARD). Furthermore, the measured solubilities were also correlated with existing K.-W. Chen et al., model, equation of state model and a few other density models. Among density models, Reddy and Garlapati model was observed to be the best model and corresponding AARD was 7.57% (corresponding AICc was − 678.88). The temperature independent Peng–Robinson equation of state was able to correlate the data and AARD was 8.25% (corresponding AICc was − 674.88). Thermodynamic parameters like heats of reaction, sublimation and solvation of clemastine fumarate were calculated and reported.
Subject terms: Chemical engineering, Chemical engineering
Introduction
The clemastine fumarate is a special drug and it has specific uses. It is an antihistamine with antimuscarinic and partial sedative properties. One of its forms also acts an antileishmanial drug. It also stimulates a macrophage response to leishmaniainfection1. For all the medical studies (for both in vivo and in vitro) a proper dosage is very essential and this may be achieved through proper particle size1. The usage of supercritical fluid technology in particle micronisation has gained significant importance in the recent times, wherein, carbon dioxide as a supercritical fluid has been used widely in practice2. The application of carbon dioxide as supercritical fluid solvent has several advantages over conventional solvents2 and it is designated as ScCO2. It possesses attractive physical properties such as, gas like diffusivity and liquid like density with low viscosity and surface tension2,3. By adjusting pressures and temperatures, one can tune the density of ScCO2 as desired and it is exploited in various applications. Due to this tunable nature, it has been used as a solvent in various process applications. ScCO2’s major applications include drug particle micronization, extraction, reactions, food processing, textile dyeing, ceramic coating, and many more4–8. To implement SFT, one needs to have exact phase equilibrium information such as saturation solubility. Solubility is one of the basic information that is essential for the design and development of SFT. Drug particle micronization requires precise solubility information and in literature, solubility of many solid drugs9,10 in ScCO2 is readily available, however, the solubility of clemastine fumarate is not reported. Therefore, for the first time, the solubility of clemastine fumarate in ScCO2 is reported in this work. We believe that this study may be useful in particle micronization using ScCO2.
The main objectives of the present work are in two stages; in the first stage we determine solubility of clemastine fumarate. Since, measuring experimental solubility data at each pressure and temperature is very difficult, we need a proper model to generate the solubility data11. Thereby, in the second stage we have developed a new cluster solubility model. The proposed model is compared with existing cluster solvation model. Furthermore, few density models and equation of state model are evaluated.
Experimental
Materials
Gaseous CO2 (purity > 99.9%) was obtained from Fadak company, Kashan (Iran), clemastine fumarate (CAS Number: 14976-57-9, purity > 99%) was obtained from Amin Pharma company. Methanol (CAS No. 67-56-1, purity > 99.9%) was obtained from Sigma Aldrich company. Table 1 indicates all the information about the chemicals utilized in this work. The molecular formula of clemastine fumarate is C21H26ClNO·C4H4O4 and its molecular weight is 459.97. The chemical structure is shown in Fig. 1.
Table 1.
Basic properties of the used materials.
| Compound | Formula | MW (g/mol) | Tm (K) | λmax (nm) | CAS number | Minimum purity by supplier (%) |
|---|---|---|---|---|---|---|
| Clemastine Fumarate | C21H26ClNO·C4H4O4 | 459.96 | 451.15 | 270 | 14976-57-9 | 99 |
| Carbon dioxide | CO2 | 44.01 | 124-38-9 | 99.99 | ||
| Methanol | CH3OH | 32.04 | 67-56-1 | 99.9 |
Figure 1.
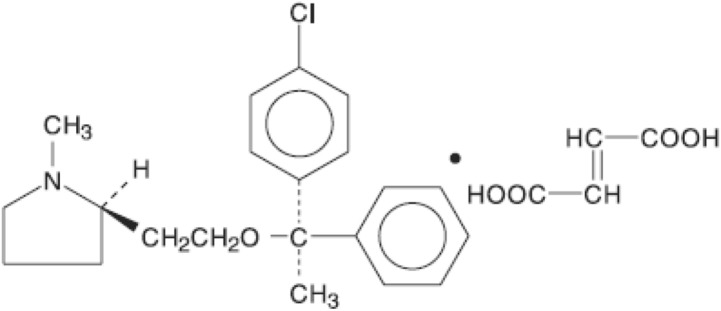
Chemical structure of clemastine fumarate.
Experiment details
Figure 2 shows the line diagram of the equipment used in the study. More details about the solubility measuring device have been presented in our earlier studies12–20. However, a brief outline of the same has been presented in this section. This measuring methodology may be classified as an isobaric-isothermal method21. Each reading has been reported by controlling temperature and pressure at desired values within ± 0.1 K and ± 0.1 MPa precision, respectively. For each experiment about 1 g of clemastine fumarate drug has been used in the static cell. The saturation samples have been collected from the static cell after equilibrating for 60 min. Our earlier studies indicated that 60 min is enough for equilibrium. After equilibrium, saturated ScCO2 samples (600 µL) have been collected via 2-status 6-way port valve in a methanol preloaded vial. Once a sample was collected, the port valve was washed with 1 mL methanol. Thus, the total saturation solution obtained was 5 mL. Each measurement has been repeated thrice and average readings were reported. For calculations, the following formulas have been used12–20.
| 1 |
where denotes the quantity of the drug, and denotes the quantity of CO2 in the sampling loop.
Figure 2.

Line diagram of the solubility measurement device, E-1—CO2 cylinder; E-2—Filter; E-3—Refrigerator unit; E-4—Air compressor; E-5—High pressure pump; E-6—Equilibrium cell; E-7—Magnetic stirrer; E-8—Needle valve; E-9—Back-pressure valve; E-10—Six-port, two position valve; E-11—Oven; E-12—Syringe; E13—Collection vial; E-14—Control panel.
Further, we quantify moles of drug and moles of CO2 as
| 2 |
| 3 |
where denotes the drug concentration in saturated sample vial in g/L. The volume of sampling loop, Vs = 5 × 10⁻³ m3 and vial collection, V1 = 600 × 10–6 m3. The and denote the molecular weight of drug and CO2, respectively. Solubility is also described as
| 4 |
The relation between S and is explained as
| 5 |
To ensure equilibrium solubility, the experiments were performed with fresh samples at various time intervals. For a specified temperature and pressure in each experiment, the drug sample was contacted with ScCO2 and stirred thoroughly in an equilibrium cell until a specific time (5 min, 10 min, 20 min, 30 min, 40 min, 50 min and 60 min) and the solubility readings were recorded. It was observed that the solubility was independent of time after 30 min. This experimental setup has already been validated in our previous works with alpha-tocopherol and naphthalene17.
A UV–visible (UNICO-4802) spectrophotometer has been used for the measurements of clemastine fumarate solubility. Samples collected for analysis in methanol solvent were analyzed at 270 nm.
Models
In this section, a brief note about the existing density models and their mathematical form were presented.
Existing empirical and semi-empirical models
Alwi–Garlapati model22
It is a semi-empirical model. It has three parameters. According to this, solubility is represented as a function of reduced temperature and reduced density and it is mathematically stated as
| 6 |
where are model constants.
Bartle et al., model23
It is based on enhancement factor concept and it has three parameters. According to this, solubility is represented as a function of pressure, temperature and density and it is mathematically stated as
| 7 |
where are model constants. From parameter one can estimate sublimation enthalpy using the relation, in which R is universal gas constant. Reference pressure (Pref) and density are 0.1 MPa and 700 kg/m3, respectively.
Bian et al., model24
It is a five parameter model. It is an empirical model and it is mathematically stated as
| 8 |
where are model constants.
Chrastil model25
It is a three parameter model. It is a semi empirical model and it is mathematically stated as
| 9 |
where are model constants.
In terms of mole fraction it is mathematically stated as
| 9a |
Reformulated Chrastil model26,27
It is also a three parameter model. It is a semi-empirical model and it is mathematically stated as
| 10 |
where are model constants. Reference fugacity () is 0.1 MPa.
Garlapati–Madras model28
It is a five parameter model. It is a mathematical model and it is mathematically stated as
| 11 |
where are model constants.
Mendez–Teja model (MT model)29
It is a semi-empirical model and it has three parameters. It is mathematically stated as
| 12 |
where are model constants.
Equation (12) is used in checking self-consistency of the measured solubility data. Accordingly, all the data points lie on a line when they are plotted versus .
Sodefian et al., model30
It is a mathematical model and it has six parameters and it is mathematically stated as
| 13 |
where are model constants.
Reddy–Garlapati model9
It is based on degree of freedom. It is a six parameter model. It is an empirical model and it is mathematically stated as
| 14 |
where are model constants.
Mahesh–Garlapati model11
It is based on degree of freedom. It is a three parameter model. It is an empirical model and it is mathematically stated as
| 15 |
Equation of state (EoS) model
The solubility of clemastine fumarate drug, (solute), in a supercritical carbon dioxide, (solvent), is expressed as31
| 16 |
where is solute sublimation pressure; is solute molar volume; The fugacity coefficient of the pure solute at saturation () is usually taken to be unity. In this work, is the fugacity coefficient of the solute in the solvent phase. is calculated using Peng–Robinson (PR) EoS along with two parameter van der Waals mixing rule (vdW2)32. The expression used for calculation of is obtained from the following basic thermodynamic relation33.
| 17 |
The general PREoS form32 is
| 18 |
The pure component parameters a and b are
| 19 |
| 20 |
The expression for is:
| 21 |
The expressions for VdW2
| 22 |
| 23 |
| 24 |
| 25 |
The PR EoS regression may be carried out either temperature independent or temperature dependent. For temperature independent regression suitable sublimation expression is used. The general form34,35 used for the regression purpose is
| 26 |
The regression directly results in binary interaction parameters along with sublimation pressure expression coefficients (, and ) and from parameters and we can estimate sublimation pressure. The expression for sublimation enthalpy is
| 27 |
K.-W. Chen et al., cluster model36
According to the model, the formation of solvate complex is due to the reaction mentioned in Eq. (28), where A is solute and B is supercritical fluid.
| 28 |
It is an equilibrium reaction and at equilibrium the following condition is satisfied.
| 29 |
where is summation; and are stoichiometric coefficient and partial molar Gibbs energy, respectively.
In general the partial molar Gibbs energy for species is written as
| 30 |
where and are reference state pressure and composition of species “i”. The reference pressure is taken as critical pressure of the supercritical fluid and finally the expression for the equilibrium in terms of fugacity coefficients is
| 31 |
where is the change in Gibbs energy as a result of formation of solvate complex.
The model has two parameters and . K.-W. Chen et al.35, used the following temperature dependent general form36 in place of
| 32 |
Thus the final model has , and (three adjustable parameters).
The Eq. (31) is further simplified with the help of Taylor series on left hand side
| 33 |
The experimental solubility and cluster mole fractions are related as37,38 follows
| 34 |
The fugacity coefficient of the components and mixtures are evaluated with PR EoS. For fugacity coefficient calculations we need mixture properties and they are calculated with the help of solute, solvent and cluster volume and energy parameter. More details about these can be seen elsewhere36–38.
The cluster obeys the following mixing rules for volume and energy parameters
| 35 |
| 36 |
More details about PR EoS, fugacity coefficient of pure component and mixture can be seen in section “Equation of state (EoS) model” and literature37,38.
The final expression for the solubility is
| 37 |
New cluster model
This model is an extension to existing K.-W. Chen et al., model36. According to the model the formation of solvate complex is according to the reaction mention in Eq. (38), where A is solute and B is supercritical fluid.
| 38 |
For the solubility model development we have used all arguments similar to that of K.-W. Chen et al., model. The main difference between K–W. Chen et al. model and the new cluster model lies in selection of temperature dependent general form. The considered temperature dependent general form is 39
| 39 |
Thus, the final model has four adjustable parameters ,, and .
Follow in K.-W. Chen et al., footsteps we get the final expression for the solubility as
| 40 |
Hereafter it may be called as cluster model by Sodeifian et al. The major advantage of Eq. (40) over Eq. (37) lies in improved parameterization and efficacy.
For implementing EoS and cluster models we need critical properties and vapour pressures, and they are estimated with the help of group contribution methods. Critical temperature is estimated by Fedors method40,41, critical pressure is estimated by Joback modification of Lydersen’s method41. The acentric factor is estimated by Lee–Kesler vapour pressure relations. While calculating vapour pressure, the normal boiling temperature (at 1.0 atm) is required and it is estimated from Klincewicz relation, Tc = 50.2–0.16 M + 1.41 Tb were M is molecular weight41. The required molar volume of drug (solid) is estimated by Immirzi, A.; Perini, B method42,43 and the vapour pressures are estimated by Lee–Kesler vapour method41.
All the models mentioned in sections “Existing empirical and semi-empirical models”, “Equation of state (EoS) model”, “K.-W. Chen et al., cluster model36” and “New cluster model” are evaluated with the following objective function44.
| 41 |
Regression results are represented in terms of average absolute relative deviation percentage (AARD %)
| 42 |
where N is number of experimental data points; is mole fraction; the superscripts cal and exp denote thecalculated and measured mole fractions, respectively.
The correlating ability of a model depends on the number of its parameter. The Akaike’s information criterion (AIC)45–49 is used to assess the correlating efficacy of a model regardless of the number of its parameters.
| 43 |
where N is number of experimental data points; is model parameters; SSE is error sum of squares.
When N is less than 40 corrected AIC is used and it is stated as follows
| 44 |
Results and discussion
Table 1 indicates some properties of the used materials. Table 2 shows clemastine fumarate solubility in ScCO2. The density indicated in Table 2 is obtained from the NIST data base50. Computed properties of clemastine fumarate are shown in Table 3. Figure 3 indicates the effect of pressure on various isotherms and no cross over region observed, such solubility behavior is observed for some other pharmaceutical compounds in our earlier studies14. From Table 3, it is clear that the vapor pressure of clemastine fumarate increases from 0.0114 Pa to 0.1277 Pa, when the temperature is increased from 308 to 338 K, it is a 11.2 fold jump. Due to this, solubility increases from 0.0161 × 10⁻⁴ to 0.0359 × 10⁻⁴ (in mole/mole total) at 12 MPa (it is a 2.23 fold jump) and 0.051 × 10⁻⁴ to 0.0941 × 10⁻⁴ (in mole/mole total) at 27 MPa (it is a 1.845 fold jump). At the same time, densities have changed from 769 kg m-3 (corresponding to 308 K and 12 MPa) to 338 kg m-3 (corresponding to 338 K and 12 MPa) and 914 kg m-3 (corresponding to 308 K and 27 MPa) to 783 kg m-3 (corresponding to 338 K and 27 MPa),which clearly indicates that density decreases at 12 MPa (i.e., 338/769 = 0.4395) and somewhat increases at 27 MPa (i.e., 783/914 = 0.8567). From preceding arguments we say that the pressure effect is less pronounced with respect to density than the temperature effect. This kind of nonlinearity is well captured with models having more parameters compared to less number of parameter14. Therefore, models proposed by Sodeifian et al. model and Reddy–Garlapati model are able to correlate the solubility in a better manner. Figure 4 indicates the self-consistency of the measured data with MT model.
Table 2.
Solubility of Clemastine Fumarate in ScCO2 at various temperatures and pressures (the experimental standard deviation was obtained by . Expanded uncertainty (U) = k*ucombined and the relative combined standard uncertainty ucombined/y = .
| Temperature (K)a | Pressure (MPa)a | Density of SC-CO2 (kg/m3) [2] | y2 × 104 (Mole fraction) | Experimental standard deviation, S(ȳ) × (104) | S (equilibrium solubility) (g/L) | Expanded uncertainty of Mole fraction (104 U) |
|---|---|---|---|---|---|---|
| 308 | 12 | 769 | 0.0161 | 0.0005 | 0.0130 | 0.0012 |
| 15 | 817 | 0.0202 | 0.0010 | 0.0173 | 0.0022 | |
| 18 | 849 | 0.0247 | 0.0010 | 0.0219 | 0.0023 | |
| 21 | 875 | 0.0284 | 0.0008 | 0.0260 | 0.0020 | |
| 24 | 896 | 0.0384 | 0.0002 | 0.0360 | 0.0017 | |
| 27 | 914 | 0.051 | 0.0010 | 0.0488 | 0.0030 | |
| 318 | 12 | 661 | 0.0248 | 0.0006 | 0.0171 | 0.0017 |
| 15 | 744 | 0.0395 | 0.0005 | 0.0307 | 0.0021 | |
| 18 | 791 | 0.0431 | 0.0020 | 0.0357 | 0.0044 | |
| 21 | 824 | 0.0513 | 0.0020 | 0.0442 | 0.0046 | |
| 24 | 851 | 0.0599 | 0.0009 | 0.0532 | 0.0032 | |
| 27 | 872 | 0.0697 | 0.0020 | 0.0636 | 0.0050 | |
| 328 | 12 | 509 | 0.0282 | 0.0010 | 0.0150 | 0.0024 |
| 15 | 656 | 0.0414 | 0.0008 | 0.0284 | 0.0025 | |
| 18 | 725 | 0.0471 | 0.0020 | 0.0357 | 0.0045 | |
| 21 | 769 | 0.0558 | 0.0010 | 0.0449 | 0.0032 | |
| 24 | 802 | 0.0778 | 0.0030 | 0.0652 | 0.0069 | |
| 27 | 829 | 0.0886 | 0.0040 | 0.0767 | 0.0089 | |
| 338 | 12 | 388 | 0.0359 | 0.0010 | 0.0145 | 0.0026 |
| 15 | 557 | 0.046 | 0.0020 | 0.0268 | 0.0045 | |
| 18 | 652 | 0.0515 | 0.0007 | 0.0351 | 0.0027 | |
| 21 | 710 | 0.0593 | 0.0010 | 0.0440 | 0.0033 | |
| 24 | 751 | 0.086 | 0.0040 | 0.0676 | 0.0087 | |
| 27 | 783 | 0.0941 | 0.0030 | 0.0771 | 0.0073 |
aStandard uncertainty u are u(T) = ± 0.1 K; u(p) = ± 0.1 MPa. The value of the coverage factor k = 2 was chosen on the basis of the level of confidence of approximately 95 percent.
Table 3.
Properties of Clemastine fumarate and CO2a.
| Substance | Tc (K) | Pc (MPa) | Vs × 10–4 (m3/mol) | T (K) | ||||
|---|---|---|---|---|---|---|---|---|
| Psub (Pa)f | ||||||||
| 308 | 318 | 328 | 338 | |||||
| Clemastine Fumarate | 901.25b | 1.409c | 0.337d | 364.764e | 0.0114 | 0.02699 | 0.0603 | 0.1277 |
| CO2 | 304.18 | 7.38 | 0.225 | |||||
aCritical temperature: Tc; Critical pressure: Pc; Acentric factor: ω; Solid molar volume: Vs; Temperature: T.
bEstimated by Fedors method40,41.
cEstimated by the Joback modification of Lydersen’s method41.
dEstimated by Lee–Kesler vapour pressure relations. (Note: The required normal boiling temperature (at 1.0 atm), Tb is estimated with Klincewicz relation, Tc = 50.2–0.16 M + 1.41 Tb were M is molecular weight)41.
eEstimated by Immirzi, A.; Perini, B method42,43.
fEstimated by Lee–Kesler vapour method41.
Figure 3.

Clemastine fumaratesolubility in ScCO2 and effect of pressure on isotherms.
Figure 4.

Self-consistency plot of clemastine fumarate solubility in ScCO2. Symbols are experimental points; line is calculated with MT Model.
The regression analysis of experimental data is carried out easily with density model, but the regression analysis of EoS model and cluster model requires critical properties of the solute and solvent. The required critical temperature, critical pressure, acentric factor and molar volume of the solute and sublimation pressure of the solute are not readily available; due to this these properties are computed with standard group contribution methods39–42. The empirical and semi empirical models considered in this study have shown different degree of fitting in terms of AARD%. The regression results of various models are indicated in Tables 4, 5 and 6. Among the existing empirical and semi-empirical models, Reddy–Garlapati model is having lower AARD%. Chrastil model parameter () and Reformulated Chrastil model parameter () are used in calculating total enthalpy, from Bartel et al., model parameter () we get sublimation enthalpy of the clemastine fumarate. Heat of solvation is obtained from the magnitude difference between total enthalpy and sublimation enthalpy. The more details about these calculations can be seen in literature34. All the computed results are reported in Table 7. EoS model is regressed in two different ways. In the first approach correlation parameter are treated as temperature dependent where as in second approach the correlation parameters are treated as temperature independent. From regression results (Table 5) temperature independent correlation is better than temperature dependent correlation. EoS model also provide sublimation enthalpy and it is reported in Table 7. From Table 6 it is clear that the cluster model by sodeifian et al., is superior to exiting K.-W. Chen et al., model. The parameters ‘’ and ‘’ of cluster model by sodeifian et al., directly results in enthalpy change and entropy change of the cluster formation process. The positive sign for entropy change indicates an increase in disorder. The positive change in enthalpy indicates heat absorption from surroundings the by the reaction. The correlating ability of the various models is represented in Figs. 4, 5, 6, 7, 8 and 9.
Table 4.
Correlation constants for the exiting empirical models.
| Model | Correlation parameters | AARD% | R2 | ||
|---|---|---|---|---|---|
| Alwi–Garlapati model | A1 = 1.8759; A2 = − 18.105; A3 = 2.0667 | 14.00 | 0.809 | ||
| Bartel et al., model | B1 = 14.719; B2 = − 7179.9; B3 = 6.6739 × 10⁻³ | 20.2 | 0.765 | ||
| Bian et al., model | = − 4.9614; = 5.5723 × 10⁻³; = 2030.5; = − 9.9873; = 9.6915 | 11.2 | 0.927 | ||
| Chrastil model | = 3.0938; = − 11.003; = − 4907.2 | 16.7 | 0.785 | ||
| Ref. Chrastil model | = 3.0813; = − 21.619; = − 4216.6 | 16.7 | 0.784 | ||
| Garlapati–Madras model | = − 755.12; = 859.01; = 0.9875; = − 8597.4; = − 10.722 | 14.6 | 0.818 | ||
| Mendez–Teja model | = − 8479.4; = 1.9629; = 14.617 | 21.69 | 0.706 | ||
| Sodeifian et al., model | = − 42.487; = − 6.9315 × 10⁻⁴; = 2.4265; = − 4.2127 × 10⁻⁴; = 1.929 × 10⁻²; = 62.052 | 8.78 | 0.929 | ||
| Tippana–Garlapati model | = 8.334 × 10⁻⁷; = 1.3157 × 10⁻⁵; = − 3.3583 × 10⁻⁷; = 5.6805 × 10⁻⁷; = − 1.3913 × 10⁻⁵; = 7.7736 × 10⁻⁷ | 7.57 | 0.951 | ||
| Mahesh–Garlapati model | = − 14.614; = − 2.4145; = 3.3127 | 17.9 | 0.797 | ||
Table 5.
Correlation constants of PR EoS + VdW2 combination.
| Model | Correlation parameters | T = 308 K | T = 318 K | T = 328 K | T = 338 K |
|---|---|---|---|---|---|
| Temperature dependent parameters | |||||
| PREoS-VdW2 temperature dependent parameters | 0.58814 | 0.55098 | 0.55315 | 0.53741 | |
| 0.5856 | 0.52813 | 0.52218 | 0.48034 | ||
| AARD% | 3.99 | 2.5572 | 7.5542 | 13.067 | |
| Temperature independent parameters | |||||
| PREoS-VdW2 temperature independent parameters | 0.79788 | ||||
| 0.74029 | |||||
| 0.27409 | |||||
| − 221.54 | |||||
| 11.305 | |||||
| AARD% | 8.2458 | ||||
Table 6.
Correlation constants of cluster models.
| Model | Correlation parameters | AARD% | R2 |
|---|---|---|---|
| New model | = 0.10756; = 443,590; = 1357.1; = − 9115.7 | 10.3 | 0.936 |
| K.-W. Chen et al., model | = 0.10794; = 6093.7; = − 70.319 | 12.1 | 0.913 |
Table 7.
Summary of thermodynamic properties.
| Model | Property | ||
|---|---|---|---|
| Total enthalpy, ΔHtotal (kJ/mol) | Enthalpy of sublimation ΔHsub (kJ/mol) | Enthalpy of solvation, (kJ/mol) | |
| Chrastil model | 40.798a | − 18.896e; − 12.282f | |
| Reformulated Chrastil Model | 35.056b |
− 24.638g − 6.54h |
|
| Bartle et al., model | 59.694c (approximate value) | ||
|
PR EoS + vdW2 model As temperature independent |
28.516d (average value) | ||
eObtained as a result of difference between the ΔHsubc and ΔHtotala.
fObtained as a result between the ΔHsubd and ΔHtotala.
gObtained as a result of difference between the ΔHsubc and ΔHtotalb.
hObtained as a result between the ΔHsubd and ΔHtotalb.
Figure 5.

Solubility ofclemastine fumarate in ScCO2. Symbols are experimental points; lines are calculated with three parameter models.
Figure 6.

Solubility of clemastine fumarate in ScCO2. Symbols are experimental points; lines are calculated with five parameter models.
Figure 7.

Solubility of clemastine fumarate in ScCO2. Symbols are experimental points; lines are calculated with six parameter models.
Figure 8.

Solubility of clemastine fumarate in ScCO2. Symbols are experimental points; lines are calculated with PREoS models.
Figure 9.

Solubility of clemastine fumarate in ScCO2. Symbols are experimental points; lines are calculated with cluster models.
The models used in correlation exercise, have a varying number of parameters and the best model is obtained with the help of Akaike’s information criterion (AIC) 45–49. The data used in this exercise is small (N < 40), hence corrected AIC (AICc) is used for the identifying the best model. The model that gives lowest AICc value, is the best model. Table 8 indicates computed AIC and AICc values. The least AICc value − 678.88 is seen for Reddy–Garlapati model; therefore, it is considered as the best model, however, the new cluster model has also comparable performance with the best model, the corresponding AICc value is − 678.59. The highest AICc value is seen for Alwi-Garlapati, model hence it is treated as poor model for clemastine fumarate.
Table 8.
Computed AIC and AICc values.
| Model | SSE.1011 | Np | N | AIC | AICc |
|---|---|---|---|---|---|
| Existing density models | |||||
| Alwi–Garlapati model | 2.41888 | 3 | 24 | − 636.5 | − 635.30 |
| Bartel et al., model | 3.29465 | 3 | 24 | − 649.54 | − 648.34 |
| Bian et al., model | 94.47 | 5 | 24 | − 675.52 | − 672.19 |
| Chrastil model | 2.69392 | 3 | 24 | − 654.37 | − 653.17 |
| Reformulated Chrastil model | 2.70787 | 3 | 24 | − 654.25 | − 653.05 |
| Garlapati–Madras model | 2.36986 | 5 | 24 | − 653.45 | − 650.11 |
| Mendez–Teja model | 3.2662 | 3 | 24 | − 649.75 | − 648.55 |
| Sodefian et al., model | 1.03868 | 6 | 24 | − 671.24 | − 666.30 |
| Redddy–Garlapati model | 61.5158 | 6 | 24 | − 683.82 | − 678.88 |
| Mahesh–Garlapati model | 2.64529 | 3 | 24 | − 654.81 | − 653.61 |
| Cluster models | |||||
| New cluster model | 82.7593 | 4 | 24 | − 680.70 | − 678.59 |
| K.-W. Chen et al., model | 1.10632 | 3 | 24 | − 675.73 | − 674.53 |
| EoS model | |||||
| PR EoS model + vdW2 Mixing Rule | 84.4568 | 5 | 24 | − 678.21 | − 674.88 |
Conclusion
Solubilities of clemastine fumarate in ScCO2 at temperatures (T = 308–338 K) and pressures (P = 12–27 MPa) were reported for the first time. The measured solubilities were successfully correlated with several models; however, Tippana–Garlapati model is observed to be the best model in correlating the solubility data. The correlating ability in ascending order of various models in terms of lowest AICc values are as follows: Reddy–Garlapati model, new cluster model, PR EoS as temperature independent, K.-W. Chen et al., model, Bian et al., model, Sodefian et al., model, Mahesh–Garlapati model, Chrastil model, Reformulated Chrastil model, Garlapati–Madras model, Mendez–Teja model, Bartel et al., model, Alwi-Garlapati model. The new cluster model proposed in this work may be useful for correlating solids solubility in any SCF.
Acknowledgements
Corresponding authors would like to thank the research deputy of university of Kashan (Grant # Pajoohaneh-1400/16) for the financial support of this project. Authors also appreciate Amin Pharma Company for providing the required drug.
List of symbols
- A1–A3
Alwi–Garlapati parameters
- B1–B3
Bartel model parameters
- D1–D5
Bian et al., model parameters
- E1–E2
Chrastil model parameters
- F1–F2
Reformulated Chrastil model parameters
- G1–G5
Garlapati–Madras model parameters
- H1–H3
Mendez–Teja model parameters
- I1–I6
Sodefian et al., model parameters
- J1–J6
Tippana–Garlapati model parameters
- K1–K3
Mahesh–Garlapati model parameters
- AARD
Average absolute relative deviation
- AIC
Akaike information criterion
- AICc
Corrected Akaike information criterion
- aij
EoS energy parameter
- bij
EoS volume correction
- C
Solubility in Chrastil model
- EoS
Equation of State
- Hsol
Salvation enthalpy
- Hsub
Sublimation enthalpy
- HTotal
Total enthalpy
- Mscf
Molecular weight of supercritical fluid
- N
Number of data points
- Np
Number of parameters of a model
- P
Total pressure
- Psub
Sublimation pressure
- PR
Peng–Robinson
- Pr
Reduced pressure
- Pc
Critical pressure
- R
Universal gas constant
- R2
Square of correlation coefficient
- SSE
Sum of squares error
- T
Temperature
- Tc
Critical temperature
- Tr
Reduced temperature
- yi
Solubility in mole fraction
Greek symbols
- Δ
Difference
Fugacity coefficient of the pure substance at saturation
Solute fugacity in supercritical carbon dioxide (scCO2)
Acentric factor
- ρ
Density
- ρr
Reduced density ρr
- κji
Correlation parameter
- lji
Correlation parameter
Association numbers in respective eqs.
Sub and superscripts
- exp
Experimental
- cal
Calculated
- j
Solvent/ScCO2
- i
Solute/drug
- c
Critical
- r
Reduced
Author contributions
G.S.: Conceptualization, Methodology, Validation, Investigation, Supervision, Project administration, Writing-review and editing; C.G.: Methodology, Investigation, Software, Writing- original draft; F.R.: Investigation, Validation, Resources; M.G.: Methodology, Investigation, Validation.
Competing interests
The authors declare no competing interests.
Footnotes
Publisher's note
Springer Nature remains neutral with regard to jurisdictional claims in published maps and institutional affiliations.
References
- 1.Mina JGM, et al. Antileishmanial chemotherapy through clemastine fumarate mediated inhibition of the leishmania inositol phosphoryl ceramide synthase. ACS Infect. Dis. 2021;7:47–63. doi: 10.1021/acsinfecdis.0c00546. [DOI] [PMC free article] [PubMed] [Google Scholar]
- 2.Subramaniam B, Rajewski RA, Snavely K. Pharmaceutical processing with supercritical carbon dioxide. J. Pharm. Sci. 1997;86:885–890. doi: 10.1021/js9700661. [DOI] [PubMed] [Google Scholar]
- 3.Hitchen S, Dean J. Properties of supercritical fluids. In: Dean JR, editor. Applications of Supercritical Fluids in Industrial Analysis. Springer; 1993. pp. 1–11. [Google Scholar]
- 4.Reverchon E, De Marco I, Torino E. Nanoparticles production by supercritical antisolvent precipitation: A general interpretation. J. Supercrit. Fluids. 2007;43:126–138. doi: 10.1016/j.supflu.2007.04.013. [DOI] [Google Scholar]
- 5.Sodeifan G, Sajadian SA. Solubility measurement and preparation of nanoparticles of an anticancer drug (Letrozole) using rapid expansion of supercritical solutions with solid cosolvent (RESS-SC) J. Supercrit. Fluids. 2018;133:239–252. doi: 10.1016/j.supfu.2017.10.015. [DOI] [Google Scholar]
- 6.Sodeifan G, Ardestani NS, Sajadian SA, Panah HS. Experimental measurements and thermodynamic modeling of Coumarin-7 solid solubility in supercritical carbon dioxide: Production of nanoparticles via RESS method. Fluid Phase Equilib. 2019;483:122–143. doi: 10.1016/j.fuid.2018.11.006. [DOI] [Google Scholar]
- 7.Ardestani NS, Sodeifian G, Sajadian S. A preparation of phthalocyanine green nano pigment using supercritical CO2 gas antisolvent (GAS): Experimental and modelling. Heliyon. 2020;6:e049476. doi: 10.1016/j.heliyon.2020.e04947. [DOI] [PMC free article] [PubMed] [Google Scholar]
- 8.Sodeifan G, Sajadian SA, Daneshyan S. Preparation of Aprepitant nanoparticles (efcient drug for coping with the efects of cancer treatment) by rapid expansion of supercritical solution with solid cosolvent (RESS-SC) J. Supercrit. Fluids. 2018;140:72–84. doi: 10.1016/j.supfu.2018.06.009. [DOI] [Google Scholar]
- 9.Zordi ND, Kikic I, Moneghini M, Solinas D. Solubility of pharmaceutical compounds in supercritical carbon dioxide. J. Supercrit. Fluids. 2012;66:16–22. doi: 10.1016/j.supflu.2011.09.018. [DOI] [Google Scholar]
- 10.Reddy TA, Garlapati C. Dimensionless empirical model to correlate pharmaceutical compound solubility in supercritical carbon dioxide. Chem. Eng. Technol. 2019;42:2621–2630. doi: 10.1002/ceat.201900283. [DOI] [Google Scholar]
- 11.Mahesh G, Garlapati C. Modelling of solubility of some parabens in supercritical carbon dioxide and new correlations. Arab. J. Sci. Eng. 2021 doi: 10.1007/s13369-021-05500-2. [DOI] [Google Scholar]
- 12.Sodeifan G, Razmimanesh F, Sajadian SA, Panah HS. Solubility measurement of an antihistamine drug (loratadine) in supercritical carbon dioxide: Assessment of qCPA and PCP-SAFT equations of state. Fluid Phase Equilib. 2018;472:147–159. doi: 10.1016/j.fuid.2018.05.018. [DOI] [Google Scholar]
- 13.Sodeifan G, Nasri L, Razmimanesh F, Abadian M. Measuring and modeling the solubility of an antihypertensive drug (losartan potassium, Cozaar) in supercritical carbon dioxide. J. Mol. Liq. 2021;331:115745. doi: 10.1016/j.molliq.2021.115745. [DOI] [Google Scholar]
- 14.Sodeifan G, Garlapati C, Razmimanesh F, Sodeifan F. Solubility of amlodipine besylate (calcium channel blocker drug) in supercritical carbon dioxide: Measurement and correlations. J. Chem. Eng. Data. 2021;66:1119–1131. doi: 10.1021/acs.jced.0c00913. [DOI] [Google Scholar]
- 15.Sodeifan G, Razmimanesh F, Ardestani NS, Sajadian SA. Experimental data and thermodynamic modeling of solubility of Azathioprine, as an immunosuppressive and anti-cancer drug, in supercritical carbon dioxide. J. Mol. Liq. 2020;299:112179. doi: 10.1016/j.molliq.2019.112179. [DOI] [Google Scholar]
- 16.Sodeifan G, Alwi RS, Razmimanesh F, Tamura K. Solubility of quetiapine hemifumarate (antipsychotic drug) in supercritical carbon dioxide: Experimental, modeling and hansen solubility parameter application. Fluid Phase Equilib. 2021;537:113003. doi: 10.1016/j.fuid.2021.113003. [DOI] [Google Scholar]
- 17.Sodeifan G, Sajadian SA, Ardestani NS. Determination of solubility of Aprepitant (an antiemetic drug for chemotherapy) in supercritical carbon dioxide: Empirical and thermodynamic models. J Supercrit. Fluids. 2017;128:102–111. doi: 10.1016/j.supfu.2017.05.019. [DOI] [Google Scholar]
- 18.Sodeifan G, Sajadian SA, Razmimanesh F. Solubility of an antiarrhythmic drug (amiodarone hydrochloride) in supercritical carbon dioxide: Experimental and modeling. Fluid Phase Equilib. 2017;450:149–159. doi: 10.1016/j.fuid.2017.07.015. [DOI] [Google Scholar]
- 19.Sodeifan G, Sajadian SA, Razmimanesh F, Hazaveie SM. Solubility of Ketoconazole (antifungal drug) in SC-CO2 for binary and ternary systems: Measurements and empirical. Sci. Rep. 2021;11:7546. doi: 10.1038/s41598-021-87243-6. [DOI] [PMC free article] [PubMed] [Google Scholar]
- 20.Sodeifan G, Garlapati C, Razmimanesh F, Sodeifan F. The solubility of Sulfabenzamide (an antibacterial drug) in supercritical carbon dioxide: Evaluation of a new thermodynamic model. J. Mol. Liq. 2021;335:116446. doi: 10.1016/j.molliq.2021.116446. [DOI] [Google Scholar]
- 21.Peper S, Fonseca JMS, Dohrn R. High-pressure fluidphase equilibria: Trends, recent developments, and systems investigated (2009–2012) Fluid Phase Equilib. 2019;484:126–224. doi: 10.1016/j.fluid.2018.10.007. [DOI] [Google Scholar]
- 22.Alwi RS, Garlapati C. A new semi empirical model for the solubility of dyestuffs in supercritical carbon dioxide. Chem. Pap. 2021;75:2585–2595. doi: 10.1007/s11696-020-01482-x. [DOI] [Google Scholar]
- 23.Bartle KD, Cliford AA, Jafar SA, Shilstone GF. Solubilities of solids and liquids of low volatility in supercritical carbon dioxide. J. Phys. Chem. Ref. Data. 1991;20:713–756. doi: 10.1063/1.555893. [DOI] [Google Scholar]
- 24.Bian X-Q, Zhang Q, Du Z-M, Chen J, Jaubert JN. A five-parameter empirical model for correlating the solubility of solid compounds in supercritical carbon dioxide. Fluid Phase Equilib. 2016;411:74–80. doi: 10.1016/j.fluid.2015.12.017. [DOI] [Google Scholar]
- 25.Chrastil J. Solubilities of solids and liquids in supercritical gases. J. Phys. Chem. 1982;86:3016–3021. doi: 10.1021/j100212a041. [DOI] [Google Scholar]
- 26.Garlapati C, Madras G. Solubilities of Palmitic and steric fatty acids in supercritical carbon dioxide. J. Chem. Thermodyn. 2010;42:193–197. doi: 10.1016/j.jct.2009.08.001. [DOI] [Google Scholar]
- 27.Garlapati C, Madras G. Solubilities of solids in supercritical fluids using dimensionally consistent modified solvate complex models. Fluid Phase Equilib. 2009;283:97–101. doi: 10.1016/j.fluid.2009.05.013. [DOI] [Google Scholar]
- 28.Garlapati C, Madras G. New empirical expressions to correlate solibilities of solids in supercritical carbon dioxide. Thermochim. Acta. 2010;500:123–127. doi: 10.1016/j.tca.2009.12.004. [DOI] [Google Scholar]
- 29.Méndez-Santiago J, Te Teja AS. solubility of solids in supercritical fuids. Fluid Phase Equilib. 1999;158:501–510. doi: 10.1016/S0378-3812(99)00154-5. [DOI] [Google Scholar]
- 30.Sodeifan G, Razmimanesh F, Sajadian SA. Solubility measurement of a chemotherapeutic agent (Imatinib mesylate) in supercritical carbon dioxide: Assessment of new empirical model. J. Supercrit. Fluids. 2019;146:89–99. doi: 10.1016/j.supfu.2019.01.006. [DOI] [Google Scholar]
- 31.Sandler SI. Chemical, Biochemical and Engineering Thermodynamics. Wiley; 1996. pp. 664–666. [Google Scholar]
- 32.Peng DY, Robinson DB. A new two-constant equation of state. Ind. Eng. Chem. Fundam. 1976;15:59–64. doi: 10.1021/i160057a011. [DOI] [Google Scholar]
- 33.Prausnitz JM, Lichtenthaler RN, De Azevedo EG. Molecular Thermodynamics of Fluid-Phase Equilibria. Mcgraw-Hill; 2001. pp. 33–34. [Google Scholar]
- 34.Garlapati C, Madras G. Temperature independent mixing rules to correlate the solubilities of antibiotics and anti-inflammatory drugs in SCCO2. Thermochim. Acta. 2009;496:54–58. doi: 10.1016/j.tca.2009.06.022. [DOI] [Google Scholar]
- 35.Sodeifan G, Garlapati C, Razmimanesh F, Sodeifan F. Solubility of 2,4,7-Triamino-6-phenylpteridine (triamterene, diuretic drug) in supercritical carbon dioxide: Experimental data and modeling. J. Chem. Eng. Data. 2020;65:4406–4416. doi: 10.1021/acs.jced.0c00268. [DOI] [Google Scholar]
- 36.Chen K-W, Tang M, Chen Y-P. Calculation of solid solubility in supercritical fluids using a simplified cluster salvation model. Fluid Phase Equilib. 2003;234:169–186. doi: 10.1016/S0378-3812(03)00350-9. [DOI] [Google Scholar]
- 37.Zong M, Han B, Ke J, Yan H, Peng DY. A model for correlating solubility of of solids in supercritical CO2. Fluid Phase Equilib. 1998;146:93–102. doi: 10.1016/S0378-3812(98)00207-6. [DOI] [Google Scholar]
- 38.Lemert RM, Johnston KP. Chemical complexing agents for enhanced solubilities in supercritical fluid carbon dioxide. Ind. Eng. Chem. Res. 1991;30:1222–1231. doi: 10.1021/ie00054a024. [DOI] [Google Scholar]
- 39.Rajaram J, Kuriacose JC. Chemical Thermodynamics Classical, Statistical and Irreversible. Pearson Dorling Kindersley; 2013. pp. 218–219. [Google Scholar]
- 40.Fedors RF. A relationship between chemical structure and the critical temperature. Chem. Eng. Commun. 1982;16:149–151. doi: 10.1080/00986448208911092. [DOI] [Google Scholar]
- 41.Reid RC, Prausnitz JM, Poling BE. The Properties of Gases and Liquids. McGraw-Hill; 1988. [Google Scholar]
- 42.Immirzi A, Perini B. Prediction of density in organic crystals. Acta Crystall. A-Cryst. 1977;33:216–218. doi: 10.1107/S0567739477000448. [DOI] [Google Scholar]
- 43.Lyman WJ, Reehl WF, Rosenblatt DH. Handbook of Chemical Property Estimation Methods. McGraw-Hill; 1982. [Google Scholar]
- 44.Valderrama JO, Alvarez VH. Correct way of reporting results when modelling supercritical phase equilibria using equations of state. Can. J. Chem. Eng. 2005;83:578–581. doi: 10.1002/cjce.5450830323. [DOI] [Google Scholar]
- 45.Kletting P, Glatting G. Model selection for time-activity curves: The corrected Akaike information criterion and the F-test. Zeitschriftfürmedizinische Physik. 2019;19:200–206. doi: 10.1016/j.zemedi.2009.05.003. [DOI] [PubMed] [Google Scholar]
- 46.Burnham KP, Anderson DR. Multimodel inference understanding AIC and BIC in model selection. Sociol. Methods Res. 2004;33:261–304. doi: 10.1177/0049124104268644. [DOI] [Google Scholar]
- 47.Deepitha J, Pitchaiah KC, Rao CVSB, Madras G, Sivaraman N. Solubilities of dialkylhydrogen phosphonates in supercritical carbon dioxide and their correlation using semi-empirical equations. Sep. Sci. Technol. 2019;54:1650–1660. doi: 10.1080/01496395.2018.1538244. [DOI] [Google Scholar]
- 48.Pitchaiah KC, et al. Experimental measurements and correlation of the solubility of N, N-dialkylamides in supercritical carbon dioxide. J. Supercrit. Fluids. 2019;143:162–170. doi: 10.1016/j.supflu.2018.08.007. [DOI] [Google Scholar]
- 49.Lamba N, Narayan RC, Modak J, Madras G. Solubilities of 10-undecenoic acid and geraniol in supercritical carbon dioxide. J. Supercrit. Fluids. 2016;107:384–391. doi: 10.1016/j.supflu.2015.09.026. [DOI] [Google Scholar]
- 50.National Institute of Standards and Technology U.S. Department of Commerce, NIST ChemistryWebBook, in, 2018,October. https://webbook.nist.gov/chemistry/ (23 March 2021).