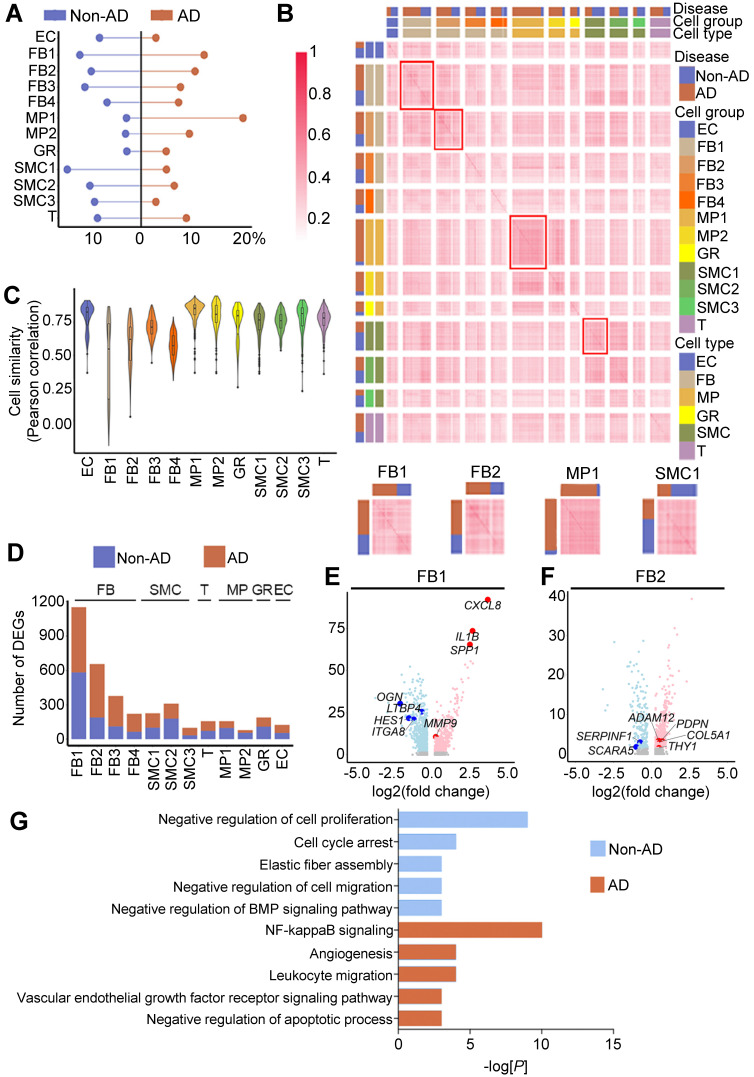
Figure 3.
Cellular and molecular alterations in human AD. (A) Cell proportion in Non-AD versus AD aortas. The total cell number in one condition was taken as 100%. (B) Cell-cell correlation matrices showing correlation coefficients of all pairs of indicated cell clusters. Heatmaps of FB1, FB2, MP1 and SMC1 are magnified on the bottom, showing representative correlation coefficient of these clusters. (C) Transcriptome similarities of each cluster, containing both Non-AD and AD cells. The center line shows the median value, the box limits show the upper and lower quartiles. (D) Number of differentially expressed genes (DEGs) of each cluster compared between Non-AD and AD states. (E, F) Volcano plots to show DEGs in representative clusters, FB1 (E) and FB2 (F). Red indicates up-regulated genes in AD aortas, and blue represents up-regulated genes in Non-AD aortas. (G) Gene ontology analysis of genes specifically expressed in Non-AD FB2 or in AD FB2, selected top categories are shown.

