

Key Points
Question
Does long-term supplementation with marine omega-3 fatty acids (omega-3) prevent depression in the general adult population?
Findings
In this randomized clinical trial that included 18 353 adults aged 50 years or older without depression or clinically relevant depressive symptoms at baseline, daily omega-3 supplementation compared with placebo resulted in mixed findings of a statistically significant increase in risk of depression or clinically relevant depressive symptoms (hazard ratio, 1.13) but no significant difference in change in 8-item Patient Health Questionnaire depression scale mood scores (0.03 points, comparing omega-3 with placebo), over a 5-year treatment period.
Meaning
These findings do not support the use of omega-3 fatty acid supplements in adults to prevent depression.
Abstract
Importance
Marine omega-3 fatty acid (omega-3) supplements have been used to treat depression but their ability to prevent depression in the general adult population is unknown.
Objective
To test effects of omega-3 supplementation on late-life depression risk and mood scores.
Design, Setting, and Participants
A total of 18 353 adults participated in the VITAL-DEP (Vitamin D and Omega-3 Trial-Depression Endpoint Prevention) ancillary study to VITAL, a randomized trial of cardiovascular disease and cancer prevention among 25 871 US adults. There were 16 657 at risk of incident depression (no previous depression) and 1696 at risk of recurrent depression (previous depression, but not for the past 2 years). Randomization occurred from November 2011 through March 2014; randomized treatment ended on December 31, 2017.
Interventions
Randomized 2 × 2 factorial assignment to vitamin D3 (2000 IU/d), marine omega-3 fatty acids (1 g/d of fish oil, including 465 mg of eicosapentaenoic acid and 375 mg of docosahexaenoic acid) or placebo; 9171 were randomized to omega-3 and 9182 were randomized to matching placebo.
Main Outcomes and Measures
Prespecified coprimary outcomes were risk of depression or clinically relevant depressive symptoms (total of incident + recurrent cases); mean difference in mood score (8-item Patient Health Questionnaire [PHQ-8] depression scale).
Results
Among 18 353 participants who were randomized (mean age, 67.5 [SD, 7.1] years; 49.2% women), 90.3% completed the trial (93.5% among those alive at the end of the trial); the median treatment duration was 5.3 years. The test for interaction between the omega-3 and the vitamin D agents was not significant (P for interaction = .14). Depression risk was significantly higher comparing omega-3 (651 events, 13.9 per 1000 person-years) with placebo (583 events, 12.3 per 1000 person-years; hazard ratio [HR], 1.13; 95% CI, 1.01-1.26; P = .03). No significant differences were observed comparing omega-3 with placebo groups in longitudinal mood scores: the mean difference in change in PHQ-8 score was 0.03 points (95% CI, −0.01 to 0.07; P = .19). Regarding serious and common adverse events, the respective prevalence values in omega-3 vs placebo groups were major cardiovascular events (2.7% vs 2.9%), all-cause mortality (3.3% vs 3.1%), suicide (0.02% vs 0.01%), gastrointestinal bleeding (2.6% vs 2.7%), easy bruising (24.8% vs 25.1%), and stomach upset or pain (35.2% vs 35.1%).
Conclusions and Relevance
Among adults aged 50 years or older without clinically relevant depressive symptoms at baseline, treatment with omega-3 supplements compared with placebo yielded mixed results, with a small but statistically significant increase in risk of depression or clinically relevant depressive symptoms but no difference in mood scores, over a median follow-up of 5.3 years. These findings do not support the use of omega-3 supplements in adults to prevent depression.
Trial Registration
ClinicalTrials.gov Identifiers: NCT01696435 and NCT01169259
This randomized clinical trial tested the effects of daily omega-3 supplementation vs placebo on depression prevention in older adults without depression.
Introduction
Nutrient supplementation may be an efficient, safe, and broadly applicable approach to depression prevention, a public health priority.1 Marine omega-3 fatty acids (omega-3) (eicosapentaenoic acid [EPA] and docosahexaenoic acid [DHA]) may reduce depression risk and promote favorable mood.2,3,4 Expert panels have supported omega-3 supplements for reducing major depressive disorder recurrence in select high-risk patients but not broadly.5,6 There are no guidelines regarding omega-3 for depression prevention in the general population.
A major limitation in assessing omega-3 as prevention is the heterogeneity of participants.7,8 In a meta-analysis8 of 39 randomized clinical trials (RCTs), only 6 included participants without clinical depression: there was no mean difference in depressive symptoms comparing omega-3 and control; treatment durations were brief (range, 4-26 weeks). A meta-analysis of 9 RCTs with adults 60 years or older showed mixed results for reduction in depressive symptoms, although benefits appeared greater with higher daily dosage9; samples were small and most trials did not test prevention in initially nondepressed persons. In an example of selective and indicated prevention,10 12-month treatment of 1025 adults with a multinutrient agent containing 1.4 g/d of omega-3 had no effect on risk of major depressive disorder.11 No study has yet been large enough to examine omega-3 supplementation for universal prevention of depression, which would require thousands of participants.12 Thus, tests of universal depression prevention using daily doses of nutraceuticals or registered therapeutics are rare.13,14
The Vitamin D and Omega-3 Trial–Depression Endpoint Prevention (VITAL-DEP) was an ancillary study to the VITAL parent trial and tested effects of daily vitamin D3 and omega-3 supplementation vs placebo for depression prevention. Coprimary outcomes were (1) total risk of depression (total occurrence of both incident and recurrent cases) and (2) long-term trajectory of mood based on 6 annual assessments. Results from the vitamin D3 group were previously reported.14 The design and results for omega-3 are presented herein.
Methods
Study Protocol Approval
All participants provided written informed consent. Approvals for the parent trial and this study were obtained from the institutional review board of Brigham and Women’s Hospital. An independent data and safety monitoring board regularly reviewed data on end points and adverse events. The study protocol, including enumeration of prespecified primary and secondary aims and the statistical analysis plan appear in Supplement 1.
Participants
The parent trial tested effects of vitamin D3 and marine omega-3 fatty acids on prevention of incident cancer and cardiovascular disease15,16; 25 871 men aged 50 years or older and women aged 55 years or older were randomized between November 2011 and March 2014 to receive vitamin D3 (2000 IU/d of cholecalciferol), marine omega-3 (Omacor, a 1-g/d fish oil capsule containing 465 mg of EPA and 375 mg of DHA) or matching placebos in a 2 × 2 factorial design. Randomization was computer-generated within sex, race, and 5-year age groups in blocks of 8. Race and ethnicity were self-reported by selecting response options on the questionnaire; participants could select as many as apply. Achieving a racially and ethnically diverse sample was a goal in the parent trial. Eligible participants were required to have no history of cancer or cardiovascular disease; to have limited use of supplemental vitamin D, to be willing to forego use of fish oil supplements, and to be free of allergies or health conditions that would preclude participation. Baseline blood samples were collected from 16 956 participants. Details have been published previously.16,17
As described elsewhere,14 additional eligibility requirements of this study were absence of current clinically relevant depressive symptoms (8-item Patient Health Questionnaire [PHQ-8] depression scale score ≥10 points); core features of depression (anhedonia or dysphoria) for 2 or more weeks within the past 2 years; current treatment for depression; or major psychiatric or neurological conditions (Figure 1).
Figure 1. Flow of Participants in the Vitamin D and Omega-3 Trial (VITAL)–Depression Endpoint Prevention Ancillary Study to the VITAL Triala.
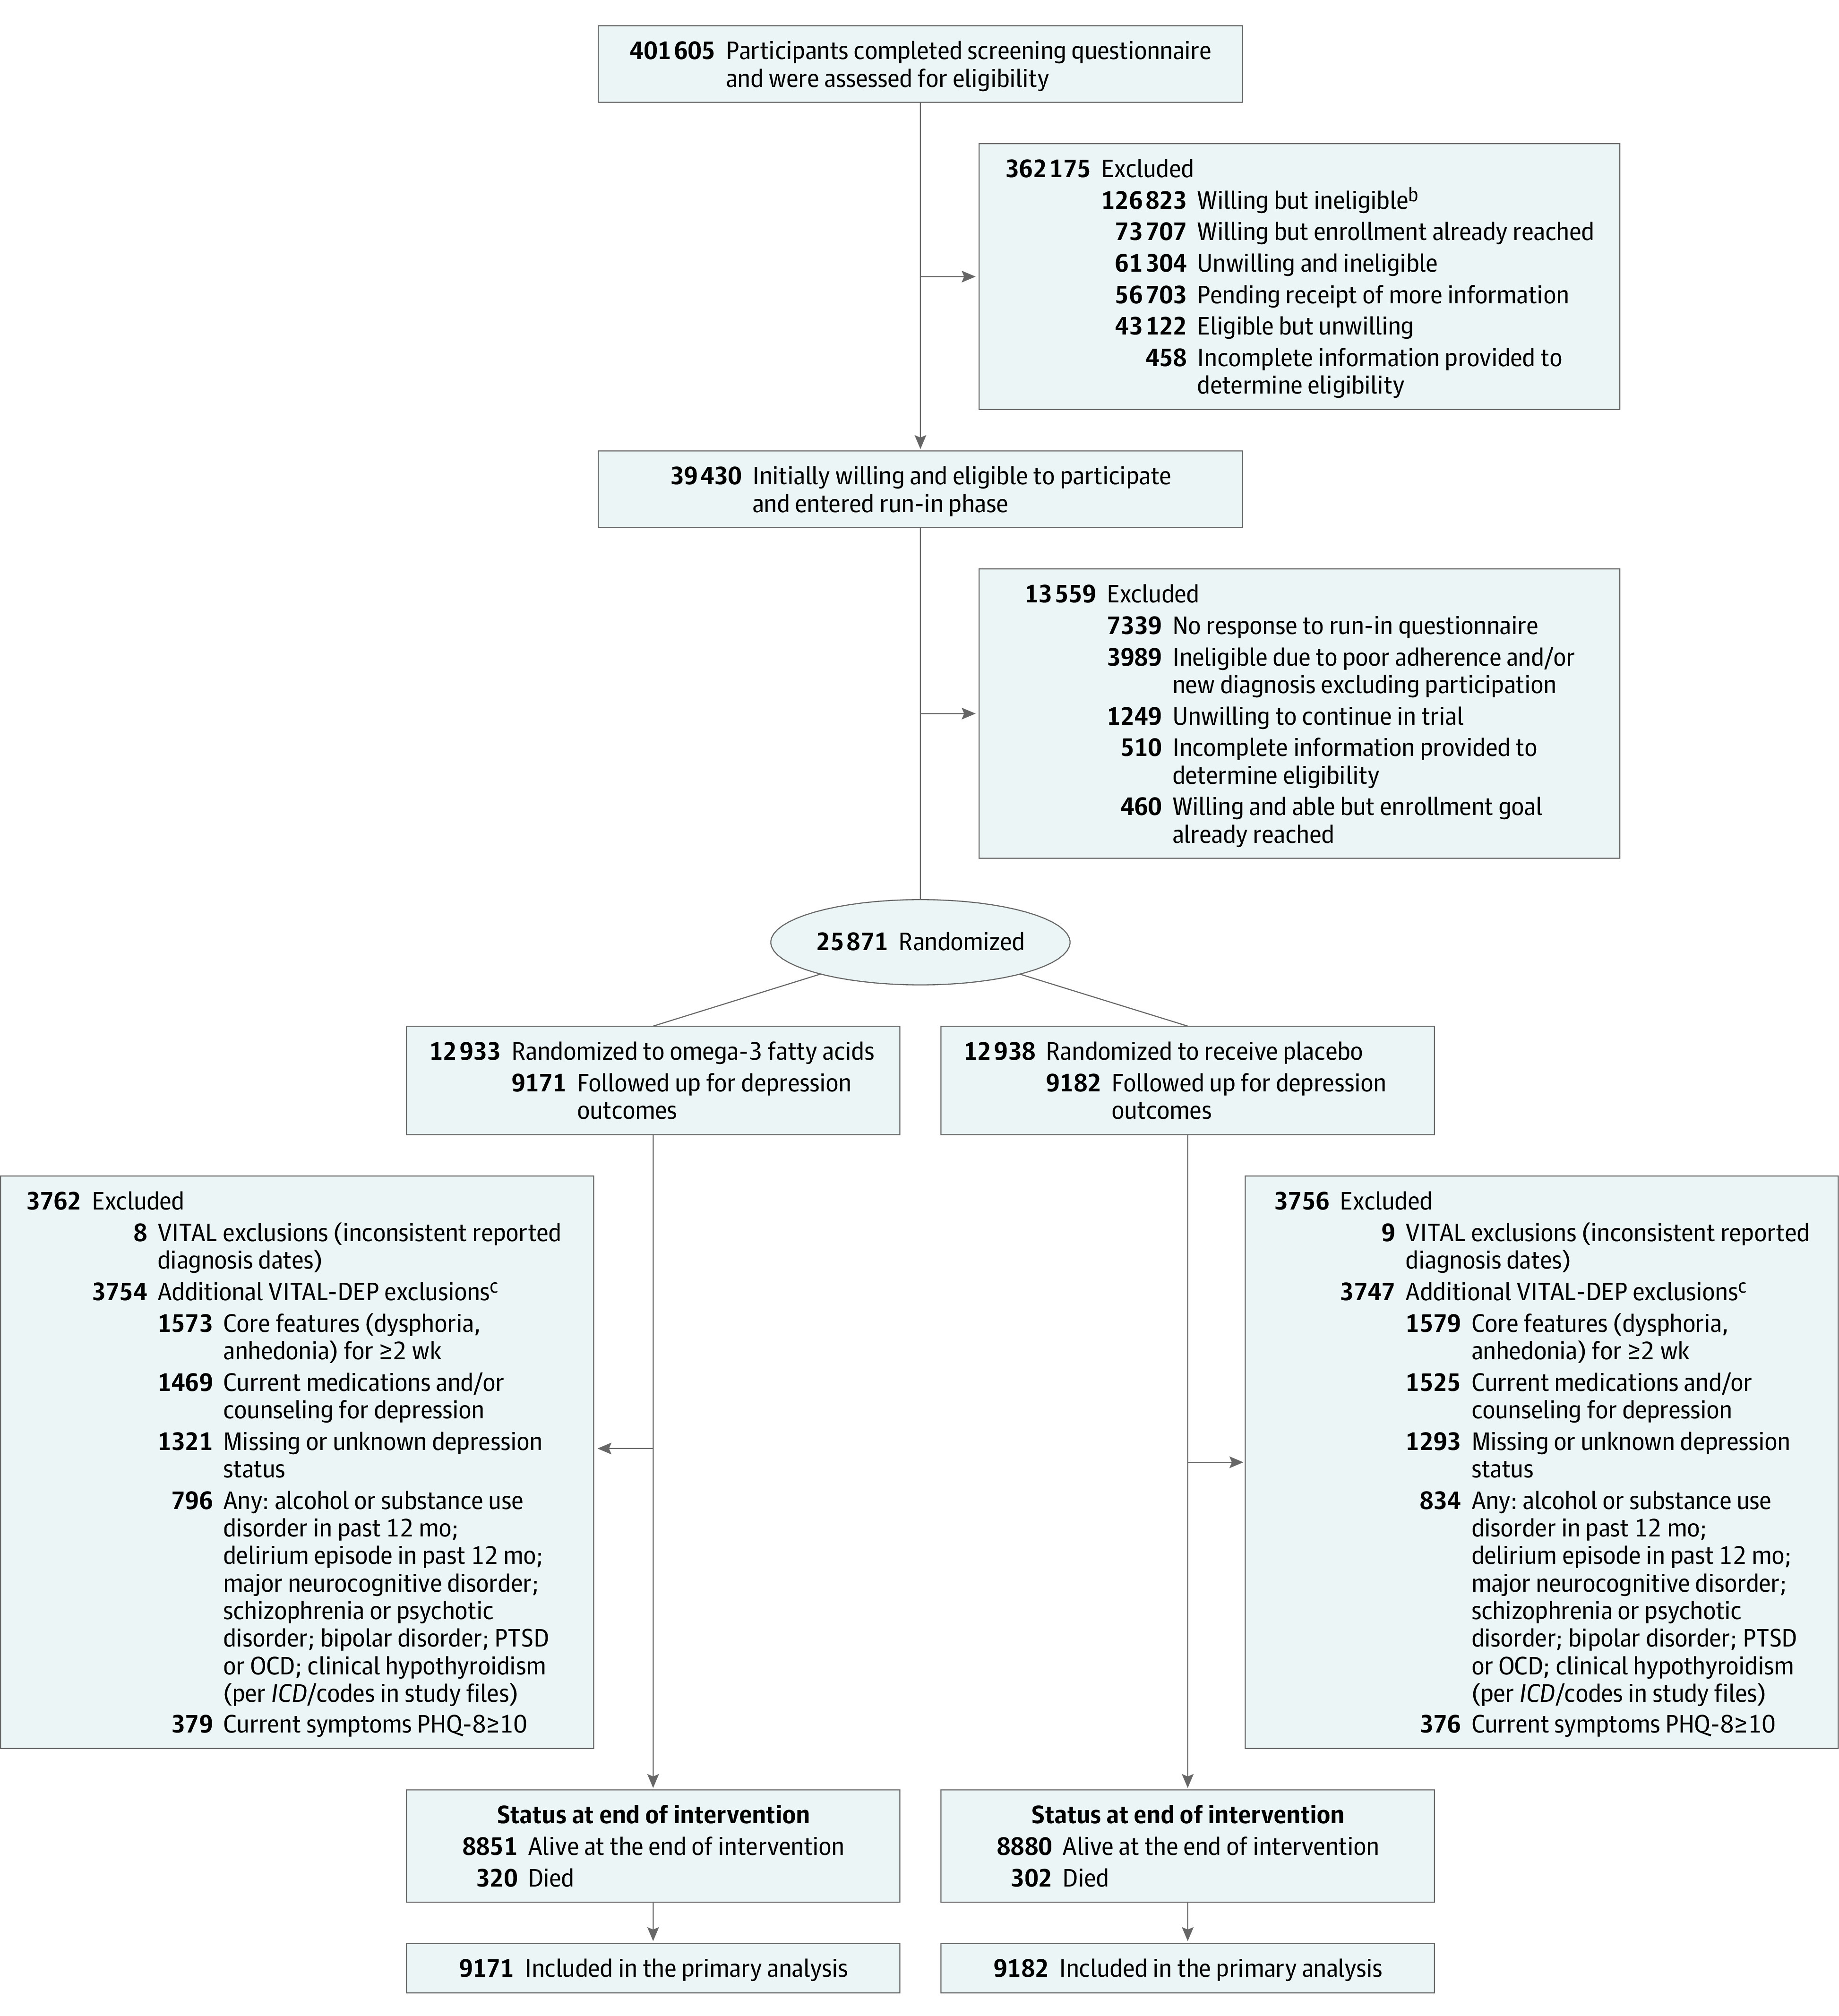
aThe participant flow diagram for the 25 871 participants randomized in VITAL has been provided elsewhere.15
bIncluded 76 190 individuals with history of cardiovascular disease, cancer, and/or safety exclusion criteria; 32 647 individuals unwilling to forgo supplemental vitamin D3 intake greater than 800 IU/d, supplemental calcium intake greater than 1200 mg/d, or fish oil supplementation during the trial; 13 521 men younger than 50 years and women younger than 55 years; and 4465 individuals who reported another exclusion criterion (eg, participation in another trial).
cParticipants could have had more than 1 exclusion condition. ICD indicates, International Classification of Diseases; OCD, obsessive-compulsive disorder; PHQ-8, 8-item Patient Health Questionnaire; PTSD, posttraumatic stress disorder.
Follow-up Procedures
Parent trial participants were followed up annually via mailed questionnaires to update information on illnesses or adverse events, health and lifestyle factors, and study adherence. Follow-up continued until the end of randomized treatment on December 31, 2017, for a median treatment duration of 5.3 years (IQR, 5.0-5.7 years). The total follow-up and study pill adherence rates were high, and use of outside fish oil supplements was low (<3.5% in each group). Among a subset of 1583 participants, plasma omega-3 index levels measured at randomization and 1 year later confirmed an increase of 55% in the active group and less than 2% in the placebo group.16 Participants randomized in later years did not complete the maximum of 5 postbaseline annual mood score questionnaires and were administratively censored; thus, the proportion who received the year-5 questionnaires was lower than for earlier follow-up waves but did not differ between treatment groups.
Outcomes
The 2 coprimary outcomes of this study were (1) risk of depression or clinically relevant depressive symptoms and (2) longitudinal mood scores. A depression event (henceforth, “depression or clinically relevant depressive symptoms”) was defined as a new self-report of physician- or clinician-diagnosed depression, treatment (medication or counseling) for depression, or presence of clinically relevant depressive symptoms (PHQ-8 ≥10 points, a validated cutoff18,19) on annual questionnaires, as previously described.14 Incident cases arose from among those with no current or previous history of depression; recurrent cases arose from among those with prior history of depression but currently without clinically relevant symptoms or treatment for depression within the past 2 years. Safety procedures included sending letters to participants with elevated PHQ-8 scores.14,17 Longitudinal mood scores were ascertained with the PHQ-8 on 6 annual questionnaires (range, 0-24 points; higher scores indicate worse mood); the prespecified minimal clinically important difference for change scores was 0.5 points (Supplement 1).
Power Analysis
The study was designed to have 85% or greater power to detect an observed hazard ratio (HR) of depression or clinically relevant depressive symptoms of 0.85 with the planned total sample of 18 200 (Supplement 1). This HR was obtained from prior literature summarizing that, if an intervention for universal prevention of a mental disorder is completely effective at addressing a source of risk, the incidence of cases could be expected to be reduced by up to 15%.12 Power was greater than 99% to detect the minimal clinically important difference for change in PHQ-8 score.
Statistical Analyses
Analyses of Coprimary Outcomes
Participants’ outcomes were analyzed according to their randomization groups. Interaction between agents was tested using a multiplicative interaction term14; single agent effects were tested after combining all participants randomized to omega-3 or to its matching placebo into 2 groups. In examining depression events, participants were followed up until the occurrence of the end point, death, or the end of the trial, whichever came first; cumulative incidence curves were used to compare the omega-3 and placebo groups. Cox proportional hazards models were used to estimate HRs and 95% CIs for omega-3 vs placebo, adjusting for age, sex, and the other randomized agent (vitamin D3). The proportional hazards assumption was assessed by testing the treatment × log of follow-up time interaction (time-dependent model) and the Kolmogorov-type supremum test. In examining mood scores over time, general linear models of response profiles were used to estimate means, adjusting for design variables, and time was modeled as an indicator variable.20 Models were fitted using maximum likelihood and correlations within participants were modeled using an unstructured covariance pattern; statistical tests used the Wald test.20 Participants with scheduled follow-up interviews after the trial ended were administratively censored and treated as missing completely at random. Data for other participants missing interviews were treated as missing at random given their observed baseline and follow-up data. Because results from the 2 coprimary outcomes could differ, we included plans to guide interpretation (Supplement 1).
Prespecified Secondary Analyses
First, we addressed whether outcomes differed across subgroups selected a priori: age, sex, race, baseline plasma EPA and DHA levels, baseline total fish and seafood consumption, Charlson-Deyo comorbidity index,21,22 and the other treatment (vitamin D3). For subgroup analyses, interactions were tested using multiplicative interaction terms. Second, we addressed the potential influence of initiating antidepressants during follow-up on the observed effect of omega-3 on longitudinal mood scores. Third, analyses of effects of omega-3 on risk of depression or clinically relevant depressive symptoms were repeated with censoring at nonadherence (ie, taking less than two-thirds of study pills).
Nonprespecified and Post Hoc Analyses
First, incident and recurrent depression or clinically relevant depressive symptoms were addressed separately as outcomes. Second, post hoc sensitivity analyses addressed additional censoring at the development of a cardiovascular disease or cancer end point; adjusting for cardiovascular disease and cancer as time-updated covariates; Fine-Gray models treating death as a competing rather than censoring event23; repeating response profiles analysis of mood scores with omission of year-5 PHQ-8 values; censoring PHQ-8 scores at receipt of a mood safety letter. Third, repeated measures negative binomial regression was used as an alternative approach to model change in PHQ-8 scores, which tend to be right skewed.
Fourth, because the total PHQ-8 score may not reflect omega-3 effects on specific depressive features (eg, anhedonia, sadness, sleep, fatigue), we addressed item-level symptom burden, denoted by self-report of experiencing the symptom “more than half the days” or “nearly every day.” We used repeated-measures logistic regression and estimated the mean effect of omega-3 on change in likelihood of item-level symptom burden over follow-up. Fifth, when assessing the proportional hazards assumption, the time-dependent model was significant for age, and the supremum test was significant for age and omega-3 randomized group and indicated possible differences in treatment effect before vs after 2 years of follow-up. Thus, in post hoc analyses we computed HRs by (1) allowing the baseline hazard to differ by baseline age groups and (2) excluding events within the first 2 years.
Sixth, given the known sex differences in late-life depression rates,24 as well as potential sex differences in treatment effects in this study, we conducted additional sex-specific analyses. Seventh, we examined effects of omega-3 among participants with mild depressive symptoms (PHQ-8 range, 5-9 points18,19) at baseline.
Changes to the Study Protocol
Differences between the initial statistical analysis plan and published protocol17 and this report are briefly described herein and detailed elsewhere.14 Due to a copyediting error, text in one portion of Supplement 1 describes the use of the PHQ-8 diagnostic algorithm for the mood score outcome rather than the PHQ-8 score cutoff of 10 or more, which is elsewhere described in Supplement 1 as the threshold for mood safety follow-up procedures; the PHQ-8 score cutoff of 10 or more was used throughout the entire study period for both the mood score outcome and safety tracking procedures. Other changes include: increased target enrollment in the parent trial; increased number of participants with baseline plasma EPA and DHA levels; modified minimum age for eligibility; forgoing use of Centers for Medicare & Medicaid Services data to supplement depression information because linkage was unavailable for nearly one-third of the participants.
Statistical analyses were performed using SAS (SAS Institute Inc). Tests were 2-sided; for an α level of .05. Because of the potential for type I error due to multiple comparisons, findings from secondary and subgroup analyses should be interpreted as exploratory.
Results
Baseline Characteristics
Among the 18 353 participants, 9171 were randomized to receive omega-3 and 9182 were randomized to receive placebo (Figure 1); 90.3% completed the trial (93.5% among those alive at the end of trial). The median follow-up was 5.3 years. Baseline characteristics were balanced between treatment groups (eTable 1 in Supplement 2) and were similar to those among the 25 871 participants in the parent trial; the mean age was 67.5 years, women comprised 49% of the sample, and 27% represented racial and ethnic minority groups (Table 1). Mean plasma EPA and DHA levels were identical in the omega-3 and placebo groups. Additional characteristics are provided in eTable 1 in Supplement 2. Percentages of those eligible for incidence and recurrence were similar by treatment group: 90.7% (8322 of 9171) and 9.3% (849 of 9171) in the omega-3 group; 90.8% (8335 of 9182) and 9.2% (847 of 9182) in the placebo group (Supplement 2).
Table 1. Characteristics of Participants at Baseline, According to Randomized Assignment to Omega-3 Fatty Acid or Placeboa.
| Characteristic | No. (%) | |
|---|---|---|
| Omega-3 group (n = 9171)b | Placebo group (n = 9182)b | |
| Age, mean (SD), y | 67.4 (7.1) | 67.5 (7.0) |
| Age groups, y | ||
| 50-54 | 354 (3.9) | 298 (3.3) |
| 55-64 | 2947 (32.1) | 3018 (32.9) |
| 65-74 | 4633 (50.5) | 4598 (50.1) |
| ≥75 | 1237 (13.5) | 1268 (13.8) |
| Sex | ||
| Men | 4674 (51.0) | 4656 (50.7) |
| Women | 4497 (49.0) | 4526 (49.3) |
| Racial or ethnic groupc | ||
| No. | 8982 | 9007 |
| African American or Black | 1683 (18.7) | 1724 (19.1) |
| Asian | 150 (1.7) | 144 (1.6) |
| Hispanic (not African American) | 347 (3.9) | 361 (4.0) |
| Native American or Alaska Native | 80 (0.9) | 70 (0.8) |
| Non-Hispanic White | 6563 (73.1) | 6534 (72.5) |
| Otherd | 159 (1.8) | 174 (1.9) |
| Charlson-Deyo comorbidity index, pointse | ||
| 0 | 7764 (84.7) | 7776 (84.7) |
| 1 | 1206 (13.2) | 1199 (13.1) |
| ≥2 | 201 (2.2) | 207 (2.3) |
| Baseline biomarker levels, median (IQR), %f | ||
| No. | 5591 | 5638 |
| Plasma EPA | 0.5 (0.4-0.7) | 0.5 (0.4-0.7) |
| No. | 5598 | 5639 |
| Plasma DHA | 1.9 (1.5-2.4) | 1.9 (1.6-2.4) |
| Intake of total fish and seafood, median (IQR), servings/wkg | 1.5 (0.9-2.5) | 1.5 (0.9-2.5) |
| Randomization in vitamin D3 portion of trial | ||
| Active agent group | 4608 (50.3) | 4573 (49.8) |
| Placebo group | 4563 (49.8) | 4609 (50.2) |
Abbreviations: DHA, docosahexaenoic acid; EPA, eicosapentaenoic acid.
Full comparison of baseline characteristics can be found in eTable 1 in Supplement 2.
Unless otherwise stated.
Race and ethnicity were reported by participants.
Includes Native Hawaiian or other Pacific Islander, multiple race, unknown race, or unknown ethnicity.
A weighted comorbidity score derived from the sum of the scores for each of several major medical comorbid conditions. Participants were categorized as having 0, 1, or 2 or more points.
Expressed as a percent of the total phospholipid fatty acids.
Assessed by a modified version of Harvard food frequency questionnaire. The combined category includes intake of mackerel, salmon, sardines, bluefish, swordfish, canned tuna, cod, haddock, halibut; breaded fish cakes, pieces, or fish sticks; shrimp, lobster, scallops.
Primary Outcomes
The test for interaction between the omega-3 and vitamin D agents was not significant (P for interaction = .14). There were 651 cases of depression or clinically relevant depressive symptoms in the omega-3 group (13.9 per 1000 person-years) and 583 cases in the placebo group (12.3 per 1000 person-years). The adjusted HR was 1.13 (95% CI, 1.01-1.26; P = .03). Cumulative incidence curves showed separation between treatment groups approximately 2 years after randomization (Figure 2). The mean difference in change between treatment groups in PHQ-8 change scores was not significantly different from 0 over the entire follow-up (0.03 points; 95% CI, −0.01-0.07; P = .19) or at any time point during follow-up (Table 2; Supplement 2).
Figure 2. Cumulative Incidence Since Randomization Until Occurrence of Total Depression, Incident Depression, and Recurrent Depression in Omega-3 and Placebo Groupsa.
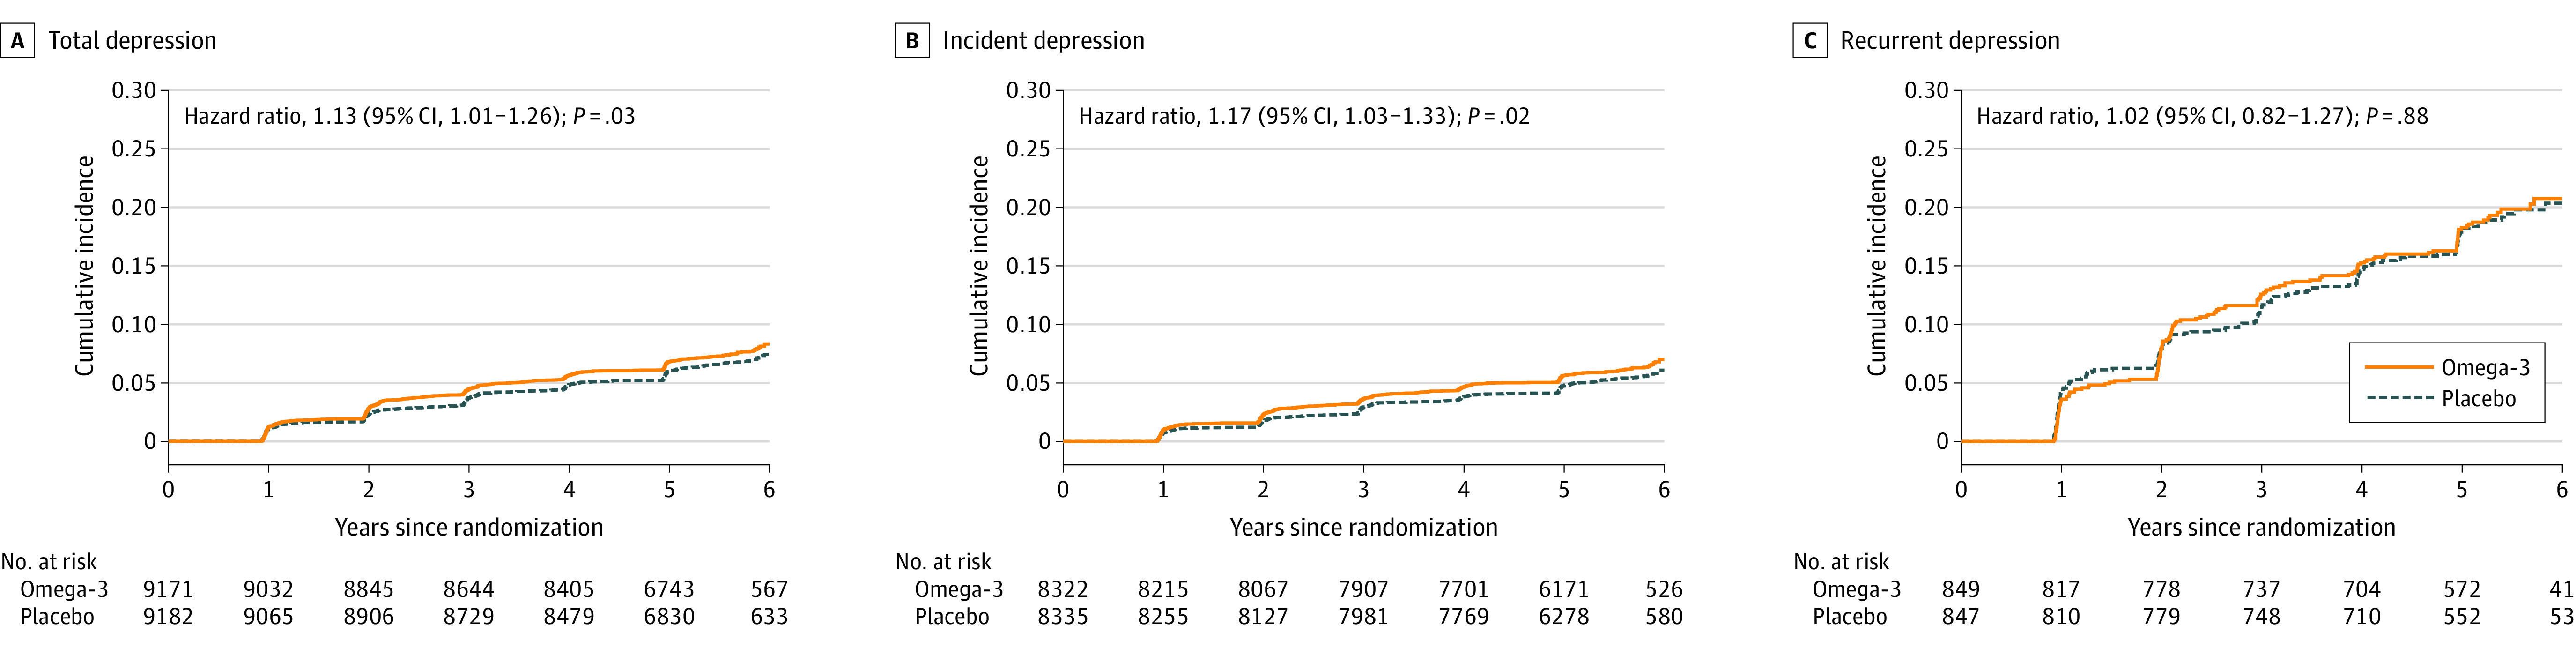
aTotal depression is the sum of incidence and recurrence of depression or clinically relevant depressive symptoms; incident depression cases arose from among the 16 657 participants with no history of depression at baseline, and recurrent depression cases arose from among the 1696 participants with a history of depression but were not under treatment or active in the past 2 years at baseline. Panels are provided to illustrate the cumulative incidence curves for incidence and recurrence separately from the total.
Table 2. 8-Item Patient Health Questionnaire (PHQ-8) Depression Scale Mood Scores Each Year Since Randomization vs Baselinea.
| Omega-3 group | Placebo group | Mean difference in change (95% CI)c | P value | P value for interactiond | |||
|---|---|---|---|---|---|---|---|
| No. of participants | Adjusted mean (95% CI)b | No. of participants | Adjusted mean (95% CI)b | ||||
| Baseline | 9171 | 1.09 (1.06 to 1.13) | 9182 | 1.11 (1.08 to 1.15) | |||
| Year 1 vs baseline | 8471 | 0.05 (0.01 to 0.09) | 8549 | 0.01 (−0.02 to 0.05) | 0.03 (−0.02 to 0.09) | .21 | |
| Year 2 vs baseline | 8354 | 0.07 (0.03 to 0.11) | 8371 | 0.04 (0.00 to 0.08) | 0.03 (−0.03 to 0.08) | .38 | |
| Year 3 vs baseline | 8116 | 0.10 (0.06 to 0.15) | 8172 | 0.06 (0.02 to 0.10) | 0.05 (−0.01 to 0.10) | .13 | |
| Year 4 vs baseline | 7676 | 0.08 (0.04 to 0.12) | 7690 | 0.05 (0.01 to 0.09) | 0.03 (−0.03 to 0.09) | .29 | |
| Year 5 vs baseline | 5295 | 0.18 (0.13 to 0.23) | 5252 | 0.19 (0.13 to 0.24) | −0.01 (−0.08 to 0.06) | .79 | .52 |
| 1- to 5-y Average vs baseline | 9171 | 9182 | 0.03 (−0.01 to 0.07) | .19 | |||
Assesses the severity of depressive symptoms (range, 0-24). Higher scores indicate higher severity of depression. The prespecified minimal clinically important difference for change in score was 0.5. Distribution of PHQ-8 scores in omega-3 fatty acid and placebo groups by study year is provided eFigure 4 in Supplement 2. Analyses were from general linear models of response profiles to estimate the means, with time modeled as indicator variables; models were controlled for age, sex, and vitamin D3 randomization group.
Adjusted means (95% CI) within each treatment group are shown at baseline and adjusted mean differences in change (95% CI) within each treatment group are shown for each follow-up time point. The repeated measures model used all available responses and can handle missing outcome data, which were assumed missing at random.
Net difference in change comparing the omega-3 fatty acid and placebo groups from the repeated measures model. The final row shows the main outcome of the net difference between treatment groups in PHQ-8 change scores averaged across all follow-up years (years 1-5) from the repeated measures model; all participants contributed data to the repeated measures analysis at 1 or more times.
The P value for interaction is from the test of the 5 degree-of-freedom treatment × time interaction term in the model.
Secondary Outcomes
There were no significant differences between treatment groups by subgroups, except elevated depression risk observed in women but not men, comparing omega-3 with placebo (Figure 3). There were no significant variations by subgroups in the effect of omega-3 on mean differences in change in mood scores (eTable 2 in Supplement 2). Study pill adherence was 90% or more in both treatment groups (Supplement 2). Results from sensitivity analyses that adjusted models of change in mood scores for initiation of antidepressants and used censoring at study pill nonadherence were consistent with primary analyses (eTables 3-5 in Supplement 2).
Figure 3. Primary, Secondary, and Nonprespecified and Post Hoc Outcomes Comparing Omega-3 Fatty Acids and Placeboa.
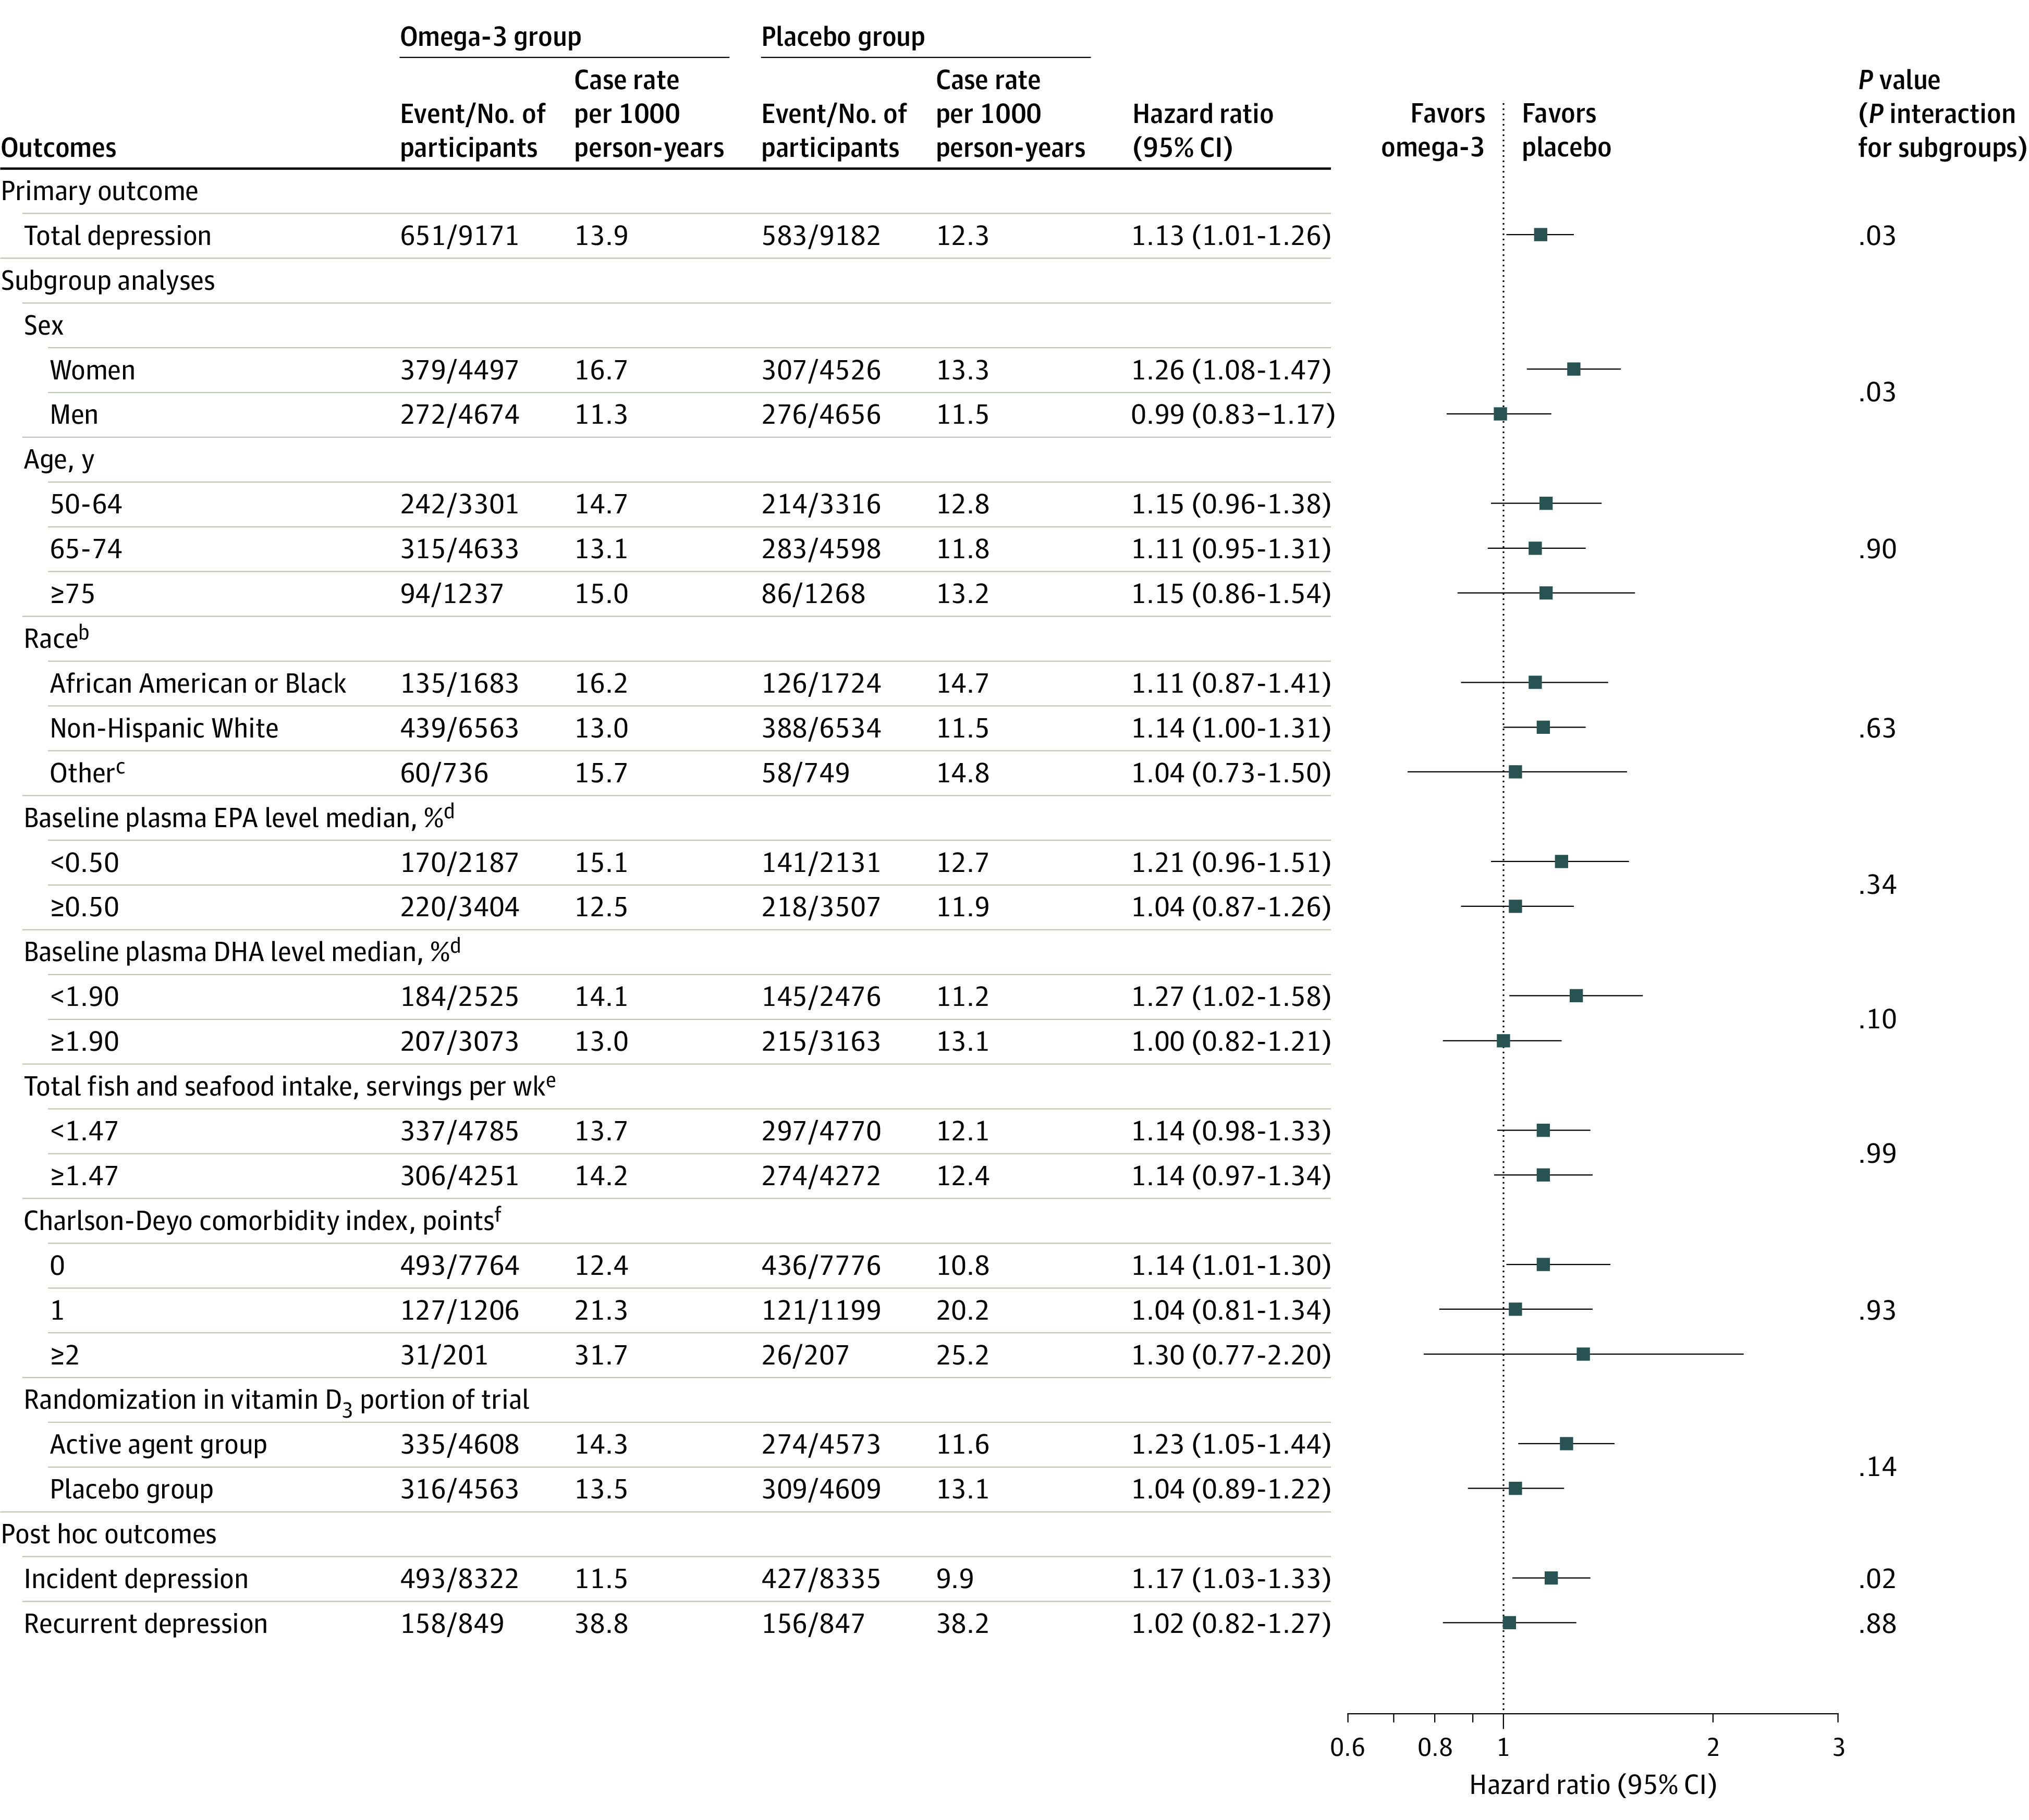
aAnalyses to compute hazard ratios (HRs) and CIs were from Cox regression models that were controlled for age, sex, and vitamin D3 randomization group; for subgroup analyses, interactions were tested using multiplicative interaction terms. Because of the potential for type I error due to multiple comparisons, findings for analyses of secondary end points and subgroups should be interpreted as exploratory. Total depression is the sum of incidence and recurrence of depression or clinically relevant depressive symptoms. Incident depression cases arose from among the 16 657 participants with no history of depression history at baseline. Recurrent depression arose from among the 1696 participants with a prior history of depression but were without clinically relevant symptoms or treatment for depression within the past 2 years at baseline.
bRace and ethnicity were self-reported by participants.
cIncluded Hispanic (not African American), Asian, Native Hawaiian or other Pacific Islander, multiple race, or unknown race or unknown ethnicity.
dBaseline plasma levels of EPA and DHA were expressed as a percent of total phospholipid fatty acids. Intake of food related to omega-3 fatty acids were assessed by modified version of Harvard food frequency questionnaire.
eThe combined category included intake of mackerel, salmon, sardines, bluefish, swordfish, canned tuna, cod, haddock, or halibut; breaded fish cakes, pieces, or fish sticks; shrimp, lobster, or scallops.
fThe Charlson-Deyo comorbidity index is a weighted comorbidity score derived from the sum of the scores for each of several major medical comorbid conditions; participants were categorized as having 0, 1, or 2 or more points.
DHA indicates docosahexaenoic acid; EPA, eicosapantaenoic acid.
Nonprespecified and Post Hoc Outcomes
There were 493 incident cases in the active treatment group (11.5 per 1000 person-years) and 427 incident cases in the placebo group (9.9 per 1000 person-years); there were 158 recurrent cases in the active treatment group (38.8 per 1000 person-years) and 156 recurrent cases in the placebo group (38.2 per 1000 person-years). Compared with the placebo group, the omega-3 group experienced an increased risk of incident depression (HR, 1.17; 95% CI, 1.03-1.33) but not recurrent depression (HR, 1.02; 95% CI, 0.82-1.27) or clinically relevant depressive symptoms (Figure 3). There were no significant differences in risk of depression or clinically relevant depressive symptoms with censoring at the development of cardiovascular disease or cancer, adjusting for cardiovascular disease or cancer as time-varying covariates, or using Fine-Gray competing-risks models (eTables 6-8 in Supplement 2). Repeated-measures negative binomial regression models showed no significant difference between groups in change in mood scores (eTable 9 in Supplement 2). Additional results from nonprespecified and post hoc analyses appear in eTables 10-17 and eFigures 1-3 in Supplement 2); eFigure 4 in Supplement 2 shows boxplots of the crude distributions of PHQ-8 scores in the omega-3 and placebo groups in each study year. Notable findings included (1) increased depression risk comparing the omega-3 group with the placebo group was limited to incident depression among women only (HR, 1.38; 95% CI, 1.15-1.65); (2) there were no differences in HRs, comparing omega-3 with placebo when excluding the first 2 years of follow-up; and (3) the likelihood of item-level symptoms in anhedonia and sadness was modestly increased among the omega-3 group compared with the placebo group, especially among women, but was not increased for other item-level symptoms. Results from secondary and post hoc analyses were not adjusted for multiple comparisons and were considered exploratory.
Adverse Events
Regarding serious and common adverse events among the 18 353 participants, prevalence values in omega-3 and placebo groups, respectively, were major cardiovascular events (2.7% and 2.9%), all-cause mortality (3.3% and 3.1%), suicide (0.02% and 0.01%), gastrointestinal bleeding (2.6% and 2.7%), easy bruising (24.8% and 25.1%), and stomach upset or pain (35.2% and 35.1%) (eTable 18 in Supplement 2). Full details on adverse events for the VITAL omega-3 group appear elsewhere.16
Discussion
Among adults aged 50 years or older without clinically relevant depressive symptoms at baseline, treatment with omega-3 supplements compared with placebo yielded mixed results, with a small but statistically significant increase in risk of depression or clinically relevant depressive symptoms but no difference in mood scores, over a median follow-up of 5.3 years. These findings do not support the use of omega-3 supplements in adults to prevent depression.
Results from prespecified subgroup analyses suggested a modest increased risk, comparing omega-3 with placebo, of depression or clinically relevant depressive symptoms among women; this was limited to incident depression and considered exploratory. Item-level exploratory analyses suggested that core depression features were most elevated in the omega-3 compared with placebo group; thus, the signal for higher risk in women appeared unlikely to be driven by higher endorsement in the omega-3 group of somatic or other complaints (eg, fatigue, appetite change, motor symptoms). Item-level analyses may help explain differences in results for the coprimary outcomes. Although there were no statistically significant differences between treatment groups in total PHQ-8 scores, the apparent increased risk of core features at the item level is consistent with the increased risk in depression events, primarily among older women at risk of incident depression. Although all subgroup and post hoc analyses are considered exploratory or hypothesis-generating, the findings point to future work. For example, further studies, including RCTs,25 will be needed to examine potential sex differences in mood responses to omega-3 and to address their biological basis (eg, potential differences in mood- or emotion-regulation brain circuitry in postmenopausal older women with vs without prior depression26,27,28).
Although results from this study contrast some evidence in support of omega-3 as adjunctive treatment or secondary prevention among high-risk persons with an established history of mood disorders, they are consistent with results from shorter-term and smaller-sample RCTs that showed no benefit of omega-3 for prevention of depression in community-based samples of adults without clinical depression at baseline.7,8,11 Also, evidence for omega-3 as a treatment augmentation for adults with major depressive disorder is modest and has not uniformly shown benefit.5,6,29,30 These results differ from the majority of evidence from meta-analyses and large observational studies addressing associations of dietary omega-3 fatty acid and fish intake with depression risk; these studies show protective associations in the range of 15% to 30% relative risk reductions when contrasting higher vs lower intake levels.3,31,32 However, in analyses using genomics tools to reduce bias and confounding,33 gene variants associated with plasma omega-3 fatty acid concentration are not related to risk of depression. Overall, these findings indicate no net benefit of omega-3 supplementation for depression prevention in the general adult population. Future work should clarify signals of small increased risks among older women, especially those with no prior history of depression.
Strengths of this study included: a large general population–derived national sample; high racial and ethnic diversity; moderate- to high-dose supplement given daily; long duration of double-blind randomized treatment; high follow-up and adherence; extensive covariate and biomarker data for characterizing subgroup; testing universal prevention of depression.
Limitations
This study has several limitations. First, outcome misclassification was possible due to self-reported depression variables; however, the data support validity of case ascertainment.14 Second, few persons in this sample would likely be severely omega-3–nutrient deficient; however, there is no established healthful lower limit of omega-3 blood levels. Third, although blood omega-3 index levels increased 55% in the omega-3 group vs the placebo group, it is unknown whether this increase correlated with attained brain levels. Fourth, the treatment agent did not include plant-based omega-3 and the EPA:DHA ratio was balanced; however, accumulating evidence indicates EPA as most relevant to depression.5 The study did not determine preventive effects of alternative compositions of omega-3, and meta-regression data from trials in older adults suggested omega-3 doses of 1.5 g/d or higher may be necessary for reducing depressive symptoms.9 Fifth, the study was underpowered to detect subgroup differences. Sixth, by design, this study did not include all participants originally randomized into the parent trial; although treatment groups were balanced at baseline on measured factors, there was less protection against potential confounding by unmeasured factors. Seventh, potential for type I error should be considered. In particular, because of the potential for type I error due to multiple comparisons in the current study and other VITAL substudies, findings from secondary and subgroup analyses should be interpreted as exploratory. Eighth, results are not generalizable to children or younger adults. Ninth, the PHQ-8 questionnaire does not measure suicidality, so effects of omega-3 on suicide outcomes could not be determined. The number of suicide deaths (3) was low, as expected in a study with fewer than 100 000 person-years.
Conclusions
Among adults aged 50 years or older without clinically relevant depressive symptoms at baseline, treatment with omega-3 supplements compared with placebo yielded mixed results, with a small but statistically significant increase in risk of depression or clinically relevant depressive symptoms but no difference in mood scores, over a median follow-up of 5.3 years. These findings do not support the use of omega-3 supplements in adults to prevent depression.
Study Protocol
eTable 1. Detailed Baseline Characteristics of Participants, According to Randomized Omega-3 Fatty Acid and Placebo Groups
eTable 2. Mean Difference in Change Since Baseline in PHQ-8 Score Comparing Omega-3 Fatty Acid and Placebo Groups, According to Baseline Sub-groups
eTable 3. Adjusted Means at Baseline and Mean Change (95% CI) in PHQ-8 Scores at Each Year Since Randomization Compared to Baseline, According to Omega-3 Fatty Acid and Placebo Groups, Censoring PHQ-8 Scores after Initiation of Antidepressants
eTable 4. Participant-Reported Adherence with the Omega-3 Fatty Acid and Placebo Study Pills (% of Pills Taken) for All Time Points, among Participants Responding to Compliance Questionnaires
eTable 5. Hazard Ratios and 95% CIs for Total, Incident and Recurrent Depression, According to Randomized Assignment to Omega-3 Fatty Acid or Placebo, with Additional Censoring at Time Taking Less than 2/3 Study Pills
eTable 6a. Hazard Ratios and 95% CIs for Total, Incident, and Recurrent Depression, According to Randomized Assignment to Omega-3 Fatty Acid or Placebo, with Additional Censoring at Incident CVD
eTable 6b. Hazard Ratios and 95% CIs for Total, Incident, and Recurrent Depression, According to Randomized Assignment to Omega-3 Fatty Acid or Placebo, with Additional Adjustment for CVD as a Time-Dependent Covariate
eTable 7a. Hazard Ratios and 95% CIs for Total, Incident, and Recurrent Depression, According to Randomized Assignment to Omega-3 Fatty Acid or Placebo, with Additional Censoring at Incident Cancer
eTable 7b. Hazard Ratios and 95% CIs for Total, Incident, and Recurrent Depression, According to Randomized Assignment to Omega-3 Fatty Acid or Placebo, with Additional Adjustment for Total Cancer as a Time-Dependent Covariate
Description of Results from Sensitivity Analyses in in eTable 6 and 7
eTable 8. Subdistribution Hazard Models Comparing the Risk of Depression in the Omega-3 Fatty Acid and Placebo Groups
eTable 9. Adjusted Differences in Change in PHQ-8 Scores Since Baseline, Comparing Omega-3 Fatty Acid to Placebo
eTable 10. Adjusted Means at Baseline and Mean Change (95% CI) in PHQ-8 Scores at Each Year Since Randomization Compared to Baseline, According to Omega-3 Fatty Acid and Placebo Groups, Censoring PHQ-8 Scores at Date of Mood Safety Letter
Description of Results from Sensitivity Analysis in eTable 10.
eTable 11. Adjusted Means at Baseline and Mean Change (95% CI) in PHQ-8 Scores at Each Year Since Randomization Compared to Baseline, According to Omega-3 Fatty Acid and Placebo Groups, Omitting Year 5 PHQ-8 Score
eTable 12. Total, Incident and Recurrent Rates of Depression, per 1000 Person-Years (p-y), by Omega-3 Fatty Acid and Placebo Groups
eTable 13. Means (SDs) of PHQ-8 Scores at Each Time Point, in Omega-3 Fatty Acid and Placebo Groups
eTable 14a. Hazard Ratios and 95% CIs for Total, Incident, and Recurrent Depression among Older Males, According to Randomized Assignment to Omega-3 Fatty Acid or Placebo Groups
eTable 14b. Hazard Ratios and 95% CIs for Total, Incident, and Recurrent Depression among Older Females, According to Randomized Assignment to Omega-3 Fatty Acid or Placebo Groups
eTable 15. Hazard Ratios and 95% CIs for Total, Incident, and Recurrent Depression, According to Randomized Assignment to Omega-3 Fatty Acid or Placebo, Excluding the First 2 Years of Follow-up
eTable 16. Hazard Ratios and 95% CIs of Total, Incident, and Recurrent Depression among Participants with Mild Depressive Symptoms, According to Randomized Assignment to Omega-3 Fatty Acid or Placebo Groups
eTable 17. Adjusted Means at Baseline and Mean Change (95% CI) in PHQ-8 Scores at Each Year Since Randomization Compared to Baseline, According to Omega-3 Fatty Acid and Placebo Groups, among Participants with Mild Depressive Symptoms
eTable 18. Adverse Events According to Omega-3 Fatty Acid and Placebo Groups
eFigure 1. Adjusted Differences in Change in Likelihood of PHQ-8 Item-Level Symptoms, Comparing Omega-3 Fatty Acid to Placebo
eFigure 2. Adjusted Differences in Change in Likelihood of PHQ-8 Item-Level Symptoms, Comparing Omega-3 Fatty Acid to Placebo, Stratified by Biological Sex
eFigure 3. Kaplan-Meier Survival Curves Stratified by Biological Sex for Time since Randomization until Occurrence of Primary Outcome (Total Depression), in Omega-3 Fatty Acid and Placebo Groups
eFigure 4. Box Plots of Crude PHQ-8 Scores in the Omega-3 Fatty Acid and Placebo Groups in Each Study Year
eReferences
Data Sharing Statement
References
- 1.Reynolds CF III, Cuijpers P, Patel V, et al. Early intervention to reduce the global health and economic burden of major depression in older adults. Annu Rev Public Health. 2012;33:123-135. doi: 10.1146/annurev-publhealth-031811-124544 [DOI] [PMC free article] [PubMed] [Google Scholar]
- 2.Hibbeln JR. Fish consumption and major depression. Lancet. 1998;351(9110):1213. doi: 10.1016/S0140-6736(05)79168-6 [DOI] [PubMed] [Google Scholar]
- 3.Li F, Liu X, Zhang D. Fish consumption and risk of depression: a meta-analysis. J Epidemiol Community Health. 2016;70(3):299-304. doi: 10.1136/jech-2015-206278 [DOI] [PubMed] [Google Scholar]
- 4.Maes M, Smith RS. Fatty acids, cytokines, and major depression. Biol Psychiatry. 1998;43(5):313-314. [DOI] [PubMed] [Google Scholar]
- 5.Guu TW, Mischoulon D, Sarris J, et al. International Society for Nutritional Psychiatry research practice guidelines for omega-3 fatty acids in the treatment of major depressive disorder. Psychother Psychosom. 2019;88(5):263-273. doi: 10.1159/000502652 [DOI] [PubMed] [Google Scholar]
- 6.Guu TW, Mischoulon D, Sarris J, et al. A multi-national, multi-disciplinary Delphi consensus study on using omega-3 polyunsaturated fatty acids (n-3 PUFAs) for the treatment of major depressive disorder. J Affect Disord. 2020;265:233-238. doi: 10.1016/j.jad.2020.01.050 [DOI] [PubMed] [Google Scholar]
- 7.Appleton KM, Rogers PJ, Ness AR. Updated systematic review and meta-analysis of the effects of n-3 long-chain polyunsaturated fatty acids on depressed mood. Am J Clin Nutr. 2010;91(3):757-770. doi: 10.3945/ajcn.2009.28313 [DOI] [PubMed] [Google Scholar]
- 8.Grosso G, Pajak A, Marventano S, et al. Role of omega-3 fatty acids in the treatment of depressive disorders: a comprehensive meta-analysis of randomized clinical trials. PLoS One. 2014;9(5):e96905. doi: 10.1371/journal.pone.0096905 [DOI] [PMC free article] [PubMed] [Google Scholar]
- 9.Bai ZG, Bo A, Wu SJ, Gai QY, Chi I. Omega-3 polyunsaturated fatty acids and reduction of depressive symptoms in older adults: a systematic review and meta-analysis. J Affect Disord. 2018;241:241-248. doi: 10.1016/j.jad.2018.07.057 [DOI] [PubMed] [Google Scholar]
- 10.Committee on Prevention of Mental Disorders : Institute of Medicine. Reducing Risks for Mental Disorders: Frontiers for Preventive Intervention Research. National Academy Press; 1994. [PubMed] [Google Scholar]
- 11.Bot M, Brouwer IA, Roca M, et al. ; MooDFOOD Prevention Trial Investigators . Effect of multinutrient supplementation and food-related behavioral activation therapy on prevention of major depressive disorder among overweight or obese adults with subsyndromal depressive symptoms: the MooDFOOD randomized clinical trial. JAMA. 2019;321(9):858-868. doi: 10.1001/jama.2019.0556 [DOI] [PMC free article] [PubMed] [Google Scholar]
- 12.Cuijpers P. Examining the effects of prevention programs on the incidence of new cases of mental disorders: the lack of statistical power. Am J Psychiatry. 2003;160(8):1385-1391. doi: 10.1176/appi.ajp.160.8.1385 [DOI] [PubMed] [Google Scholar]
- 13.Berk M, Woods RL, Nelson MR, et al. Effect of aspirin vs placebo on the prevention of depression in older people: a randomized clinical trial. JAMA Psychiatry. 2020;77(10):1012-1020. doi: 10.1001/jamapsychiatry.2020.1214 [DOI] [PMC free article] [PubMed] [Google Scholar]
- 14.Okereke OI, Reynolds CF III, Mischoulon D, et al. Effect of long-term vitamin D3 supplementation vs placebo on risk of depression or clinically relevant depressive symptoms and on change in mood scores: a randomized clinical trial. JAMA. 2020;324(5):471-480. doi: 10.1001/jama.2020.10224 [DOI] [PMC free article] [PubMed] [Google Scholar]
- 15.Manson JE, Cook NR, Lee IM, et al. ; VITAL Research Group . Vitamin D supplements and prevention of cancer and cardiovascular disease. N Engl J Med. 2019;380(1):33-44. doi: 10.1056/NEJMoa1809944 [DOI] [PMC free article] [PubMed] [Google Scholar]
- 16.Manson JE, Cook NR, Lee IM, et al. ; VITAL Research Group . Marine n-3 Fatty acids and prevention of cardiovascular disease and cancer. N Engl J Med. 2019;380(1):23-32. doi: 10.1056/NEJMoa1811403 [DOI] [PMC free article] [PubMed] [Google Scholar]
- 17.Okereke OI, Reynolds CF III, Mischoulon D, et al. The VITamin D and OmegA-3 TriaL-Depression Endpoint Prevention (VITAL-DEP): rationale and design of a large-scale ancillary study evaluating vitamin D and marine omega-3 fatty acid supplements for prevention of late-life depression. Contemp Clin Trials. 2018;68:133-145. doi: 10.1016/j.cct.2018.02.017 [DOI] [PMC free article] [PubMed] [Google Scholar]
- 18.Kroenke K, Spitzer RL, Williams JB. The PHQ-9: validity of a brief depression severity measure. J Gen Intern Med. 2001;16(9):606-613. doi: 10.1046/j.1525-1497.2001.016009606.x [DOI] [PMC free article] [PubMed] [Google Scholar]
- 19.Kroenke K, Strine TW, Spitzer RL, Williams JB, Berry JT, Mokdad AH. The PHQ-8 as a measure of current depression in the general population. J Affect Disord. 2009;114(1-3):163-173. doi: 10.1016/j.jad.2008.06.026 [DOI] [PubMed] [Google Scholar]
- 20.Fitzmaurice GM, Laird NM, Ware JH. Modelling the mean: analyzing response profiles. In: Fitzmaurice GM, Laird NM, Ware JH, eds. Applied Longitudinal Analysis. John Wiley & Sons; 2004:103-139. [Google Scholar]
- 21.Charlson ME, Pompei P, Ales KL, MacKenzie CR. A new method of classifying prognostic comorbidity in longitudinal studies: development and validation. J Chronic Dis. 1987;40(5):373-383. doi: 10.1016/0021-9681(87)90171-8 [DOI] [PubMed] [Google Scholar]
- 22.Deyo RA, Cherkin DC, Ciol MA. Adapting a clinical comorbidity index for use with ICD-9-CM administrative databases. J Clin Epidemiol. 1992;45(6):613-619. doi: 10.1016/0895-4356(92)90133-8 [DOI] [PubMed] [Google Scholar]
- 23.Fine JP, Gray RJ. A proportional hazards model for the subdistribution of a competing risk. J Am Stat Assoc. 1999;94(446):496-509. doi: 10.1080/01621459.1999.10474144 [DOI] [Google Scholar]
- 24.Luijendijk HJ, van den Berg JF, Dekker MJ, et al. Incidence and recurrence of late-life depression. Arch Gen Psychiatry. 2008;65(12):1394-1401. doi: 10.1001/archpsyc.65.12.1394 [DOI] [PubMed] [Google Scholar]
- 25.Freeman MP, Hibbeln JR, Silver M, et al. Omega-3 fatty acids for major depressive disorder associated with the menopausal transition: a preliminary open trial. Menopause. 2011;18(3):279-284. doi: 10.1097/gme.0b013e3181f2ea2e [DOI] [PMC free article] [PubMed] [Google Scholar]
- 26.Albert K, Ledet T, Taylor W, Newhouse P. Estradiol administration differentially affects the response to experimental psychosocial stress in post-menopausal women with or without a history of major depression. J Affect Disord. 2020;261:204-210. doi: 10.1016/j.jad.2019.09.074 [DOI] [PMC free article] [PubMed] [Google Scholar]
- 27.Jacobs EG, Holsen LM, Lancaster K, et al. 17β-estradiol differentially regulates stress circuitry activity in healthy and depressed women. Neuropsychopharmacology. 2015;40(3):566-576. doi: 10.1038/npp.2014.203 [DOI] [PMC free article] [PubMed] [Google Scholar]
- 28.Vega JN, Taylor WD, Gandelman JA, et al. Persistent intrinsic functional network connectivity alterations in middle-aged and older women with remitted depression. Front Psychiatry. 2020;11:62. doi: 10.3389/fpsyt.2020.00062 [DOI] [PMC free article] [PubMed] [Google Scholar]
- 29.Freeman MP, Hibbeln JR, Wisner KL, et al. Omega-3 fatty acids: evidence basis for treatment and future research in psychiatry. J Clin Psychiatry. 2006;67(12):1954-1967. doi: 10.4088/JCP.v67n1217 [DOI] [PubMed] [Google Scholar]
- 30.Sarris J, Byrne GJ, Stough C, et al. Nutraceuticals for major depressive disorder—more is not merrier: an 8-week double-blind, randomised, controlled trial. J Affect Disord. 2019;245:1007-1015. doi: 10.1016/j.jad.2018.11.092 [DOI] [PubMed] [Google Scholar]
- 31.Grosso G, Micek A, Marventano S, et al. Dietary n-3 PUFA, fish consumption and depression: a systematic review and meta-analysis of observational studies. J Affect Disord. 2016;205:269-281. doi: 10.1016/j.jad.2016.08.011 [DOI] [PubMed] [Google Scholar]
- 32.Molendijk M, Molero P, Ortuño Sánchez-Pedreño F, Van der Does W, Angel Martínez-González M. Diet quality and depression risk: a systematic review and dose-response meta-analysis of prospective studies. J Affect Disord. 2018;226:346-354. doi: 10.1016/j.jad.2017.09.022 [DOI] [PubMed] [Google Scholar]
- 33.Milaneschi Y, Peyrot WJ, Nivard MG, Mbarek H, Boomsma DI, W J H Penninx B. A role for vitamin D and omega-3 fatty acids in major depression? an exploration using genomics. Transl Psychiatry. 2019;9(1):219. doi: 10.1038/s41398-019-0554-y [DOI] [PMC free article] [PubMed] [Google Scholar]
Associated Data
This section collects any data citations, data availability statements, or supplementary materials included in this article.
Supplementary Materials
Study Protocol
eTable 1. Detailed Baseline Characteristics of Participants, According to Randomized Omega-3 Fatty Acid and Placebo Groups
eTable 2. Mean Difference in Change Since Baseline in PHQ-8 Score Comparing Omega-3 Fatty Acid and Placebo Groups, According to Baseline Sub-groups
eTable 3. Adjusted Means at Baseline and Mean Change (95% CI) in PHQ-8 Scores at Each Year Since Randomization Compared to Baseline, According to Omega-3 Fatty Acid and Placebo Groups, Censoring PHQ-8 Scores after Initiation of Antidepressants
eTable 4. Participant-Reported Adherence with the Omega-3 Fatty Acid and Placebo Study Pills (% of Pills Taken) for All Time Points, among Participants Responding to Compliance Questionnaires
eTable 5. Hazard Ratios and 95% CIs for Total, Incident and Recurrent Depression, According to Randomized Assignment to Omega-3 Fatty Acid or Placebo, with Additional Censoring at Time Taking Less than 2/3 Study Pills
eTable 6a. Hazard Ratios and 95% CIs for Total, Incident, and Recurrent Depression, According to Randomized Assignment to Omega-3 Fatty Acid or Placebo, with Additional Censoring at Incident CVD
eTable 6b. Hazard Ratios and 95% CIs for Total, Incident, and Recurrent Depression, According to Randomized Assignment to Omega-3 Fatty Acid or Placebo, with Additional Adjustment for CVD as a Time-Dependent Covariate
eTable 7a. Hazard Ratios and 95% CIs for Total, Incident, and Recurrent Depression, According to Randomized Assignment to Omega-3 Fatty Acid or Placebo, with Additional Censoring at Incident Cancer
eTable 7b. Hazard Ratios and 95% CIs for Total, Incident, and Recurrent Depression, According to Randomized Assignment to Omega-3 Fatty Acid or Placebo, with Additional Adjustment for Total Cancer as a Time-Dependent Covariate
Description of Results from Sensitivity Analyses in in eTable 6 and 7
eTable 8. Subdistribution Hazard Models Comparing the Risk of Depression in the Omega-3 Fatty Acid and Placebo Groups
eTable 9. Adjusted Differences in Change in PHQ-8 Scores Since Baseline, Comparing Omega-3 Fatty Acid to Placebo
eTable 10. Adjusted Means at Baseline and Mean Change (95% CI) in PHQ-8 Scores at Each Year Since Randomization Compared to Baseline, According to Omega-3 Fatty Acid and Placebo Groups, Censoring PHQ-8 Scores at Date of Mood Safety Letter
Description of Results from Sensitivity Analysis in eTable 10.
eTable 11. Adjusted Means at Baseline and Mean Change (95% CI) in PHQ-8 Scores at Each Year Since Randomization Compared to Baseline, According to Omega-3 Fatty Acid and Placebo Groups, Omitting Year 5 PHQ-8 Score
eTable 12. Total, Incident and Recurrent Rates of Depression, per 1000 Person-Years (p-y), by Omega-3 Fatty Acid and Placebo Groups
eTable 13. Means (SDs) of PHQ-8 Scores at Each Time Point, in Omega-3 Fatty Acid and Placebo Groups
eTable 14a. Hazard Ratios and 95% CIs for Total, Incident, and Recurrent Depression among Older Males, According to Randomized Assignment to Omega-3 Fatty Acid or Placebo Groups
eTable 14b. Hazard Ratios and 95% CIs for Total, Incident, and Recurrent Depression among Older Females, According to Randomized Assignment to Omega-3 Fatty Acid or Placebo Groups
eTable 15. Hazard Ratios and 95% CIs for Total, Incident, and Recurrent Depression, According to Randomized Assignment to Omega-3 Fatty Acid or Placebo, Excluding the First 2 Years of Follow-up
eTable 16. Hazard Ratios and 95% CIs of Total, Incident, and Recurrent Depression among Participants with Mild Depressive Symptoms, According to Randomized Assignment to Omega-3 Fatty Acid or Placebo Groups
eTable 17. Adjusted Means at Baseline and Mean Change (95% CI) in PHQ-8 Scores at Each Year Since Randomization Compared to Baseline, According to Omega-3 Fatty Acid and Placebo Groups, among Participants with Mild Depressive Symptoms
eTable 18. Adverse Events According to Omega-3 Fatty Acid and Placebo Groups
eFigure 1. Adjusted Differences in Change in Likelihood of PHQ-8 Item-Level Symptoms, Comparing Omega-3 Fatty Acid to Placebo
eFigure 2. Adjusted Differences in Change in Likelihood of PHQ-8 Item-Level Symptoms, Comparing Omega-3 Fatty Acid to Placebo, Stratified by Biological Sex
eFigure 3. Kaplan-Meier Survival Curves Stratified by Biological Sex for Time since Randomization until Occurrence of Primary Outcome (Total Depression), in Omega-3 Fatty Acid and Placebo Groups
eFigure 4. Box Plots of Crude PHQ-8 Scores in the Omega-3 Fatty Acid and Placebo Groups in Each Study Year
eReferences
Data Sharing Statement