Abstract
Objectives:
The aims of the present study were to construct a deep learning model for automatic segmentation of the temporomandibular joint (TMJ) disc on magnetic resonance (MR) images, and to evaluate the performances using the internal and external test data.
Methods:
In total, 1200 MR images of closed and open mouth positions in patients with temporomandibular disorder (TMD) were collected from two hospitals (Hospitals A and B). The training and validation data comprised 1000 images from Hospital A, which were used to create a segmentation model. The performance was evaluated using 200 images from Hospital A (internal validity test) and 200 images from Hospital B (external validity test).
Results:
Although the analysis of performance determined with data from Hospital B showed low recall (sensitivity), compared with the performance determined with data from Hospital A, both performances were above 80%. Precision (positive predictive value) was lower when test data from Hospital A were used for the position of anterior disc displacement. According to the intra-articular TMD classification, the proportions of accurately assigned TMJs were higher when using images from Hospital A than when using images from Hospital B.
Conclusion:
The segmentation deep learning model created in this study may be useful for identifying disc positions on MR images.
Keywords: Artificial intelligence, Deep learning, Temporomandibular joint disc, Magnetic resonance imaging
Introduction
Clarification of disc position is essential for evaluating temporomandibular joint (TMJ) disorder; magnetic resonance (MR) imaging has become the most reliable examination technique to verify this location.1 However, identification of the disc is difficult on MR images for observers who have minimal experience in MR image interpretation.
Recently, researchers have described the use of deep learning (DL) systems with convolutional neural networks, in combination with various computer-assisted detection/diagnosis systems for maxillofacial pathologies using conventional radiography,2–5 6–8CT and ultrasonography.9,10 DL systems can perform classification, object detection, and super resolution functions. Semantic segmentation is an important DL technique that enables the automatic identification of certain structures on images.11 This technique has been applied to knee joint structures including meniscus and cartilage, yielding successful results.12,13 To the best of our knowledge, only one trial has combined MR and cone-beam CT images to improve the identification of TMJ disc position14; however, no systems have been constructed using segmentation techniques to assist in TMJ diagnosis.
The aims of the present study were to construct a deep learning model for automatic segmentation of the TMJ disc on MR images, and to evaluate the performances using the internal and external test data.
Methods and materials
The protocol of this study was approved by the ethical committees of Aichi Gakuin University (approval No. 496) and Tsurumi University (approval No. 1836); it was performed in accordance with the Declaration of Helsinki.
Patients
This study included 600 TMJs in 357 patients who visited the TMJ clinics in two hospitals (Hospitals A and B) because of TMJ symptoms (e.g. pain and/or limited mandibular movement) and underwent MR examinations. All patients were examined in both closed and open mouth positions. Therefore, 1200 MR images of patients with temporomandibular disorder (TMD) were used. Of these, 1000 and 200 images of patients with TMD were obtained at the Hospitals A and B, respectively. Eight hundred of the 1000 images obtained from Hospital A were used for the learning process (i.e. as training and validation data); the remaining 200 images from Hospital A were used as test data for internal validity. All 200 images from Hospital B were used solely for external validation. All images were collected based on the disc location in the closed mouth position; thus, the numbers of normal and anterior disc displacement positions were equal. The details of image distributions according to the classifications of disc and condylar positions are summarized in Tables 1 and 2. The details of image distributions according to the intra-articular TMD classification1 are shown in Table 3. These classifications were performed by three radiologists (CI, KK, and EA) who each had more than 20 years of experience interpreting MR images. When classifications differed among the radiologists, the final decisions were reached by discussion and subsequent consensus.
Table 1.
Number of training and validation data according to the classification of disc and condylar positions (number of images)
| Closed mouth | Open mouth | Total | ||
|---|---|---|---|---|
| Disc position | Normal | 200 | 239 | 439 |
| Anterior displacement | 200 | 161 | 361 | |
| Total | 400 | 400 | 800 | |
| Condylar position | Posterior to the articular eminence | 400 | 182 | 582 |
| Anterior to the articular eminence | 0 | 218 | 218 | |
| Total | 400 | 400 | 800 |
Table 2.
Number of test data according to the classification of disc and condylar positions (number of images)
| Classification | Hospital | Closed mouth | Open mouth | Total | |
|---|---|---|---|---|---|
| Disk position | Normal | Hospital A | 50 | 58 | 108 |
| Hospital B | 50 | 58 | 108 | ||
| Total | 100 | 116 | 216 | ||
| Anterior displacement | Hospital A | 50 | 42 | 92 | |
| Hospital B | 50 | 42 | 92 | ||
| Total | 100 | 84 | 184 | ||
| Condylar position | Posterior to the articular eminence | Hospital A | 100 | 52 | 152 |
| Hospital B | 100 | 24 | 124 | ||
| Total | 200 | 76 | 276 | ||
| Anterior to the articular eminence | Hospital A | 0 | 48 | 48 | |
| Hospital B | 0 | 76 | 76 | ||
| Total | 0 | 124 | 124 | ||
Table 3.
Number of data according to the classification of intra-articular TMD and accurately assigned TMJs (number of TMJs)
| Classification | Training and validation data | Test data | Accurately assigned TMJ | |||
|---|---|---|---|---|---|---|
| Hospital A | Hospital A | Hospital B | Hospital A | Hospital B | Total | |
| Normal | 200 | 50 | 50 | 46 (92.0%) | 38 (76.0%) | 84/100 (84.0%) |
| Anterior disc displacement with reduction | 39 | 8 | 8 | 8 (100.0%) | 8 (100.0%) | 16/16 (100.0%) |
| Anterior disc displacement without reduction with limited opening | 100 | 29 | 15 | 28 (96.6%) | 12 (80.0%) | 40/44 (90.9%) |
| Anterior disc dispalcement without reduction without limited opening | 61 | 13 | 27 | 13 (100.0%) | 18 (66.7%) | 31/40 (77.5%) |
| Total | 400 | 100 | 100 | 95 (95.0%) | 76 (76.0%) | 171/200 (85.5%) |
TMD, Temporomandibular disoeder; TMJ, Temporomandibular joint.
Accurately assigned TMJ denotes the TMJ with true-positive evaluations both for closed and open mouth positions.
MR examinations
MR images of patients at Hospital A were obtained with a 3 T super conductivity apparatus (Signa HDxt; GE Healthcare, Tokyo, Japan) at an outside hospital. On proton density axial images (repetition time/echo time: 2000 ms/12 ms) where the condyles showed maximum areas in the closed mouth position, the sagittal planes were considered perpendicular to the long axis of the condyle. Thus, proton density sagittal images were acquired with 3 mm thickness in both closed and open mouth positions. Images containing the short axis of the condyle, which were defined as images that showed the maximum length of the perpendicular line to the long axis, were selected for image preparation (Figure 1a and b).
Figure 1.
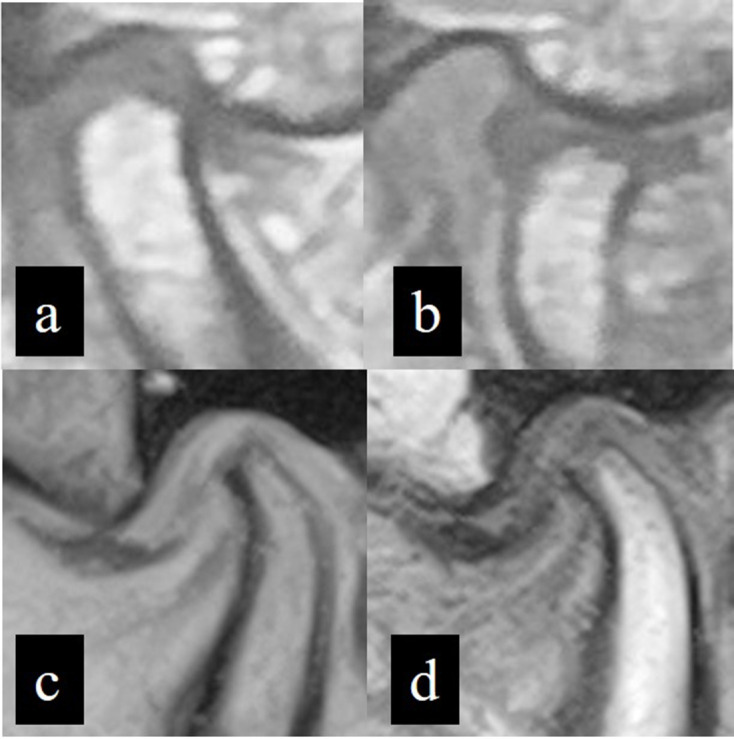
Representative MR images obtained from two Hospitals. Proton density MR images obtained from Hospital A in closed (a) and open (b) mouth positions. A T2W MR image from Hospital B in closed mouth position (c) and a T1W MR image from Hospital B in open mouth position (d).
In Hospital B, images were obtained with a 0.4 T normal conductivity scanner (APERTO Inspire, Hitachi, Tokyo, Japan). As in images from Hospital A, the sagittal plane was determined; images of closed and open mouth positions were obtained. The sequences and thicknesses used were T2W (repetition time/echo time: 400 ms/140 ms) with 4 mm thickness and T1W (repetition time/echo time: 1100 ms/30 ms) with 5 mm thickness for the closed and open mouth positions, respectively (Figure 1c and d).
Image data preparation
Because there was no MR machine in Hospital A, the MR images were provided in film format from an outside hospital. Therefore, the MR images were digitized using a digital camera (CyberShot DSC-W810, Sony Corporation, Tokyo, Japan) in 5152 × 3864-pixel color JPEG format. These images were obtained with the films placed on a light box and located at a distance of approximately 50 cm from the camera. Thereafter, images were converted to 8-bit grayscale JPEG images and cropped as 128 × 128 pixel square images. Appropriately cropped images included the disc and the upper portion of the condyle, together with the top of glenoid fossa and the bottom of the articular eminence. On the training and validation images, a radiologist (MiN), who had more than 6 years of experience interpreting MR images of patients with TMD, segmented the disc by rendering the corresponding areas in red with a graphical software (Photoshop CS6 version 13.0.6, Adobe Inc., San Jose, CA, USA) (Figure 2). These segmentations were verified by another radiologist (EA) with 20 years of experience interpreting MR images. These annotations did not result in definitive differences in disc identification between the two radiologists; small differences were corrected by consensus between the two radiologists. For the testing process, 200 images from Hospital A were prepared without annotation as internal test data, using a procedure similar to that of the training and validation images.
Figure 2.
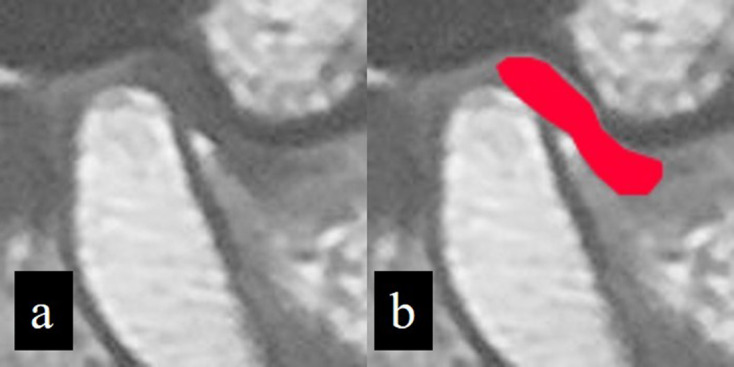
Annotation of TMJ disc. On a cropped image (a), the TMJ disc area is annotated by the addition of red color (b).
As external test data, MR images from Hospital B were downloaded in 512 × 512 pixel JPEG format from the image server of Hospital B and were cropped directly from the downloaded images into 128 × 128 pixel format in a manner similar to that used for images from Hospital A.
Deep learning architecture and processes
To create the learning model, a Neural Network Console (Sony Corporation, Tokyo, Japan) equipped a graphic processing unit (GeForce 1080 Ti; NVIDIA, Santa Clara, CA, USA) was used with a modified U-Net convolutional neural network (version 1.6), as suggested by Ronneberger et al,15 on the Windows 10 operating system (Microsoft Corp., Redmond, WA, USA). This convolutional neural network consisted of a convolutional layer, a rectified linear unit activation function layer and a pooling layer (Figure 3). Three hundred epochs were performed with an initial learning rate of 0.001 and the adaptive moment estimation (Adam) solver. Test data were applied to the learning model and the output images showed segmented disc area.
Figure 3.

Architecture of U-net. The U-net used consisted of a convolutional layer, a rectified linear unit activation layer, and a pooling layer.
Segmentation performance evaluation
Before evaluation, the ground-truth of disc area was identified by a radiologist (MiN) for the test image data using the methods described above for disc segmentation on training and validation images. These ground-truth images were compared with the images outputted from the learning model created using the following Intersection over Union (IoU) method:
IoU = S (P ∩G)/S (P U G)
where P was the red-colored area on images predicted by the learning model, G was ground-truth disc area, S (P ∩ G) was the overlapped area of P and G, and S (P U G) was the combined area of P and G. When the IoU was ≥0.7, the disc was considered correctly segmented as true positive. When areas other than the true disc were erroneously assigned as disc areas with more than 100 pixels on images outputted by the model, they were considered false-positive. Subsequently, the numbers of pixels of these areas were calculated on superimposed images using Photoshop software (Adobe Inc.).
Performances were evaluated according to the classifications of disc and condylar positions by determining the recall (sensitivity), precision (positive predictive value), and F-measure as follows:
Recall = TP/(TP +FN)
Precision = TP/(TP +FP)
F measure = 2×recall ×precision/(recall +precision)
where TP, FN, and FP were true-positive, false-negative, and false-positive, respectively. F measure was a harmonic mean of recall and precision, corresponding to the Dice coefficient.
Performance evaluation according to intra-articular TMD classification
The TMJs in test images were classified into one of four types1 based on findings in both closed and open mouth positions (Table 3). When the discs were correctly segmented to indicate true-positive results on both closed and open mouth images, the TMJs were considered to be accurately assigned.
Results
During the learning process, the learning model was created in 1 h and 27 min; during the testing process, the model was tested in 14 s, using all 400 test datasets.
The means and standard deviations of IoU values were 97.6 and 9.4, and 87.8 and 26.5 for the test data from Hospitals A and B, respectively. The performances were summarized according to the classifications of disc and condylar positions (Table 4). All recalls were relatively high (>80%). For all disc and condylar positions, the recalls were lower when using test data from Hospital B (external validity test) than when using test data from Hospital A (internal validity test). No outputted images estimated by the model showed more than two false-positive areas. Relatively lower precisions, with many false-positive images, were observed when the test data included images of the anterior disc displacement position from Hospital A.
Table 4.
Performance of the model created accroding to the classifications of disc and condylar positions (number of images)
| Classification | Hospital | True-positive | False-positive | False-negative | Recall (%) | Precision (%) | F measure (%) | |
|---|---|---|---|---|---|---|---|---|
| Disc position | Normal | Hospital A | 103 | 12 | 5 | 95.3 | 89.7 | 92.3 |
| Hospital B | 95 | 10 | 13 | 87.9 | 90.7 | 89.2 | ||
| Total | 198 | 22 | 18 | 91.6 | 90.2 | 90.8 | ||
| Anterior displacement | Hospital A | 91 | 27 | 1 | 98.9 | 77.1 | 86.7 | |
| Hospital B | 80 | 9 | 12 | 87.0 | 89.9 | 88.4 | ||
| Total | 171 | 36 | 13 | 92.9 | 82.6 | 87.5 | ||
| Condylar position | Posterior to the articular eminence | Hospital A | 147 | 32 | 5 | 96.7 | 82.1 | 88.8 |
| Hospital B | 116 | 7 | 8 | 93.5 | 94.3 | 93.9 | ||
| Total | 263 | 39 | 13 | 95.3 | 87.0 | 91.0 | ||
| Anterior to the articular eminence | Hospital A | 48 | 7 | 0 | 100.0 | 87.2 | 93.2 | |
| Hospital B | 62 | 12 | 14 | 81.6 | 83.8 | 82.7 | ||
| Total | 110 | 19 | 14 | 88.7 | 85.3 | 87.0 |
With respect to the intra-articular TMD classification, the proportions of accurately assigned TMJs were higher when using data from Hospital A than when using data from Hospital B. The lowest value of 66.7% was observed when using data from Hospital B, which showed anterior disc displacement without reduction without limited opening. Some representative results are shown in Figures 4–6.
Figure 4.
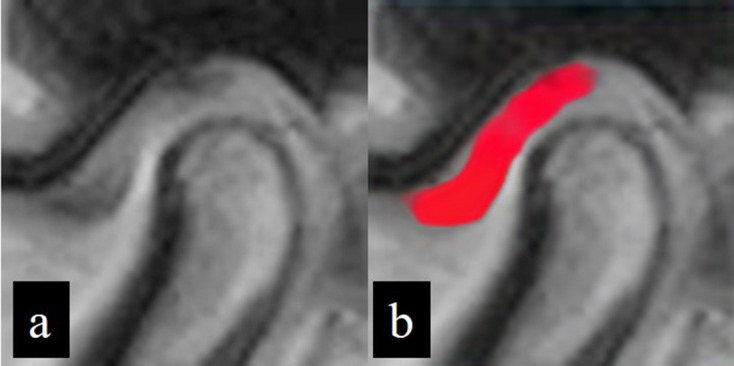
Successfully segmented image showing a true positive result. Inputted image data (a) and corresponding outputted image data (b) following application of the learning model. The disc area is almost fully colored in red.
Figure 5.
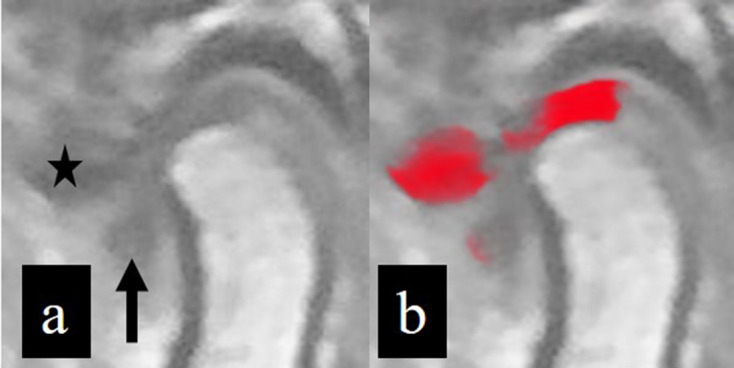
Inputted (a) and outputted (b) image data. The disc situated superior to the condylar head is well segmented, but the anterior disc displacement area (arrow) cannot be identified; this indicates a false-negative result. The cortical area of the articular eminence (star) is erroneously identified as a disc area, indicating a false-positive result.
Figure 6.
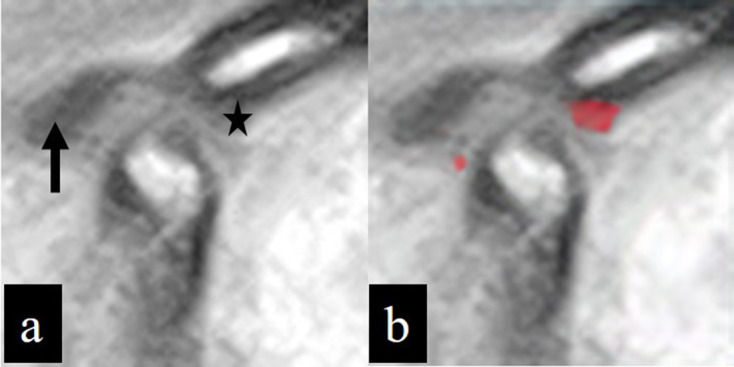
MR image of the open mouth position in a patient with TMD, classified as anterior disc displacement without reduction without limited opening. The disc displacement (arrow) in the inputted image (a) cannot be segmented in the outputted image (b), while the eminence (star) in the inputted image (a) is misidentified as a disc in the outputted image (b).
Discussion
DL segmentation enables clear visualization of specific structures on multiple images. In oral and maxillofacial radiology, there is increasing focus on segmentation in analyses of areas such as the mandibular canal,16 mental foramen,17 and teeth18 on conventional radiographs, as well as the teeth and pulp on cone-beam CT images.19 Although the knee joint meniscus and cartilage have been successfully segmented by means of DL12,13 TMJ disc segmentation is challenging because of its complicated configuration and small structures compared with other joints. In addition to direct use for providing segmentation results, the model created in the present study may effectively be used for educational purposes to the beginners. If the traced results by beginners and the ground truth could be simultaneously presented with the IoU values, it would become a useful training tool for improving their diagnostic performance.
In this study, all recalls (sensitivity) were lower when using test images from Hospital B than when using test images from Hospital A. Our segmentation model was created using data from Hospital A alone; separate testing processes were performed using data from Hospital A and data from Hospital B. Therefore, our results may be reasonable because external validity assessment generally results in lower performance, compared with internal validity assessment. This is presumably attributable to differences in characteristics between data domains, which may be regarded as a domain shift phenomenon.20 In the present study, the proportion of condylar position anterior to the articular eminence was higher in test images from Hospital B than in training and validation images from Hospital A. Moreover, differences in magnetic field strength and MR sequences between the two hospitals might have been a critical distinguishing factor. Although these might contribute to the difference, the recalls were >80%, regardless of the disc and condylar positions or data origin, suggesting that this technique may be suitable for clinical application. Based on our previous analysis of condylar fracture identification on panoramic radiographs,21 the external validity analysis provided area under the receiver operating characteristic curve values of <0.6, while corresponding internal validity values were >0.85. In contrast to our expectation, the external validities in the present study were sufficiently high. Although the results may be limited to the conditions in the present study, the difference in magnetic field strength and MR sequences between hospitals may have been offset by the inclusion of various sequence images in the training and validation datasets; in particular, the disc could be visualized as a low intensity area in all MR sequences used in the present study. The results imply that the model learns shape characteristics, as well as image density features.
The precisions (positive predictive value) were low when using data from Hospital A, compared with precisions obtained using data from Hospital B, because more false-positive results were recorded when using data from Hospital A. Many false-positive areas were found in articular eminence cortices among images from Hospital A. The exact cause is unclear, but the proton density images and their method of digitization might have influenced this result.
Considering the likely use of this segmentation system in guiding treatment protocols for TMD, the classification should adhere to the criteria for the most common intra-articular TMD.1 Therefore, in the present study, accurately assigned TMJ images were defined as those with true-positive results in both closed and open mouth positions. Although the performances were adequate, the proportion of accurately assigned TMJs was low (66.7%) during the classification of anterior disc displacement without reduction without limited opening when using data from Hospital B (Figure 5). This was presumably attributable to the small proportions of such TMJs in the training and validation images. Anyhow, these results could show a possibility of clinical application, especially for the use in a hospital where their own data were included for creating the model.
This study had some limitations that should be addressed to obtain better performances in future studies. First, there were deviations in the distributions of data in the open mouth position, as well as in the condylar position and intra-articular TMD classifications, because the patients’ images were included in the present study based on the disc location in the closed mouth position. This should be resolved by including more training images in the open mouth position with, as well as in the condylar position and intra-articular TMD classifications. The increase of training data with anterior disc displacement would lead to reduction of false-positive results. Second, the data from Hospital A were digitized using a photographic camera. The high-level performance in the present study might have offset this limitation. However, the use of direct digital MR images may improve model performance in future studies. Third, as mentioned above, the MR sequences differed between Hospitals A and B. Although the effect of this difference is unclear if various sequences are used in the learning process, we hope to minimize its influence where possible. In this regard, data normalization technique, such as histogram matching between the data from two hospitals, would be effective when it would be applied before the training processes. Fourth, only two institutions were included and the generalizability of the models were not taken into account. This should be solved by a multi-institutional study with transfer and federated learning methodologies.20,21 In such process, a procedure which can reduce a vast effort of annotation task may be required. Finally, this study only considered anterior disc displacement. Future studies should also investigate lateral displacement and disc perforation.
In conclusion, the DL segmentation technique was used for disc identification on MR images, yielding high performances. The segmentation DL model created in the present study may aid in identifying disc positions on MR images.
Footnotes
Acknowledgements: We thank Ryan Chastain-Gross, Ph.D., from Edanz Group (https://en-author-services.edanz.com/ac) for editing a draft of this manuscript.
Contributors: Michihito Nozawa and Hirokazu Ito contributed equally to this work.
Contributor Information
Michihito Nozawa, Email: illehan@dpc.agu.ac.jp.
Hirokazu Ito, Email: ito-hirokazu@tsurumi-u.ac.jp.
Yoshiko Ariji, Email: yoshiko@dpc.agu.ac.jp.
Motoki Fukuda, Email: halpop@dpc.agu.ac.jp.
Chinami Igarashi, Email: igarashi-c@tsurumi-u.ac.jp.
Masako Nishiyama, Email: ag173d16@dpc.agu.ac.jp.
Nobumi Ogi, Email: ogi@dpc.agu.ac.jp.
Akitoshi Katsumata, Email: kawamata@dent.asahi-u.ac.jp.
Kaoru Kobayashi, Email: kobayashi-k@tsurumi-u.ac.jp.
Eiichiro Ariji, Email: ariji@dpc.agu.ac.jp.
REFERENCES
- 1.Schiffman E, Ohrbach R, Truelove E, Look J, Anderson G, Goulet J-P, et al. Diagnostic criteria for temporomandibular disorders (DC/TMD) for clinical and research applications: recommendations of the International RDC/TMD Consortium Network* and orofacial pain special interest Group†. J Oral Facial Pain Headache 2014; 28: 6–27. doi: 10.11607/jop.1151 [DOI] [PMC free article] [PubMed] [Google Scholar]
- 2.Fukuda M, Inamoto K, Shibata N, Ariji Y, Yanashita Y, Kutsuna S, et al. Evaluation of an artificial intelligence system for detecting vertical root fracture on panoramic radiography. Oral Radiol 2020; 36: 337–43. doi: 10.1007/s11282-019-00409-x [DOI] [PubMed] [Google Scholar]
- 3.Watanabe H, Ariji Y, Fukuda M, Kuwada C, Kise Y, Nozawa M, et al. Deep learning object detection of maxillary cyst-like lesions on panoramic radiographs: preliminary study. Oral Radiol 2021; 37: 487–93. doi: 10.1007/s11282-020-00485-4 [DOI] [PubMed] [Google Scholar]
- 4.Jeon S-J, Yun J-P, Yeom H-G, Shin W-S, Lee J-H, Jeong S-H, et al. Deep-learning for predicting C-shaped canals in mandibular second molars on panoramic radiographs. Dentomaxillofac Radiol 2021; 50: 20200513. doi: 10.1259/dmfr.20200513 [DOI] [PMC free article] [PubMed] [Google Scholar]
- 5.Kwon O, Yong T-H, Kang S-R, Kim J-E, Huh K-H, Heo M-S, et al. Automatic diagnosis for cysts and tumors of both jaws on panoramic radiographs using a deep convolution neural network. Dentomaxillofac Radiol 2020; 49: 820200185. doi: 10.1259/dmfr.20200185 [DOI] [PMC free article] [PubMed] [Google Scholar]
- 6.Ariji Y, Fukuda M, Kise Y, Nozawa M, Yanashita Y, Fujita H, et al. Contrast-Enhanced computed tomography image assessment of cervical lymph node metastasis in patients with oral cancer by using a deep learning system of artificial intelligence. Oral Surg Oral Med Oral Pathol Oral Radiol 2019; 127: 458–63. doi: 10.1016/j.oooo.2018.10.002 [DOI] [PubMed] [Google Scholar]
- 7.Ariji Y, Sugita Y, Nagao T, Nakayama A, Fukuda M, Kise Y, et al. Ct evaluation of extranodal extension of cervical lymph node metastases in patients with oral squamous cell carcinoma using deep learning classification. Oral Radiol 2020; 36: 148–55. doi: 10.1007/s11282-019-00391-4 [DOI] [PubMed] [Google Scholar]
- 8.Bispo MS, Pierre Júnior MLGdeQ, Apolinário AL, Dos Santos JN, Junior BC, Neves FS, et al. Computer tomographic differential diagnosis of ameloblastoma and odontogenic keratocyst: classification using a convolutional neural network. Dentomaxillofac Radiol 2021; 50: 20210002. doi: 10.1259/dmfr.20210002 [DOI] [PMC free article] [PubMed] [Google Scholar]
- 9.Kise Y, Shimizu M, Ikeda H, Fujii T, Kuwada C, Nishiyama M, et al. Usefulness of a deep learning system for diagnosing Sjögren's syndrome using ultrasonography images. Dentomaxillofac Radiol 2020; 49: 20190348. doi: 10.1259/dmfr.20190348 [DOI] [PMC free article] [PubMed] [Google Scholar]
- 10.Ariji Y, Fukuda M, Kise Y, Nozawa M, Nagao T, Nakayama A, et al. A preliminary application of intraoral Doppler ultrasound images to deep learning techniques for predicting late cervical lymph node metastasis in early tongue cancers. Oral Science International 2020; 17: 59–66. doi: 10.1002/osi2.1039 [DOI] [Google Scholar]
- 11.Duan W, Chen Y, Zhang Q, Lin X, Yang X. Refined tooth and pulp segmentation using U-Net in CBCT image. Dentomaxillofac Radiol 2021; 49: 20200251. doi: 10.1259/dmfr.20200251 [DOI] [PMC free article] [PubMed] [Google Scholar]
- 12.Zhou Z, Zhao G, Kijowski R, Liu F. Deep convolutional neural network for segmentation of knee joint anatomy. Magn Reson Med 2018; 80: 2759–70. doi: 10.1002/mrm.27229 [DOI] [PMC free article] [PubMed] [Google Scholar]
- 13.Norman B, Pedoia V, Majumdar S. Use of 2D U-Net convolutional neural networks for automated cartilage and meniscus segmentation of knee MR imaging data to determine relaxometry and morphometry. Radiology 2018; 288: 177–85. doi: 10.1148/radiol.2018172322 [DOI] [PMC free article] [PubMed] [Google Scholar]
- 14.Al-Saleh MAQ, Alsufyani N, Lai H, Lagravere M, Jaremko JL, Major PW. Usefulness of MRI-CBCT image registration in the evaluation of temporomandibular joint internal derangement by novice examiners. Oral Surg Oral Med Oral Pathol Oral Radiol 2017; 123: 249–56. doi: 10.1016/j.oooo.2016.10.016 [DOI] [PubMed] [Google Scholar]
- 15.Ronneberger O, Fischer P, Brox T. Dental X-ray segmentation using a U-shaped deep learning convolutional network. International Symposium on Biomedical Imaging 2015; 1: 3. [Google Scholar]
- 16.Kwak GH, Kwak E-J, Song JM, Park HR, Jung Y-H, Cho B-H, et al. Automatic mandibular canal detection using a deep convolutional neural network. Sci Rep 2020; 10: 5711. doi: 10.1038/s41598-020-62586-8 [DOI] [PMC free article] [PubMed] [Google Scholar]
- 17.Lee J-H, Han S-S, Kim YH, Lee C, Kim I. Application of a fully deep convolutional neural network to the automation of tooth segmentation on panoramic radiographs. Oral Surg Oral Med Oral Pathol Oral Radiol 2020; 129: 635–42. doi: 10.1016/j.oooo.2019.11.007 [DOI] [PubMed] [Google Scholar]
- 18.Duan W, Chen Y, Zhang Q, Lin X, Yang X. Refined tooth and pulp segmentation using U-Net in CBCT image. Dentomaxillofac Radiol 2021; 49: 20200251. doi: 10.1259/dmfr.20200251 [DOI] [PMC free article] [PubMed] [Google Scholar]
- 19.Kats L, Vered M, Blumer S, Kats E. Neural network detection and segmentation of mental foramen in panoramic imaging. J Clin Pediatr Dent 2020; 44: 168–73. doi: 10.17796/1053-4625-44.3.6 [DOI] [PubMed] [Google Scholar]
- 20.Willemink MJ, Koszek WA, Hardell C, Wu J, Fleischmann D, Harvey H, et al. Preparing medical imaging data for machine learning. Radiology 2020; 295: 4–15. doi: 10.1148/radiol.2020192224 [DOI] [PMC free article] [PubMed] [Google Scholar]
- 21.Nishiyama M, Ishibashi K, Ariji Y, Fukuda M, Nishiyama W, Umemura M, et al. Performance of deep learning models constructed using panoramic radiographs from two hospitals to diagnose fractures of the mandibular condyle. Dentomaxillofac Radiol 2021; 50: 20200611. doi: 10.1259/dmfr.20200611 [DOI] [PMC free article] [PubMed] [Google Scholar]


