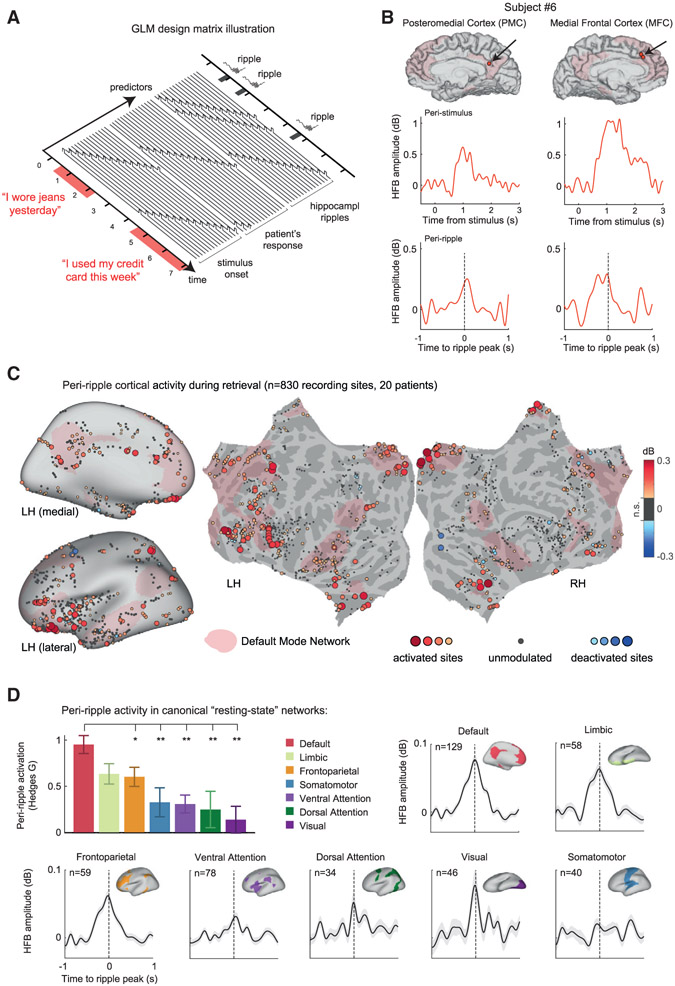
Figure 5. Peri-ripple cortical activations during autobiographical recall.
(A) A schematic illustration of the general linear model (GLM) design matrix used in the deconvolution of peri-ripple cortical responses. The observed HFB time series in each cortical site was modeled as a linear sum of overlapping responses triggered by stimulus-presentation, hippocampal ripple events, and the patient’s reaction. Each of these experimental events was entered into the model as a sequence of semi-overlapping cubic splines basis functions, which allowed the isolation of the peri-ripple activation while accounting for the activity induced by the other experimental events.
(B) Representative signal from two cortical sites in a single patient showing deconvolved stimulus-related (center row) and ripple-related HFB responses (bottom row). Hippocampal ripple time stamps taken from a single CA1 site in the same subject.
(C) Cortical electrodes (bipolar pairs) colored according to their deconvolved peri-ripple HFB response during the autobiographical trials. HFB amplitude was averaged over a time-window of −250 to 250 ms relative to the hippocampal ripple peak. Peri-ripple activations were broadly distributed, implicating prefrontal regions and large portions of the medial cortical surface overlapping the DMN (pink-colored regions). The threshold for electrode visualization was determined based on comparison to a null distribution of peri-ripple HFB responses, computed using a time-window of −1,500 to −500 ms relative to the ripple event. Recording sites in which the actual peri-ripple response failed to cross a threshold of p < 0.05 (uncorrected) were regarded as ripple-unmodulated sites and colored in gray.
(D) Peri-ripple activations across seven canonical resting-state networks, based on the Yeo et al. (2011) atlas. The bar plot shows that peri-ripple HFB amplitude in DMN electrodes, averaged over a time window of −250 to 250 ms relative to ripple peak, was significantly stronger compared to the other networks (*p < 0.05, **p < 0.01, rank-sum test, FDR adjusted; “limbic” sites were non-significantly different from DMN). In this analysis, we required that both electrodes in the bipolar pair be located within the affiliated resting-state network, thus achieving better anatomical specificity. Error bars represent SEM across recording sites.
See also Figures S5 and S6.

