

Abstract
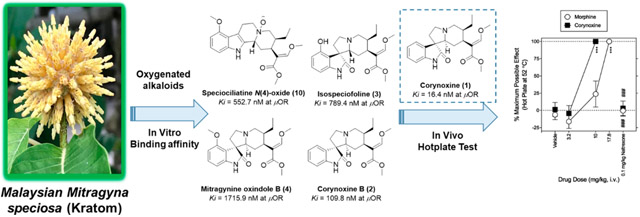
Ten indole and oxindole alkaloids (1–10) were isolated from the freshly collected leaves of Malaysian Mitragyna speciosa (Kratom). The chemical structures of these compounds were established on the basis of extensive 1D and 2D NMR and HRMS data analysis. The spectroscopic data of mitragynine oxindole B (4) are reported herein for the first time. The spatial configuration of mitragynine oxindole B (4) was confirmed by single-crystal X-ray diffraction. Simultaneous quantification of the isolated alkaloids in the M. speciosa leaf specimens collected from different locations in the northern region of Peninsular Malaysia was also performed using UPLC-MS/MS. The oxindole alkaloids (1–4) and the indole alkaloid (10) were assessed for binding affinity at opioid receptors. Corynoxine (1) showed high binding affinity to μ-opioid receptors with a Ki value of 16.4 nM. Further, corynoxine (1) was 1.8-fold more potent than morphine in rats subjected to a nociceptive hot plate assay. These findings have important implications for evaluating the combined effects of the minor oxindole alkaloids in the overall therapeutic activity of M. speciosa.
Graphical Abstract
Mitragyna speciosa Korth. (Rubiaceae), known also as kratom (English), krathum (Thai), or ketum and biak biak (Malay), is a psychoactive plant indigenous to Southeast Asia, particularly in southern Thailand and the northern states of Peninsular Malaysia. Currently, the plant is widely cultivated in Southeast Asian countries such as Indonesia, Malaysia, and Thailand.1 Indole and oxindole alkaloids are the primary components of M. speciosa. The corynanthe-type indole mitragynine (6) exists as the major alkaloid, constituting up to 66% of the total alkaloid content.2 Additional significant alkaloids are speciogynine (7) and paynantheine (8), which combined account for approximately 16% of the total alkaloid fraction.2
The concentrations of individual alkaloids in commercialized M. speciosa products appear to be largely defined by their origin and environmental factors, although most often their origin is unknown. Nonetheless, there is a widely distinct alkaloid profile between M. speciosa grown in the United States (U.S.) and that grown in Southeast Asia.3 In fact, M. speciosa samples cultivated in the south-central U.S. have a concentration of approximately 0.04% mitragynine (6) (dry sample), several fold lower than concentrations present in the Southeast Asian samples.2,3 This variance could be attributed to several factors, such as different chemotypes, climates, soil types, and environmental pressures. Recently, an alkaloid profile and simultaneous quantification of 10 different M. speciosa alkaloids were published, providing the first step toward standardization and quality control of marketed preparations and for analysis of wild and/or cultured plant material.4
Mitragynine (6) and its epimer speciociliatine (9) (2–4% of the total alkaloid content) together with a minor alkaloid, 7-hydroxymitragynine (11) (<2% of total alkaloid content), are currently known as the primary opioid-like components in M. speciosa.5,6 These alkaloids are partial agonists at the human μ-opioid receptor (MOR) with Ki values of 161.0, 54.5, and 7.2 nM, respectively.6 Efforts to reveal the roles of other minor M. speciosa alkaloids are ongoing.6,7
This report describes 10 alkaloids (1–10) (Figure 1) isolated from the leaves of Malaysian M. speciosa and the alkaloid profile of leaf samples collected from different locations in the northern states of Peninsular Malaysia. Additionally, this study reports in vitro μ-opioid receptor binding affinity for the following low-abundance Malaysian M. speciosa oxindole alkaloids: corynoxine (1), corynoxine B (2), isospeciofoline (3), mitragynine oxindole B (4), and the oxygenated indole alkaloid speciociliatine N(4)-oxide (10). Corynoxine (1) was also compared to morphine in a rodent (rat) hot plate assay of antinociception.
Figure 1.

Alkaloids (1−10) isolated from the Malaysian samples of Mitragyna speciosa.
RESULTS AND DISCUSSION
Chromatographic purification of the enriched alkaloidal fraction from the methanol extract of the freshly collected Malaysian M. speciosa leaves yielded four known oxindole alkaloids, corynoxine (1),8 corynoxine B (2),8 isospeciofoline (3),9 and mitragynine oxindole B (4).10 Also obtained were the known indole alkaloids corynantheidine (5),4 mitragynine (6),4 speciogynine (7),4 paynantheine (8),4 speciociliatine (9),4 and speciociliatine N(4)-oxide (10). The chemical structures of mitragynine oxindole B (4) and speciociliatine N(4)-oxide (10) were confirmed by spectroscopic analysis, with that of mitragynine oxindole B (4) also examined by X-ray crystallography. The structures of the previously described indole alkaloids (5–9) were determined by comparison of their spectroscopic data (MS and 1H and 13C NMR) with previously reported values.
Compound 4 (mitragynine oxindole B) was isolated as colorless needle crystals and determined by HRESIMS to have a molecular formula of C23H30N2O5 (m/z 415.2227 [M + H]+, calcd for C23H31N2O5, 415.2155). This is consistent with 10 degrees of unsaturation. The 1H and 13C NMR data (Table 1) resembled those of corynanthe-type oxindole alkaloids.8,9,11 The 1H NMR spectrum (Table 1) indicated the presence of an AMX trisubstituted aromatic system at δH 7.06 (dd, J = 8.0, 8.0 Hz, H-11), 6.48 (d, J = 8.0 Hz, H-10), and 6.42 (d, J = 8.0 Hz, H-12). The spectrum also showed a methoxy substituent attached to an aromatic ring at δH 3.78 (s, OCH3-9), an ethyl group at δH 1.73 and 1.10 (m, H2-19) and 0.80 (t, J = 7.38 Hz, CH3-18), and an indolic NH proton at δH 7.79 (s, N(1)-H). Additionally, signals at δH 7.24 (s, H-17), 3.57 (s, OCH3-17), and 3.56 (s, OCH3-22) suggested the presence of a β-methoxy acrylate moiety. The 13C NMR spectrum (Table 1) confirmed 4 to have 23 carbon atoms, including a carbonyl (δC 180.5), an ester carbonyl (δC 168.2), three aromatic carbons (δC 128.0, 104.3, and 101.6), three aromatic quaternary carbons (δC 154.6, 141.1, and 117.5), three methines (δC 69.9, 39.5, and 39.2), five methylenes (δC 53.9, 53.4, 30.0, 24.2, and 18.1), and one quaternary carbon (δC 55.3). Two-dimensional (2D) NMR experiments, namely, homonuclear 1H–1H COSY and heteronuclear 1H–13C HSQC and HMBC, helped assign the 1H and 13C NMR data (Figure 2). The location of the β-methoxy acrylate moiety was confirmed by the long-range HMBC correlations observed for H-15 with C-16 and C-17 (Figure 2A). The methoxy group position was determined by long-range 1H–13C HMBC correlation of the methoxy protons with C-9 in the aromatic ring. From these observations it was concluded that the planar structure is likely to be a tetracyclic oxindole, similar to corynoxine A/B but with an extra methoxy group in the aromatic ring at the C-9 position.
Table 1.
1H and 13C NMR Data of Mitragynine Oxindole B (4) and Speciociliatine N(4)-Oxide (10)
| compound 4a |
compound 10b |
|||
|---|---|---|---|---|
| position |
1H δH, mult. (J in Hz) |
13C δC, mult. |
1H δH, mult. (J in Hz) |
13C δC, mult. |
| 2 | 180.5, C | 127.2, C | ||
| 3 | 2.49, br d (10.8) | 69.9, CH | 5.09 br d (12.7) | 65.95, CH |
| 4 | ||||
| 5 | 3.16, br t (7.7) | 53.4, CH2 | 3.69–3.64, m | 65.93, CH2 |
| 2.42, m | 3.57, mc | |||
| 6 | 2.23, mc | 30.0, CH2 | 3.57, mc | 19.71, CH2 |
| 3.18, m | ||||
| 7 | 55.3, C | 105.0, C | ||
| 8 | 117.5, C | 116.7, C | ||
| 9 | 154.6, C | 154.3, C | ||
| 10 | 6.48, d (8.0) | 104.3, CH | 6.46, d (8.1) | 98.8, CH |
| 11 | 7.06, dd (8.0, 8.0) | F128.0, CH | 6.96, dd (8.1) | 121.7, CH |
| 12 | 6.42, d (8.0) | 101.6, CH | 6.90, d (8.1) | 104.3, CH |
| 13 | 141.1, C | 138.1, C | ||
| 14 | 2.23, mc | 24.2, CH2 | α, 2.66, ddd (14.5, 12.8, 6.5) | 28.6, CH2 |
| 0.98, br d (12.6) | β, 2.17, dt (14.4, 2.1) | |||
| 15 | 2.59, dt (13.0; 3.0) | 39.2, CH | 3.56, mc | 29.9, CH |
| 16 | 110.6, C | 110.6, C | ||
| 17 | 7.24, s | 159.4, CH | 7.67, s | 161.1, CH |
| 18 | 0.80, t (7.4) | 12.4, CH3 | 0.94, t (7.8) | 10.8, CH3 |
| 19 | 1.73, m | 18.1, CH2 | 1.28, m | 22.9, CH2 |
| 1.1, m | ||||
| 20 | 1.41, br d (10.8) | 39.5, CH | 2.79, ddd (12.4, 7.3, 5.0) | 33.6, CH |
| 21 | 3.20, br d (9.2) | 53.9, CH2 | β, 4.10 br t (12.0) | 69.0, CH2 |
| 2.04, br d (9.2) | α, 3.18, m | |||
| 22 | 168.2, C | 169.8, C | ||
| NH | 7.79, s | |||
| OMe-9 | 3.78, s | 60.6, CH3 | 3.88, s | 54.1, CH3 |
| OMe-17 | 3.57, s | 54.2, CH3 | 3.93, s | 60.9, CH3 |
| OMe-22 | 3.56, s | 50.2, CH3 | 3.75, s | 50.7, CH3 |
CDCl3.
CD3OD.
Overlapped.
Figure 2.
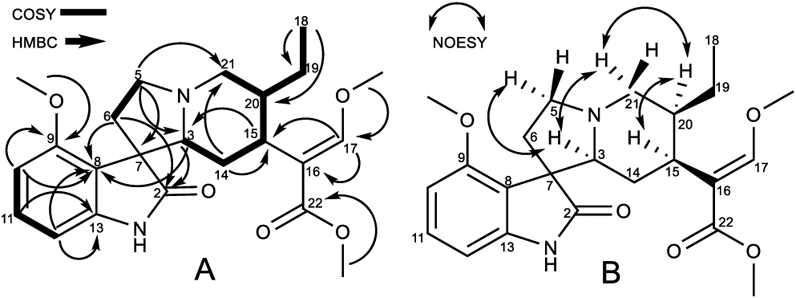
(A) COSY and HMBC correlations and (B) selected NOESY correlations of mitragynine oxindole B (4).
The relative configuration of 4 was deduced from a NOESY experiment (Figure 2B), which indicated correlations of H-20 (δH 1.41) and H-15 (δH 2.59), clearly showing that these protons are in the same plane, while H-3 (δH 2.49) correlated with the H-21α (δH 3.20) and H-5α (δH 3.16) protons. The H-21α proton showed correlation with H-20, suggesting that the protons of the three aliphatic methines at position C-3, C-15, and C-20 are on the same face (3S, 15S, and 20S). This postulated structure was further validated by a single-crystal X-ray diffraction analysis (Figure 3), which also indicated an R configuration at the spiro-carbon, C-7. Prior to this isolation from M. speciosa leaves, compound 4 had previously been synthesized by oxidative conversion of mitragynine and assigned the name “mitragynine oxindole B”.10 We identified only one other report of the natural occurrence of a mitragynine oxindole, in a Thai M. speciosa specimen, which used TLC to identify mitragynine oxindoles A and B.11 However, in neither of these previous studies had spectroscopic data been used to confirm the structure. The current report is the first to fully characterize mitragynine oxindole B (4), isolated from an authentic Malaysian M. speciosa specimen.
Figure 3.

Projection of mitragynine oxindole B (4), with the displacement ellipsoids drawn at the 50% probability level.
Speciociliatine N(4)-oxide (10) was obtained as a white, amorphous solid, and the molecular formula was confirmed by the analysis of the positive-ion HRESIMS (m/z 415.2591, calcd for C23H31N2O5, 415.2233). Compound 10 has the same molecular formula as 4 and similar NMR spectra (Table 1). Both compounds exhibit a trisubstituted aromatic AMX system at δH 6.96 (dd, J = 8.1, 8.1 Hz, H-11), 6.90 (d, J = 8.0 Hz, H-10), and 6.46 (d, J = 8.0 Hz, H-12), a methoxy substituent attached to an aromatic ring at δH 3.88 (s, OCH3-9), an ethyl group at δH 1.23 (m, H2-19) and 0.94 (t, J = 7.8 Hz, CH3-18), and signals for the β-methoxy acrylate moiety at δH 7.67 (s, H-17), 3.93 (s, OCH3-17), and 3.75 (s, OCH3-22). However, compound 10 lacks a lactam carbonyl and a quaternary spiro-carbon, which suggests it has an indole alkaloid skeleton.12,13 The differences in the NMR spectra between 10 (Table 1) and more typical mitragynine-type alkaloids are the aliphatic proton resonances in rings C and D were shifted to lower field, e.g., H-3 at δH 5.09 (br d, J = 12.7 Hz), H-21β at δH 4.10 (br d, J = 12.0 Hz), H-21α at δH 3.18 (m), H-4β at δH 3.67 (m), and H-4α at δH 3.57 (m). These shifts are consistent with the presence of an N-oxide moiety.12 Homonuclear 1H–1H COSY and heteronuclear 1H–13C HSQC and HMBC experiments indicated a structure similar to a mitragynine (6)- or speciociliatine (9)-type indole alkaloid with an N-oxide functionality at N(4).12,14 A 2D NOESY experiment failed to establish the configuration of the methine protons at H-3, H-15, and H-20, although 1D selective NOE studies confirmed the proton configurations. Irradiation of H-20 at δH 2.79 correlated with the signals at δH2.66 (ddd, H-14α) and 3.18 (occurring as a double of doublets (dd) only in the 1D NOE experiment, H-21α). Moreover, the δH 3.56 (H-15) signal showed a broad triplet (br t) but only in the 1D NOE experiment, suggesting that H-20 and H-15 are on the same face of the molecule. Irradiation of the signal assigned for H-3 at δH 5.09 (d) showed a clear correlation of the signals at δH 2.17 (d, H-14β) and 4.10 (br t, H-21β), being on the opposite face of the molecule in comparison with H-15 (Figure 4). Additional irradiation of the isolated signals confirmed the structure as speciociliatine N(4)-oxide (10). The same low shift for H-3 has also been reported for the β configuration of isopaynantheine N(4)-oxide, a major secondary metabolite found in Mitragyna diversifolia.12
Figure 4.
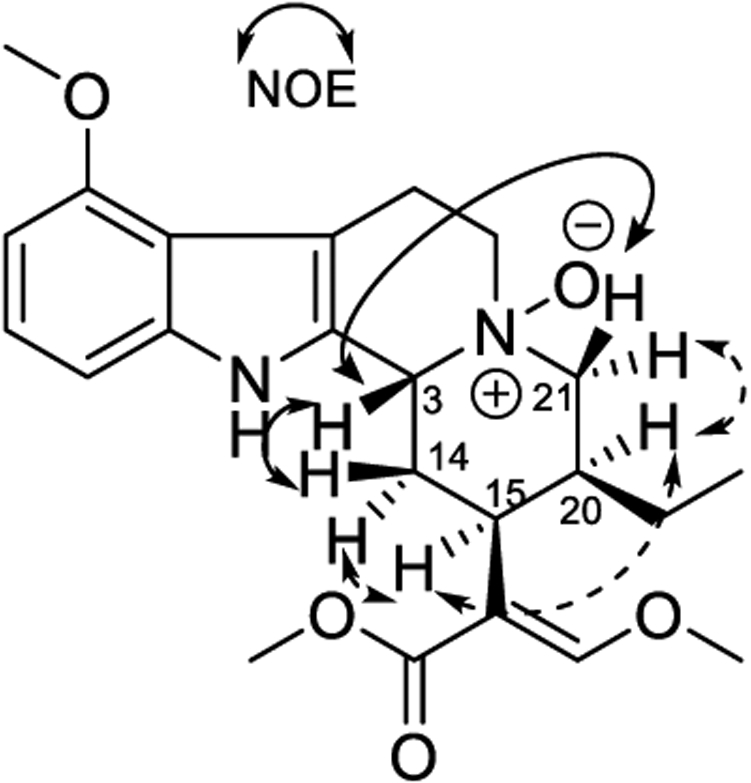
Selective NOE correlations observed for speciociliatine N(4)-oxide (10).
Owing to the high polarity of speciociliatine N(4)-oxide (10), the Rf values on normal silica gel TLC were much lower than those of speciociliatine (9) in various solvent systems, giving indirect evidence for the N-oxide assignment. Speciociliatine and mitragynine N-oxides were first described as oxidative products formed in a harsh acid medium.10 However, Takayama et al. also derived mitragynine N-oxide from mitragynine using m-chloroperbenzoic acid.14 During the preparation of this article, speciociliatine N(4)-oxide (10) was identified by Flores-Bocanegra et al. in a commercial M. speciosa product.15
The reported alkaloidal concentrations in M. speciosa leaf samples collected in Malaysia and Thailand are significantly different from each other,16 and specimens grown in the United States are even more distinctive.3,16 The precise reasons for these distinctions are unclear, but potentially include the influence of growing conditions such as seasonal variance and photoperiod lengths, age of the plant at harvest, and sample handling (e.g., whether the leaves are fresh or dried). Postharvest environmental factors, such as storage, transportation, humidity, and contaminating microorganisms, may also significantly affect the alkaloid content of the leaf material. This suggests the opportunity to use authentic M. speciosa leaves from known origins to develop chemical fingerprints that can define biomass.
The specimens used in the current study were collected from different locations in Kedah and Penang, Malaysia (Table S1 and Figure S1, Supporting Information). Interestingly, while mitragynine (6) was the most abundant alkaloid in T1, −2, and −5–16, two samples (T3, T4) did not contain quantifiable levels of mitragynine (6), similar to plants reported that were grown in the south-central U.S.3 Trees T1–T5 were of similar age and located in the same Penang plantation, and the leaves were collected on the same day. Interestingly, mitragynine (6) was below the lower limit of quantification in T3 and T4, and speciogynine (7), and paynantheine (8) concentrations were also low, but speciociliatine (9) was in a higher concentration than in any of the other samples (Table 2). This variance in T3 and T4 suggests that M. speciosa exhibits chemotypes, which could also explain the alkaloidal profile found in M. speciosa growing in the U.S.3 and the recent report from Oberlies’ group that outlined clear differences in the alkaloidal composition on marketed M. speciosa specimens in the U.S.15 This difference in alkaloidal profiles demonstrates that the historical literature should not be taken as universal. It is worth noting that plants with multiple chemotypes are not unusual. Indeed Cannabis sativa is a prime example; certain chemotypes produce high levels of Δ9-trans-tetrahydrocannabinol (THC), while hemp varietals produce little to no measurable amounts of THC.17
Table 2.
Alkaloid Content in Freshly Collected M. speciosa Leaf Specimens from Malaysia
| mg compound/1000 mg dried leaves |
||||||||||||||||
|---|---|---|---|---|---|---|---|---|---|---|---|---|---|---|---|---|
| state | place | code | 1a | 2a | 3a | 4a | 5a | 6a | 7a | 8a | 9a | 10a | 11b | 12b | 13b | 14b |
| Penang | Kubang Semang | T1 | 0.37 | 0.12 | 0.10 | 0.08 | 10.89 | 1.12 | 1.17 | 3.51 | 0.05 | 0.07 | ||||
| T2 | 0.27 | 0.10 | 0.03 | 0.18 | 0.24 | 12.12 | 1.05 | 1.07 | 6.38 | 0.02 | 0.06 | 0.17 | ||||
| T3 | 0.46 | 0.15 | 0.11 | 0.08 | 13.49 | 0.06 | 0.09 | |||||||||
| T4 | 0.28 | 0.09 | 0.08 | 0.12 | 0.01 | 14.76 | 0.06 | 0.10 | ||||||||
| T5 | 0.16 | 0.09 | 18.85 | 1.23 | 0.93 | 2.04 | 0.15 | 0.10 | ||||||||
| Penang | Bukit Mertajam (Pak Teh Plantation) | T6 | 0.03 | 0.14 | 0.03 | 9.38 | 0.99 | 1.01 | 1.65 | 0.08 | 0.07 | |||||
| Bukit Mertajam (Mat Plantation) | T7 | 0.13 | 0.05 | 0.19 | 0.05 | 13.00 | 1.53 | 1.47 | 1.81 | 0.11 | 0.07 | |||||
| Bukit Mertajam (Zalem Plantation) | T8 | 0.10 | 0.05 | 0.05 | 0.03 | 12.22 | 1.74 | 1.63 | 0.43 | 0.06 | 0.04 | |||||
| Bukit Mertajam (Permatang Pauh Red Vein) | T9 | 0.05 | 0.22 | 18.45 | 1.95 | 1.90 | 1.64 | 0.04 | 0.05 | |||||||
| (Permatang Pauh Super Red Vein) | T10 | 0.25 | 0.12 | 0.07 | 0.03 | 9.73 | 1.25 | 1.40 | 1.12 | 0.03 | 0.05 | |||||
| Kedah | Kulim (Halim Plantation) | T11 | 0.15 | 0.06 | 0.09 | 0.03 | 17.29 | 1.99 | 1.78 | 1.00 | 0.06 | 0.05 | ||||
| Baling | T12 | 0.18 | 0.06 | 15.68 | 1.33 | 1.09 | 1.25 | 0.11 | 0.05 | |||||||
| T13 | 0.16 | 0.13 | 11.02 | 0.97 | 0.88 | 1.94 | 0.12 | 0.03 | ||||||||
| T14 | 0.14 | 0.42 | 12.42 | 1.23 | 1.09 | 1.39 | 0.09 | 0.12 | ||||||||
| T15 | 0.07 | 0.21 | 0.16 | 16.52 | 1.55 | 1.18 | 0.97 | 0.15 | 0.04 | |||||||
| T16 | 0.16 | 0.06 | 0.17 | 0.23 | 13.28 | 1.12 | 1.12 | 2.22 | 0.11 | 0.07 | ||||||
Isolated alkaloids from M. speciosa: 1, corynoxine; 2, corynoxine B; 3, isospeciofoline; 4, mitragynine oxindole B; 5, corynantheidine; 6, mitragynine; 7, speciogynine; 8, paynantheine; 9, speciociliatine; 10, speciociliatine N(4)-oxide.
Other alkaloid standards: 11, 7-hydroxymitragynine; 12, isocorynantheidine; 13, ajmalicine; 14, mitraphylline. Non value = below lower limit of quantification (LLOQ) (<0.1%)
Mitragynine oxindole B (4) was present in all the specimens examined in the current study, but in highly variable concentrations (0.05–0.21 mg/g; Table 2). Similarly, the other oxindoles examined, corynoxine (1) (0–0.42 mg/g) and its epimer, corynoxine B (2) (0 to 0.17 mg/g), were inconsistent in their representation with previously investigated specimens. In Uncaria species, the oxindole content is known to be affected by environment and seasonal factors such as total precipitation and plant water content.18,19 It is therefore possible that oxindole alkaloid biosynthesis from their indole precursors requires certain levels of water and oxygen. A short discussion about the biosynthesis of the kratom alkaloids (Figure S2) is provided in the Supporting Information.
7-Hydroxymitragynine (11) was present in small amounts in all samples (0.03–0.15 mg/g) except for T3 and T4, which supports recent reports suggesting 7-hydroxymitragynine could be a postharvest artifact of mitragynine.5 Two pentacyclic alkaloids, mitraphylline (13) and ajmalicine (14) (Figure S2, Supporting Information), have previously been reported in M. speciosa,2 but were below the lower limit of quantification in all M. speciosa samples in the present study (Table 2).
Oxindoles (1–4) and the N-oxide (10) were screened at concentrations of 0.1 and 10 μM for their capacity to displace tritiated opioid agonists from cultured cells expressing recombinant human δ-, κ-, and μ-opioid receptors (Table 3). In addition, each compound’s binding displacement constant (Ki) for μ-opioid receptors was accessed over a more complete concentration range (Table 4). At 10 μM, all compounds except isospeciofoline (3) displaced >50% [3H]DADLE at δ-opioid receptors (53.5–87.1%), and all except isospeciofoline (3) and mitragynine oxindole B (4) displaced >50% [3H]U69,593 (51.8–80.9%) from κ-opioid receptors (Table 3). At human μ-opioid receptors (hMOR), corynoxine (1) exhibited the highest affinity with a Ki value of 16.4 ± 1.4 (mean ± SEM) nM. Interestingly, corynoxine B (2), which differs only in its configuration at C-7, demonstrated about 6 times less affinity (Ki = 109.8 ± 8.1 nM; Table 5). The O-methyl group at C-9 in mitragynine oxindole B (4) also greatly reduced human μ-opioid receptor affinity (1715.9 ± 912.0 nM), and was 16-fold lower than corynoxine B (2) (Table 4). In a recent study to evaluate the μ-opioid affinity for some selected M. speciosa alkaloids, corynoxine B (2) was found to have an affinity approximately 15-fold lower than that found in the present study.7 Since corynoxine (1) had the highest affinity for human μ-opioid receptors (Table 4), its in vivo activity was compared with that of morphine in a rat hot plate antinociception assay. Both compounds were administered via the intravenous (i.v.) route in order to minimize differences in bioavailability and time to maximum effect. Morphine dose-dependently increased antinociception, with an ED50 value (95% confidence interval) of 12.1 (10.2–14.4) mg/kg, while the ED50 value of corynoxine (1) was 6.75 (5.90–7.62) mg/kg (Figure 5, Table 5). Both morphine and corynoxine (1) antinociception was fully reversed by 0.1 mg/kg (i.v.) naltrexone (opioid receptor antagonist). These data demonstrate that corynoxine (1) is as antinociceptive as morphine in the hot plate assay, despite having slightly less affinity in the in vitro studies (Table 4). It is unclear whether this reflects a difference in the affinity of corynoxine for rat vs human opioid receptors or a difference in the efficacy of morphine and corynoxine (1) to produce antinociception in rats.
Table 3.
Percent Displacement of Radioligands by Selected M. speciosa Alkaloids at Opioid Receptor Subtypes in a Screening Profilea
| M. speciosa alkaloid concentration | δ-opioid | κ-opioid | μ-opioid |
|---|---|---|---|
| corynoxine (1) | |||
| 100 nM | −3.9 | 3.8 | 80.1 |
| 10 000 nM | 73.8 | 75.3 | 97.8 |
| corynoxine B (2) | |||
| 100 nM | −4.4 | 4.5 | 45.4 |
| 10 000 nM | 65.5 | 51.8 | 94.4 |
| isospeciofoline (3) | |||
| 100 nM | 0.0 | 0.1 | 13.1 |
| 10 000 nM | 27.1 | 37.3 | 83.3 |
| mitragynine oxindole B (4) | |||
| 100 nM | 10.4 | 5.0 | 7.3 |
| 10 000 nM | 87.1 | 23.0 | 66.5 |
| speciociliatine N(4)-oxide (10) | |||
| 100 nM | 5.1 | 6.6 | 10.5 |
| 10 000 nM | 53.5 | 80.9 | 84.6 |
For subtype δ, human recombinant Chem-1 (RBL) cells. [3H]DADLE at 0.5 nM was used as a ligand. Naltrexone (10 μM) was used as a nonspecific binder, with 60 min incubation. For subtype κ, human recombinant RBL cells. [3H]U69,593 at 0.5 nM was used as a ligand. Naloxone (10 μM) was used as a nonspecific binder, with 60 min incubation. For subtype μ, human recombinant HEK-293 cells. [3H]DAMGO at 0.5 nM was used as a ligand. Naloxone (10 μM) was used as a nonspecific binder, with 120 min incubation. All assays were performed at room temperature.
Bold font in body of the table represents >50% displacement.
Table 4.
Ki Values of Alkaloids 1–10 at the Human μ-Opioid Receptor
| alkaloid |
μ-opioid, Ki ± SEM (nM) |
average abundance in malaysian samples (% w/w) (except T3 and T4) |
|---|---|---|
| corynoxine (1) | 16.4 ± 1.4 | 0.18 |
| corynoxine B (2) | 109.8 ± 8.1 | 0.06 |
| Isospeciofoline (3) | 789.4 ± 293.8 | 0.03 |
| mitragynine oxindole B (4) | 1715.9 ± 12.0 | 0.13 |
| corynantheidine (5)6 | 1910 ± 50.0 | 0.22 |
| mitragynine (6)6 | 161 ± 10.0 | 14.11 |
| speciogynine (7)28 | 728 ± 61.0 | 1.48 |
| paynantheine (8)28 | 410 ± 15.2 | 1.39 |
| speciociliatine (9)6 | 54.5 ± 4.4 | 3.4 |
| speciociliatine N(4)-oxide (10) | 552.7 ± 22.5 | 0.01 |
| DAMGO | 0.403 ± 0.008 | |
| morphine | 4.19 (2.03–11.1)a |
95% confidence limit.
Table 5.
Statistical Analyses of Dose–Effect Functions for the Antinociceptive Effects of Test Compounds (i.v.) as Shown in Figure 5a
| drug | sex | dose (mg/kg, i.v.) | interaction | post hoc test |
|---|---|---|---|---|
| morphine + 0.1 mg/kg naltrexone | F1,16 = 0.0129; p = 0.915 | F4,16 = 14.3; p < 0.001 | F4,16 = 0.205; p = 0.932 | 17.8 mg/kg vs vehicle (t = 6.05, p < 0.001), 17.8 mg/kg vs naltrexone (t = 5.72, p < 0.001) |
| corynoxine (1) + 0.1 mg/kg naltrexone | F1,20 = 1.73; p = 0.259 | F5,20 = 54.3; p < 0.001 | F5,20 = 0.882; p = 0.478 | 17.8 mg/kg vs vehicle (t = 10.2, p < 0.001), 17.8 mg/kg vs naltrexone (t = 10.2, p < 0.001) |
The sample sizes are described in each figure legend. Comparisons were made using a two-way repeated-measures ANOVA followed by post hoc Bonferroni t tests with results shown when effects were statistically significant. Significant differences are in bold.
Figure 5.

Effects of i.v. injection of morphine and corynoxine (1) on hot plate latency in catheterized rats. Abscissae: Vehicle, cumulative drug dose in mg/kg (i.v., log scale), and 0.1 mg/kg naltrexone (i.v.). Ordinates: Percentage of maximum possible effect (MPE). The hot plate was maintained at 52 ± 0.1 °C. Each point represents the mean ± SEM (n = 6, three subjects per sex). Following vehicle, cumulative doses were administered, followed by naltrexone (0.1 mg/kg, i.v.) at 5 min intervals. The antinociceptive effects of morphine and corynoxine (1) were antagonized by naltrexone. ***p < 0.001 compared with vehicle. ###p < 0.001 compared with morphine (17.8 mg/kg) or corynoxine (1, 10 mg/kg). Details for statistical analyses are shown in Table 5.
This study has revealed that the oxindole alkaloids corynoxine (1) and corynoxine B (2) have high binding affinities toward μ-opioid receptors. Since these oxindoles are found in very low concentrations within M. speciosa leaves, they may not exert a significant pharmacological effect in the overall translation to human consumption of M. speciosa. However, these oxindole alkaloids are reported as major components in other medicinal plants of the Uncaria genus, including Uncaria rhynchophylla, U. macrophylla, and U. tomentosa, popularly known as Cat’s Claw or Guo Teng.20-22
In conclusion, 10 alkaloids were isolated from freshly collected Malaysian M. speciosa leaves including mitragynine oxindole B (4) and speciociliatine N(4)-oxide (10) and fully characterized. Additionally, a UPLC-MS method was described and demonstrated to simultaneously quantify 14 different M. speciosa alkaloids from 16 samples collected in Peninsular Malaysia. A high variability in the composition of the alkaloid fractions taken from different leaf specimens was observed, suggesting the existence of at least two different chemotypes, one with high content of mitragynine (6) and another with high concentrations of speciociliatine (9). This is also the first report to demonstrate that the oxindole alkaloid corynoxine (1) exhibits a high affinity for human μ-opioid receptors (16.4 ± 1.4 nM) and opioidergic efficacy in an antinociception assay comparable to that of morphine. This series of compounds may be valuable leads in the development of new analgesics.
EXPERIMENTAL SECTION
General Experimental Procedures.
1H and 13C NMR spectra were obtained using Bruker Avance NEO 600 NMR and Bruker Avance II 600 MHz NMR spectrometers operating at 600 MHz in 1H and 151 MHz in 13C (Bruker Co., Billerica, MA, USA). The chemical shift values were reported in parts per million units (ppm) from tetramethylsilane (TMS) using known solvent chemical shifts. Coupling constants were recorded in hertz (Hz). Standard pulse sequences were used for COSY, HMQC, HMBC, TOCSY, NOESY, and DEPT. HRMS and purity (≥98%) were determined using an Agilent 1290 Infinity series ultraperformance liquid chromatograph (UPLC) system equipped with a photodiode array detector and quadrupole-time-of-flight (QTOF) Agilent 6540 mass spectrometer (Agilent Co., Santa Clara, CA, USA). Column chromatography was carried out on silica gel (70–230 mesh, Merck) and Sephadex LH-20 (Mitsubishi Kagaku, Tokyo, Japan). TLC (silica gel 60 F254, Sorbtech, Norcross, GA, USA) was used to monitor obtained fractions from column chromatography. Preparative TLC was carried out on silica gel 60 PF254 + 366 plates (20 × 20 cm, 1 mm thick). Visualization of the TLC plates was achieved with a UV lamp (λ = 254 and 365 nm) and anisaldehyde/acid spray reagent (MeOH–acetic acid–anisaldehyde–sulfuric acid, 85:9:1:5). All solvents and reagents used for plant extraction and compound isolation were of analytical grade (Fisher Scientific, Fair Lawn, NJ, USA). Corynoxine (1), corynoxine B (2), isospeciofoline (3), mitragynine oxindole B (4), corynantheidine, (5), mitragynine (6), paynantheine (7), speciogynine (8), speciociliatine (9), and speciociliatine N(4)-oxide (10) (purity ≥98%) used for UPLC-MS analysis were extracted and purified from the leaves of M. speciosa following the procedures described below. 7-Hydroxymitragynine (11) (≥98%), used for UPLC-MS analysis, was synthesized according to the method described by Maxwell et al.23 Another three alkaloid standards, (≥98%) isocorynantheidine (12), ajmalicine (13), and mitraphylline (14), were obtained from an in-house alkaloid library. LC-grade MeOH, acetonitrile, acetic acid, ammonium acetate, and water were purchased from Fisher Scientific. Corynoxine (1) was converted to its hydrochloride salt for animal studies.
Plant Material.
Fresh leaves of M. speciosa were collected on Permatang Rawa, Seberang Perai Tengah (5°22′17″ N; 100°27′1″ E), Penang, Malaysia, for the extraction and purification of alkaloids. The plant was authenticated by a botanist, Dr. Rosazlina Binti Rusly, from the School of Biological Sciences, Universiti Sains Malaysia (USM), and a voucher specimen (NEL-(K)-2019(02)) was deposited at the herbarium of the School of Biological Sciences, USM. The additional 16 samples (T1–T16) were collected from several kratom plantations (Kubang Semang, Bukit Mertajam, Kulim, and Baling areas) in the states of Kedah and Penang, Malaysia. The exact location and dates of collection are summarized in Table S2 and Figure S1 (Supporting Information).
Extraction and Isolation.
M. speciosa leaves (500 g) were extracted with hot MeOH (5 L) in a circulating water bath (45 °C) for 12 h followed by maceration at room temperature for another 12 h. The same extraction procedure was repeated three times with fresh MeOH until the solution became colorless. After evaporation in vacuo, the crude extract was partitioned between hexane (3 × 4 L) and 10% CH3COOH (4 L). The water-soluble portion was then adjusted to pH 9.0 with 25% NH4OH and extracted with CHCl3 (3 × 4 L). The concentrated CHCl3-soluble portion was lyophilized to yield a crystalline alkaloid fraction (6.8 g). The alkaloid fraction was subjected to a passage over silica gel column chromatography (CC) (hexane–EtOAc–MeOH, 100:0:0 to 0:0:100, v/v) to give seven fractions (Fr. 1–Fr. 8). Fr. 2 (2.0 g) was purified by a silica gel CC (hexane–EtOAc, 80:20, v/v) to afford corynantheidine (5) (14 mg) and mitragynine (6) (1.72 g). Fr. 3 (0.35 g) was subjected to flash silica gel CC (hexane–EtOAc, 90:10 to 20:80, v/v) to afford paynantheine (8) (20 mg). Fr. 4 (0.42 g) was further separated by silica gel CC (hexane–EtOAc, 70:30 to 0:100, v/v) to yield three subfractions (SFr. 4a, 4b, and 4c). SFr. 4a was repeatedly purified by silica gel CC (hexane–EtOAc, 40:60, v/v) to yield compound corynoxine (1) (30 mg). SFr. 4b was further purified by a normal-phase preparative TLC (CHCl3–EtOAc, 85:15 v/v) to afford speciogynine (7) (22 mg). Fr. 5 (0.43 g) was separated by silica gel CC and eluted with CHCl3–EtOAcMeOH mixtures (10:0 to 0:10) to afford three subfractions (SFr. 5a, 5b, and 5c). SFr. 5a was recrystallized to yield corynoxine B (2) (23 mg), while SFr. 5b was purified using preparative TLC (CHCl3–MeOH, 95:5, v/v), to obtain isospeciofoline (3) (10 mg). SFr. 6 (0.82 g) was separated by silica gel CC (CHCl3–EtoAc, 10:1 to 5:5, v/v) to give two subfractions (SFr. 6a and 6b). SFr. 6a was recrystallized using a mixture of CHCl3–EtOAc (5:5, v/v) to give a white needle, mitragynine oxindole B (4) (20 mg). Speciociliatine (9) (48 mg) was obtained from SFr. 6b through silica gel CC (EtOAc–MeOH, 10:0 to 0:100, v/v). Speciociliatine N(4)-oxide (25 mg) (10) was obtained from the Fr. 7, as a white solid precipitate, which was cleaned by washing with a mixture of hexane–EtOAc (1:1) and filtered.
Mitragynine oxindole B (4).
Transparent crystals (EtOAc); mp 167–169 °C; UV (MeOH) λmax (log ε) 220 (3.9), 245 (3.2), 290 (1.2) nm; IR (film, NaCl) νmax 3236, 2948, 2791, 1728, 1707, 1615, 1466, 1450, 1251, 1152, 1098, 773 cm−1; 1H NMR and 13C NMR data, see Table 1; positive HRESIMS m/z 415.2227 [M + H]+ (calcd for C23H30N2O5, 415.2155).
X-ray Crystallography of Mitragynine Oxindole B (4).
Colorless crystals of compound 4 were obtained in ethyl acetate at room temperature. X-ray intensity data were collected at 100 K on a Bruker DUO diffractometer using Cu Kα radiation (λ = 1.541 78 Å), from an ImuS power source, and an APEXII CCD area detector. Raw data frames were read by the program SAINT24 and integrated using 3D profiling algorithms. The resulting data were reduced to produce hkl reflections and their intensities and estimated standard deviations. The data were corrected for Lorentz and polarization effects, and numerical absorption corrections were applied based on indexed and measured faces. The structure was solved and refined in SHELXTL-2014, using a full-matrix least-squares refinement.25 The non-H atoms were refined with anisotropic thermal parameters, and all of the H atoms were calculated in idealized positions and refined riding on their parent atoms. The correct stereochemistry of the molecule was refined evidenced by the following parameters: Flack x = 0.01(9), Parsons z = 0.06(9), Hooft y = 0.06(8). Additionally, the P2 and P3 for refining the true stereochemistry are 1.000, while the P3 (rac-twin) is 0.1 × 10⁻⁶ and P3 (false) is 0.1 × 10⁻³¹. In the final cycle of refinement, 3220 reflections (of which 3137 are observed with I > 2σ(I)) were used to refine 279 parameters, and the resulting R1, wR2, and S (goodness of fit) were 4.51%, 12.52%, and 1.031, respectively. The refinement was carried out by minimizing the wR2 function using F2 rather than F values. R1 is calculated to provide a reference to the conventional R value, but its function is not minimized. Crystallographic data for 4 were deposited at the Cambridge Crystallographic Data Centre (deposition number: CCDC 2021386). Copies of the data can be obtained, free of charge, on application to the Director, CCDC, 12 Union Road, Cambridge CB2 1EZ, UK [fax: + 44(0)-1233-336033 or deposit@ccdc.cam.ac.uk].
Sample Preparation.
The leaves collected from the 16 different M. speciosa trees (T1—16) (Table S1, Supporting Information) were used for the sample preparation. A total of 25 g of powder of air-dried leaves from each sample was extracted with 250 mL of hot MeOH (45 °C) for 12 h, followed by maceration at room temperature for another 12 h. The same procedure was repeated three times to ensure all the alkaloids were extracted as indicated by Mayer’s reagent. The extracts (3 × 250 mL) from each sample were filtered through Whatman filter paper (No. 4, Fisher Scientific). The filtrate from each sample was evaporated in vacuo and freeze-dried to give a lyophilized powder. The powdered extracts were kept at −80 °C prior to UPLC-MS analysis.
Instrumentation and Analytical Conditions for Quantitative Analysis.
A UPLC-MS/MS method reported by Sharma et al.4 was implemented for the simultaneous quantification of 14 alkaloids in the collected M. speciosa samples. In brief, a Waters Acquity Class I plus UPLC coupled with a Xevo TQ-S Micro triple quadrupole mass spectrometer (Milford, MA, USA) was used for the analysis. Chromatographic separation of the analyzed alkaloids was achieved on a Waters Acquity BEH C18 column (1.7 μm, 2.1 × 100 mm) along with the mobile phase consisting of 10 mM aqueous ammonium acetate buffer of pH 3.5 (A) and acetonitrile (B) using a gradient method over 22.5 min. The column was equilibrated initially with 80% A, which was held for 1 min, then linearly decreased to 72% until 19.5 min, then further linearly decreased to 10% reaching 21.5 min. The conditions were returned back to the initial conditions by sharply increasing A up to 80% by 21.5 min and maintaining them until 22.5 min to re-equilibrate the column.
A multiple reaction monitoring (MRM) mode was utilized for the detection of analytes using a triple-quadrupole mass spectrometer. All the analyzed alkaloids showed an adequate response with electrospray ionization (ESI) in the positive-ion mode. The monitored parent to corresponding daughter ion mass transitions (m/z) for 14 alkaloids and internal standards along with instrument parameters are shown in Table S2, Supporting Information. Collected M. speciosa samples were analyzed along with freshly prepared calibration and quality control standards. Control of UPLC/MS-MS, acquisition, and analysis of data was performed using MassLynx XS software version 4.2.
Radioligand Receptor Binding Assays.
The alkaloids from M. speciosa were screened at Eurofins Cerep (Celle l’Evescault, France) for their in vitro receptor-binding affinities at opioid receptor subtypes. Briefly, each cell membrane homogenate was incubated with a radioligand in the absence or presence of one of the isolated alkaloids in a buffer. Nonspecific binding was determined in the presence of a specific agonist or antagonist at the target receptor. Following incubation, each sample was filtered rapidly under vacuum through glass fiber filters presoaked in a buffer and rinsed several times with an ice-cold buffer using a 48- or 96-sample cell harvester. The experimental conditions that were used for the binding assay are summarized in Table 3.
In Vivo Functional Studies.
Salt and enantiomeric forms of the compounds used in the present study were as follows: (−)-morphine sulfate pentahydrate (National Institute on Drug Abuse, Drug Supply Program, Rockville, MD, USA), (−)-naltrexone hydrochloride (Sigma-Aldrich Co., St. Louis, MO, USA), and corynoxine (1) hydrochloride (see General Experimental Procedures). Doses of the compounds used in the present study are expressed as the weight of the salt or free base form listed above. All the compounds were dissolved in a vehicle consisting of sterile water (HyClone water for injection, 1 L, Fisher Scientific, Waltham, MA, USA) containing 5% Tween 80 (polyoxyethylenesorbitanmonooleate, Fisher Scientific) and 5% propylene glycol (Sigma-Aldrich Co.). All the compounds and the vehicle were administered i.v. Each solution was filtered with a 0.2 μm pore size syringe filter (Millex-LG, 0.20 μm, SLLG025SS, Sigma-Aldrich Co.) prior to injections. The injection volumes were 1.0 mL/kg of subject body weight. The dose ranges and pretreatment times were referenced to our preliminary data and the literature.26
Animals.
Adult, naive female and male (n = 6 per sex) Sprague–Dawley rats (Envigo, Indianapolis, IN, USA; age 10 weeks) were preimplanted with a catheter into a right external jugular vein upon receipt and singly acclimated in ventilated cages for at least 3 days to a temperature- (21.9 ± 1.9 °C) and humidity-controlled (53 ± 14%) vivarium with a 12 h light/dark cycle (lights on at 07:00 h) during which food (2918 Teklad Global 18% protein rodent diets, Envigo) was available in their housing cages at all times and reverse osmosis water was available in the vivarium at all times. The animal protocol (#201710059) was approved by the Institutional Animal Care and Use Committee at the University of Florida and was in accordance with the National Institutes of Health Guide for the Care and Use of Laboratory Animals, which is fully accredited by the Association for Assessment and Accreditation of Laboratory Animal Care International (AAALAC). All experiments were conducted in the light cycle (08:00 to 17:00 h) using drug naïve subjects.
Hot-Plate Testing.
The hard black anodized aluminum plate with built-in digital thermometer used in the present study (hot plate analgesia meter, 1440 analgesia hot plate with RS-232 port and software, Columbus Instruments, Columbus, OH, USA) was 33.1 cm long, 28.8 cm wide, and 9.9 cm high. A clear acrylic cage (26.7 cm long, 26.7 cm wide, 31.0 cm high) surrounded the square plate to confine an animal on the plate (total height: 40.9 cm). The size of the heated surface was 25.4 cm long, 25.4 cm wide, and 1.9 cm high, while the surface temperature range was 30 to 79.9 °C across the plate. The temperature accuracy was ±0.1 °C. The temperature, humidity, and light/dark cycle in an experimental room were equivalent to those in the vivarium. Prior to commencement of each experiment, the body weight of each animal was measured. The sample size of each experiment group per treatment was six (three subjects per sex). Following a baseline measurement for hot plate latency in each subject (see below for more details), vehicle and then cumulative injections of ascending doses of a test compound were administered i.v. at an interval of 5 min to assess the effects of compounds alone. Following are the baseline values for hot plate latency [mean (standard error of mean; SEM) seconds]: morphine [21.0 (3.11)] and corynoxine (1) [16.5 (3.31)]. For the baseline hot plate latency, two-way analysis of variance (ANOVA) indicated no significant difference in sex (F1,8 = 1.94, p = 0.201), group (F1,8 = 1.16, p = 0.312), or their interaction (F1,8 = 1.86, p = 0.210). Because there was no significant difference in baseline values and sex, data from the hot plate assay were combined per treatment (see data analysis below).
Following the baseline measurement for hot plate latency, vehicle, cumulative injections of morphine or corynoxine (1), and naltrexone (0.1 mg/kg) were administered i.v. every 5 min. The measurement of each baseline was repeated five times at a 5 min interval. Immediately following assessment of the effects of vehicle, the cycle of injections of each test compound was repeated until the hot plate latency was maximized at 60 s in all subjects to avoid tissue damage, or any deemed toxicity (i.e., seizure) or death was observed. Finally, naltrexone was injected to see reversibility of the antinociceptive effects of both test compounds.
Data Analysis.
The hot plate latencies were normalized to the percentage of the maximal possible effect (MPE), using the following formula: % MPE = 100(postinjection latency – preinjection baseline latency)/(maximum latency 60 s – preinjection baseline latency). All data per treatment group in Figure 5 were presented as means (±SEM). Using the SigmaPlot software (ver. 14.0; Systat Software Inc., San Jose, CA, USA), the significance of effects on each variable above was assessed by ANOVA, with post hoc Bonferroni t tests. A two-way (repeated-measures) ANOVA was used as appropriate (factors were compound dose and sex). Outcomes were considered significant at p < 0.05. The ED50 values (95% confidence intervals) for hot plate latency were calculated by linear regression27 of the dose–effect functions using the GraphPad Prism software (ver. 8; GraphPad Software, San Diego, CA, USA).
Supplementary Material
ACKNOWLEDGMENTS
This research was funded in part by grants UG3 DA048353 and R01 DA047855 from the National Institute on Drug Abuse and by the University of Florida Clinical and Translational Science Institute, which is supported in part by the NIH National Center for Advancing Translational Sciences, under award number UL1TR001427. This research was also funded by the Research University grant (1001.CDADAH.8011024) from the Universiti Sains Malaysia. N.J.Y.C. would like to thank the Universiti Sains Malaysia for supporting his postgraduate study under the USM Fellowship Scheme. K.A.A. wishes to acknowledge the National Science Foundation and the University of Florida for funding of the purchase of the X-ray equipment. The views and opinions expressed in this manuscript are those of the authors only and do not necessarily represent the views, official policy, or position of the U.S. Department of Health and Human Services or any of its affiliated institutions or agencies.
Footnotes
Supporting Information
The Supporting Information is available free of charge at https://pubs.acs.org/doi/10.1021/acs.jnatprod.0c01055.
Map and table describing the sampling locations of M. speciosa specimens in Peninsular Malaysia; description of the putative biosynthesis of main alkaloids in M. speciosa; 1H and 13C NMR for compounds 1–3 and 10 and 1H, 13C, and 2D NMR spectra of compound 4; ESI-TOF-MS/MS spectra of compounds 4 and 10; MRM chromatograms of test compounds 1–14 and internal standard; tables summarizing the compound parameter for tested alkaloids 1–14, internal standard for UPLC/MS/MS analysis (PDF)
Crystallographic data of compound 4 (CIF)
The authors declare no competing financial interest.
Contributor Information
Nelson Jeng-Yeou Chear, Centre for Drug Research, Universiti Sains Malaysia, 11800 Minden, Penang, Malaysia; Department of Medicinal Chemistry, College of Pharmacy, University of Florida, Gainesville, Florida 32610, United States.
Francisco León, Department of Medicinal Chemistry, College of Pharmacy, University of Florida, Gainesville, Florida 32610, United States.
Abhisheak Sharma, Department of Pharmaceutics, College of Pharmacy and Translational Drug Development Core, Clinical and Translational Sciences Institute, University of Florida, Gainesville, Florida 32610, United States.
Siva Rama Raju Kanumuri, Department of Pharmaceutics, College of Pharmacy and Translational Drug Development Core, Clinical and Translational Sciences Institute, University of Florida, Gainesville, Florida 32610, United States.
Grant Zwolinski, Department of Medicinal Chemistry, College of Pharmacy, University of Florida, Gainesville, Florida 32610, United States.
Khalil A. Abboud, Department of Chemistry, University of Florida, Gainesville, Florida 32611, United States
Darshan Singh, Centre for Drug Research, Universiti Sains Malaysia, 11800 Minden, Penang, Malaysia.
Luis F. Restrepo, Department of Pharmacodynamics, College of Pharmacy, University of Florida, Gainesville, Florida 32610, United States
Avi Patel, Department of Pharmacodynamics, College of Pharmacy, University of Florida, Gainesville, Florida 32610, United States.
Takato Hiranita, Department of Pharmacodynamics, College of Pharmacy, University of Florida, Gainesville, Florida 32610, United States.
Surash Ramanathan, Centre for Drug Research, Universiti Sains Malaysia, 11800 Minden, Penang, Malaysia.
Aidan J. Hampson, Division of Therapeutics and Medical Consequences, National Institute on Drug Abuse, National Institutes of Health, Bethesda, Maryland 20892, United States
Lance R. McMahon, Department of Pharmacodynamics, College of Pharmacy, University of Florida, Gainesville, Florida 32610, United States
Christopher R. McCurdy, Department of Medicinal Chemistry, College of Pharmacy, University of Florida, Gainesville, Florida 32610, United States; Department of Pharmaceutics, College of Pharmacy and Translational Drug Development Core, Clinical and Translational Sciences Institute, University of Florida, Gainesville, Florida 32610, United States.
REFERENCES
- (1).Singh D; Narayanan S; Vicknasingam B; Corazza O; Santacroce R; Roman-Urrestarazu A Hum. Psychopharmacol 2017, 32, No. e2582. [DOI] [PubMed] [Google Scholar]
- (2).Gogineni V; León F; Avery BA; McCurdy CR; Cutler SJ In Kratom and other Mitragynines: The Chemistry and Pharmacology of Opioids from Non-opium Source; Raffa R, Ed.; CRC Press: New York, 2014; pp 77–94. [Google Scholar]
- (3).León F; Habib E; Adkins JE; Furr EB; McCurdy CR; Cutler S Nat. Prod. Commun 2009, 4, 907–910. [PMC free article] [PubMed] [Google Scholar]
- (4).Sharma A; Kamble SH; León F; Chear NJ-Y; King TI; Berthold EC; Ramanathan S; McCurdy CR; Avery BA Drug Test. Anal 2019, 11, 1162. [DOI] [PMC free article] [PubMed] [Google Scholar]
- (5).Kruegel AC; Uprety R; Grinnell SG; Langreck C; Pekarskaya EA; Rouzic VL; Ansonoff M; Gassaway MM; Pintar JE; Pasternak GW; Javitch JA; Majumdar S; Sames D ACS Cent. Sci 2019, 5, 992–1001. [DOI] [PMC free article] [PubMed] [Google Scholar]
- (6).Obeng S; Kamble SH; Reeves ME; Restrepo LF; Patel A; Behnke M; Chear NJY; Ramanathan S; Sharma A; León F; Hiranita T; Avery BA; McMahon LR; McCurdy CR J. Med. Chem 2020, 63, 433–439. [DOI] [PMC free article] [PubMed] [Google Scholar]
- (7).Ellis CR; Racz R; Kruhlak NL; Kim MT; Zakharov AV; Southall N; Hawkins EG; Burkhart K; Strauss DG; Stavitskaya L PLoS One 2020, 15, No. e0229646. [DOI] [PMC free article] [PubMed] [Google Scholar]
- (8).Wanner MJ; Ingemann S; van Maarseveen JH; Hiemstra H Eur. J. Org. Chem 2013, 2013, 1100–1106. [Google Scholar]
- (9).Ali Z; Demiray H; Khan IA Tetrahedron Lett. 2014, 55 (9), 369–372. [Google Scholar]
- (10).Beckett AH; Dwuma-Badu D; Haddock RE Tetrahedron 1969, 25, 5961–5969. [DOI] [PubMed] [Google Scholar]
- (11).Shellard EJ; Houghton PJ; Resha M Planta Med. 1978, 34, 26–36. [Google Scholar]
- (12).Cao X-F; Wang J-S; Wang X-B; Luo J; Wang H-Y; Kong L-Y Phytochemistry 2013, 96, 389–396. [DOI] [PubMed] [Google Scholar]
- (13).Kitajima M; Misawa K; Kogure N; Said IM; Horie S; Hatori Y; Murayama T; Takayama HJ Nat. Med 2006, 60, 28–35. [Google Scholar]
- (14).Takayama H; Ishikawa H; Kurihara M; Kitajima M; Aimi N; Ponglux D; Koyama F; Matsumoto K; Moriyama T; Yamamoto LT; Watanabe K; Murayama T; Horie SJ Med. Chem 2002, 45, 1949–1956. [DOI] [PubMed] [Google Scholar]
- (15).Flores-Bocanegra L; Raja HA; Graf TN; Augustinović M; Wallace ED; Hematian S; Kellogg JJ; Todd DA; Cech NB; Oberlies NH J. Nat. Prod 2020, 83, 2165–2177. [DOI] [PMC free article] [PubMed] [Google Scholar]
- (16).Brown PN; Lund JA; Murch SJ J. Ethnopharmacol 2017, 202, 302–325. [DOI] [PubMed] [Google Scholar]
- (17).Vergara D; Gaudino R; Blank T; Keegan B PLoS One 2020, 15, No. e0236878. [DOI] [PMC free article] [PubMed] [Google Scholar]
- (18).Alvarenga-Venutolo S; Rosales-López C; Sánchez-Chinchilla L; Munoz-Arrieta R; Aguilar-Cascante F Phytochemistry 2018, 151, 26–31. [DOI] [PubMed] [Google Scholar]
- (19).Peñaloza EMC; Kaiser S; Resende PED; Pittol V; Carvalho AR; Ortega GG Quim. Nova 2015, 38, 378–386. [Google Scholar]
- (20).Zhang Y; Liu C; Qi Y; Li S; Pan Y; Li YJ Chromatogr. A 2015, 1388, 36–42. [DOI] [PubMed] [Google Scholar]
- (21).Ndagijimana A; Wang X; Pan G; Zhang F; Feng H; Olaleye O Fitoterapia 2013, 86, 35–47. [DOI] [PubMed] [Google Scholar]
- (22).Wang K; Zhou X-Y; Wang Y-Y; Li M-M; Li Y-S; Peng L-Y; Cheng X; Li Y; Wang Y-P; Zhao Q-SJ J. Nat. Prod 2011, 74, 12–15. [DOI] [PubMed] [Google Scholar]
- (23).Maxwell EA; King TI; Kamble SH; Raju KSR; Berthold EC; León F; Avery B; McMahon L; McCurdy CR; Sharma A Planta Med. 2020, 86, 1278–1285. [DOI] [PMC free article] [PubMed] [Google Scholar]
- (24).Spek AL Acta Crystallogr., Sect. D: Biol. Crystallogr 2009, 65, 148–155. [DOI] [PMC free article] [PubMed] [Google Scholar]
- (25).SHELXTL; Bruker-AXS: Madison, WI, USA, 2014. [Google Scholar]
- (26).Obeng S; Wilkerson JL; León F; Reeves ME; Restrepo LF; Gamez-Jimenez LR; Patel A; Pennington AE; Taylor VA; Ho NP; Braun T; Fortner JD; Crowley ML; Williamson MR; Pallares VLC; Mottinelli M; Lopera-Londoño C; McCurdy CR; McMahon LR; Hiranita TJ J. Pharmacol. Exp. Ther 2021, 376, 410–427. [DOI] [PMC free article] [PubMed] [Google Scholar]
- (27).Snedecor GW; Cochran WG Statistical Methods, 6th ed.; Iowa State University Press: Ames, IA, 1967. [Google Scholar]
- (28).Kruegel AC; Gassaway MM; Kapoor A; Váradi A; Majumdar S; Filizola M; Javitch JA; Sames DJ Am. Chem. Soc 2016, 138, 6754–6764. [DOI] [PMC free article] [PubMed] [Google Scholar]
Associated Data
This section collects any data citations, data availability statements, or supplementary materials included in this article.