Abstract
Cell-surface sphingomyelin (SM) inhibits binary and ternary complex activity of blood coagulation by an unknown mechanism. Here we show the OH functionality of SM contributes in forming the close assembly through intermolecular H-bond and through Ca2+ chelation, which restricts the protein–lipid/protein–protein interactions and thus inhibits the coagulation procedure.
Cell-surface sphingomyelin (SM) inhibits binary and ternary complex activity of blood coagulation.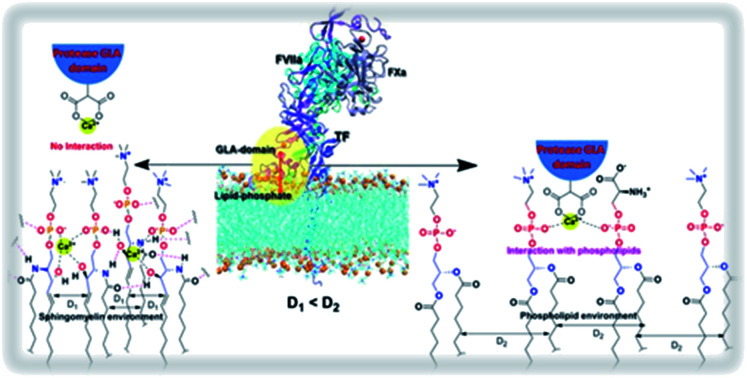
1. Introduction
Blood coagulation, a tightly regulated hemostatic process initiates through the formation and activation of a binary complex Tissue Factor–Factor VIIa (TF–FVIIa) followed by a ternary complex, Tissue Factor–Factor VIIa–Factor Xa (TF–FVIIa–FXa). Tissue factors are transmembrane glycoproteins that reside in the cells in the extravascular tissue, whereas FVII/FVIIa and FX/FXa circulate in the bloodstream. Due to vascular injury, they come into proximity and form complexes. Ternary complexes further commence a series of protease activation and the ultimate result is the stoppage of bleeding through gel-like clot formation.1–3 Any aberration in the tight regulation of binary and ternary complex activation may cause myocardial infarction, unstable angina, ischemic stroke, inflammation, and even cancer.4–6 The lipid environment highly influences the binary and ternary complex activity because both FVIIa and FXa interact with the cell surface lipid through their N terminal post-translationally modified Gla domain in presence of Ca2+ and allosterically regulate their protease domain. Negatively charged phosphatidyl-serine (PS) has been mostly studied lipid and designated as the most potent activity enhancer of these complexes.7–10 Apart from PS, sphingomyelin (SM) has a distinct effect on coagulation. Introduction of SM in place of phosphatidyl-choline (PC) attenuates prothrombin activity both in the presence and absence of PS, by an unknown mechanism.11 In a recent study, Rao et al. have convincingly shown that SM can also participate in the decryption of TF–FVIIa proteolytic activity.12 The involvement of SM in regulating the activity of the coagulation has been well established but the molecular-level mechanistic details remain unveiled.
2. Experimental
2.1. NMR, TLC, MALDI and HRMS
All the 1H and 13C NMR were recorded on Burker 500 MHz spectrometer respectively with TMS as the internal standard and chemical shift are shown in δ ppm scales. 31P NMR was recorded in 500 MHz spectrometer and chemical shifts were referenced to 0.0 ppm in 1H NMR spectrum which is considered as the standard method by IUPAC convention. All NMR data were taken in CDCl3 solvent. All solvents were dried. Pyridine was dried via two steps at first refluxing with KOH for 3–4 hours followed by refluxing with calcium hydride for 3 hours and then distilled in fresh oven-dried round bottom flask. Reactions were monitored by TLC (Germany MERK). 60 F254 specific plates were taken and cut into 4 cm length. The solvent was run approximately 3.5 cm. TLC plates were detected by charging with cupric acetate. The mobile phase of TLC plates were run either with ethyl acetate–hexane mixture or with chloroform–methanol–triethylamine (94.5 : 05 : 0.5) mixture depending on the polarity of the compound. Mass of the lipids was measured by MALDI-TOF. Chloroform dissolved lipids were mixed with the matrix 2,5-dihydroxybenzoic acid in saturated THF solution. 4 μl of lipids and matrix mixtures were analyzed through MALDI-TOF. HRMS was taken using Quadruple TOF (Q-TOF) micro MS system using electrospray ionization (ESI) technique.
2.2. Cell culture
The human breast cancer cell line, MDA-MB-231 was purchased from American Type Culture Collection (ATCC) and was cultured in standard DMEM (Gibco; Life Technologies) whereas the human monocytic cell line, THP-1 (ATCC) and the differentiated macrophages were maintained in RPMI (Gibco). The media were supplemented with 10% FBS and 1% penicillin–streptomycin solution (Gibco) and the cells were maintained at 37 °C with 5% CO2 level.
2.3. FXa generation assay
TF activity was measured by FXa generation assay as described previously.13 Briefly, MDA-MB-231 and macrophages (differentiated with PMA, 50 ng ml−1, Sigma) were seeded onto 96-well plates. At 90% confluency, serum starvation was given for an hour followed by treatment with various concentrations of SMase (0–2 U ml−1, Sigma) for 30 minutes. The supernatant was discarded and human recombinant FVIIa (20 nM; Novo Nordisk) was treated for 5 minutes followed by the addition of FX (300 nM; Haemtech) for 15 minutes. The reaction was stopped with 75 μl of 20 mM EDTA (SRL) and 50 μl of cell supernatant was incubated with 25 μl of the chromogenic substrate (1 mg ml−1) (substrate for FXa, Chromogenix S2765; DiaPharma, West Chester, PA, USA) and O.D. was measured at 405 nm (SPECTROMAX M2) from which FXa generation rate was calculated in nM min−1 and graph was accordingly prepared. Monocytes were treated with SMase for 30 minutes and pellet down at 2400 rpm for 3 minutes which was re-suspended in buffer containing 20 nM of FVIIa for 5 minutes. Cells were removed by centrifugation and the supernatant was incubated with 300 nM of FX for 15 minutes followed by the addition of EDTA. FXa generation rate was calculated accordingly. For annexin-V-related experiments, the reagent (200 nM) was added 30 minutes prior to SMase treatment and subsequently, TF activity was measured from which graph was generated using GraphPad Prism.
2.4. Cell surface TF analysis by immunostaining
MDA-MB-231 cells were seeded onto two 35 mm dishes and allowed to achieve 60% confluency. After serum starvation, SMase (1.5 U ml−1) was added to one dish taking another as a control. Both the cells were fixed by using 4% paraformaldehyde for 10 minutes followed by washing with 1× PBS and blocking with 3% BSA for an hour. Then cells were treated overnight with TF primary antibody (1 : 500) without permeabilization followed by washing and incubation with fluorescent (red)-tagged secondary antibody (1 : 1000; Cell Signaling Technology) for an hour. Cells were washed thrice with 1× PBS and subjected to imaging by a fluorescence microscope (Olympus) both under 40× and 100× objectives.
2.5. Total TF protein analysis by western blotting
After ELISA assay, the primary TF antibody was removed from the cell-surface by low pH glycine (pH 2.0, SRL) and cells were lysed with Laemmle buffer. The proteins were separated by 10% SDS-PAGE (Bio-Rad) and transferred onto a PVDF membrane (Merck, Millipore). The membrane was blocked with 5% BSA followed by TF primary antibody incubation overnight. On the next day, the membrane was washed and treated with secondary antibody (HRP-tagged; Anti-Rabbit, Sigma). After washing, the blot was developed by the conventional ECL method. GAPDH (Sigma) was used as a loading control. The band intensities were measured by imageJ and the graph was prepared by using GraphPad Prism 5.
2.6. Computational modeling of FX–flTF–FVIIa complex in various composition of the membrane bilayer
The membrane bilayer in two sets; POPC:POPS (80 : 20), PSM (100) were prepared using CHARMM-membrane builder server and subjected to equilibration followed by energy minimization using consecutive input file for 6–8 ns time period. The last coordinates of the equilibrated membrane were taken for the construction of the membrane-bound FX–flTF–FVIIa ternary complex. We have performed computational modeling in three stages. In the first stage, the coordinates of the sTF–FVIIa complex were taken from the crystal structure of TF–FVIIa having PDB code: 1dan, in which the co-crystalline bound inhibitor was removed. Missing residues, numbering as 143–144 and 145–152 of light chain (FVIIa) were modeled according to the template crystal structure of FVIIa (PDB code: 1qfk)14 and template segment (97–104) of chain L from FX (PDB code: 2h9e),15 respectively. Similarly, initial coordinates of sTF (residue numbering 3–213) from the X-ray crystal structure (PDB code: 1boy)16 were used as the initial structure for the corresponding domains. Other missing residues of TF were modeled based on the template structure of sTF for residues 1–2 (PDB code: 2hft).17 As the transmembrane domain of TF was modeled based on the template structure carbonic anhydrase 2 (chain A) for residues 214–222 (PDB code: 2w3n).18 Lastly, the cytoplasmic tail region (245–263) of TF was taken from the NMR structure of the cytoplasmic part of TF (PDB code: 2ceh)19 and the coordinates of two missing residues (243–244) were constructed using PyMOL software. In the second stage, the membrane bilayer was aligned along the z-axis and the FVIIa complex was placed in such a way that the membrane anchoring keel region of GLA domain (FVIIa) was positioned into the interstitial region of the lipid bilayer. In this condition, the distance of catalytic triad (CT) residues from the head group of membrane lipid was measured to be around 78 Å. In the third stage, modeled loop, trans-membrane region, cytoplasmic part of TF were joined to the sTF of the binary complex using Accelrys Discovery studio visualization software with manual adjustment of the orientation of side chains of connected residues to yield the flTF–FVIIa membrane-bound complex in three different subsets (POPC:POPS and PSM) in which composition of lipid bilayer varies.
2.7. MD simulation setup
Throughout this work, FX–flTF–FVIIa ternary membrane-bound complex in lipid environment compositions POPC:POPS (4 : 1) and PSM were simulated using NAMD-2.9 molecular dynamics package with CHARMM36 force field parameter for all lipid and protein molecules.20,21 Topology and parameter files for Gla residue (FVIIa and FX) were build based on similar chemical groups present in topology and parameter files. All the systems were solvated in a periodic truncated box of size 128 × 128 × 180 Å3 using TIP3P water model.22 In order to obtain a 5 mM calcium physiological ionic concentration, several water molecules were randomly replaced with Ca2+ and Cl− ions to achieve the desired 5 mM salt concentration. The temperature of the system was set to 310 K using the damping coefficient (γ) of 1 ps−1 by Langevin dynamics. The direct non-bonded potential cut-off was set to 12 Å with 2 Å pair-list distance cut off, and 1–4 scaling factor was used in simulation input file. Langevin piston method was applied to keep pressure constant in the periodic boundary conditions.23,24 Energy minimization of the system was done using the conjugate gradient method for 40 000-time steps. During the initial period, modeled protein was constrained during the first 0.5 ns simulation with 1 fs time interval using a short “constant-pressure” NPT. In the next step, the whole system was allowed to move and equilibrated for the period of 2 ns with 2 fs time interval. The system was switched to NPnAT ensemble (constant membrane-normal pressure, Pn, temperature and membrane area) for each set. Trajectories were collected in the interval of 2 ps and the final 60 ns trajectories were used for analyses.
2.8. Modeling of ternary FX–flTF–FVIIa complex in PC:PS (4 : 1) and PSM membrane lipid
The membrane bilayer composed of PC (100), PC:PS (80 : 20) and SM (100) individually were prepared using CHARMM-membrane builder server and subjected to equilibration followed by energy minimization using consecutive input file for 6–8 ns time period. The last coordinates of the equilibrated membrane lipid were taken for the construction of membrane-bound ternary complex FX–flTF–FVIIa. We have performed the computational modeling in three stages. In the first stage, the coordinates of sTF–FVIIa complex were taken from the crystal structure of TF–FVIIa (PDB ID: 1DAN), where the co-crystalline bound inhibitor was removed. Missing residues, numbering as 143–144 and 145–152 of light chain (FVIIa) were modeled according to the template crystal structure of FVIIa (PDB code: 1qfk)25 and template segment (97–104) of chain L from FX (PDB code: 2h9e),15 respectively. Similarly, initial coordinates of sTF (residue numbering 3–213) from X-ray crystal structure (PDB code: 1boy)16 were used as the initial structure for the corresponding domains. Other missing residues of TF were modeled based on template structure of sTF for residues 1–2 (PDB code: 2hft).17 As the transmembrane domain of TF was modeled based on the template structure carbonic anhydrase 2 (chain A) for residues 214–222 (PDB code: 2w3n).18 Lastly, the cytoplasmic tail region (245–263) of TF was taken from the NMR structure of cytoplasmic part of TF (PDB code: 2ceh)19 and the coordinates of two missing residues (243–244) were constructed using PyMOL software. In the second stage, membrane bilayer was aligned along the z-axis and FVIIa complex was placed in such a way that the membrane anchoring keel region of Gla domain (FVIIa) was positioned into the interstitial region of the lipid bilayer. In this condition, the distance of catalytic triad (CT) residues from the head group of membrane lipid was measured to be around 78 Å. In the last stage, modeled loop, trans-membrane region, cytoplasmic part of TF were joined to the sTF of binary complex using Accelrys Discovery studio visualization software with manual adjustment of the orientation of side chains of connected residues to yield binary complex as similar as described previously.26,27 Ternary complex FX–flTF–FVIIa in the lipid environment was build up using the superimposition of membrane-bound TF–FVIIa binary complex with putative sTF–FVIIa–FX ternary complex (PDB code: 1NL8). Missing residues of the FX-light chain were modeled as mentioned previously. Modeled residues were joined using discovery studio along with the visual examination and manual adjustment of residues side chains. Henceforth, the ternary complex in three different lipid environments (PC, PC:PS and SM) were built and subjected to MD simulation to generate the all-atom solvent-equilibrated model.
2.9. Statistical analysis
The data shown here are representative of at least three independent experiments. The data are as mean ± S.E. of the mean and the differences are considered to be statistically significant at p < 0.05 using the Student's t-test.
2.10. Synthesis
(S)-3-tert-Butyl 4-methyl 2,2-dimethyloxazolidine-3,4-dicarboxylate (1)
3 g (28.546 mmol) of l-serine in 50 ml of anhydrous methanol was taken in 100 ml of round bottle flask. 2.27 ml (31.40 mmol) of thionyl chloride was added drop-wise to that at 0 °C in an ice bath. The reaction mixture was stirred at room temperature for 18 h till the complete disappearance of starting material then methanol was removed in the reduced pressure. The compound is dissolved in dichloromethane and triethylamine was added drop wise at ice bath after addition of Boc anhydride. The reaction mixture was stirred at room temperature for 24 h. The solvent was removed in reduced pressure. Compound was worked up in ethyl acetate and washed in brine. The combined organic extract were dried over Na2SO4 and the solvent was removed through vacuum to give N-tert-butyloxycarbonyl methyl ester of l-serine (6.0 g). The compound was dissolved in dry acetone and 2,2-dimethoxypropane was added to that in the ice bath at 0 °C and then boron trifluoride etherate was added. The reaction mixture was stirred at room temperature for 18 h then the solvent was removed in reduced pressure. Compound was worked up in ethyl acetate and washed in brine. The combined organic extracted were dried over Na2SO4 and the solvent was cotton filtrated and removed in vacuum and the residue was subjected to flash chromatography (hexane/ethyl acetate 8 : 2) a to give 6.8 g. (262.404 mmol 93%) as a colorless oil. Rf = 0.5 (20% EtOAc in hexane), [α]25D = −44.49 (c = 40, CHCl3). 1H NMR (500 MHz, CDCl3): δ rotamer 4.43–4.32 (m, 1H), 4.10–3.96 (m, 2H), 3.71 (S, 3H), 1.62–1.59 (m, 3H), 1.49–1.45 (m, 9H), 1.37 (S, 3H); 13C NMR (125 MHz, CDCl3): δ 171.7, 151.2, 95.1, 94.4, 80.9, 80.3, 66.3, 66.0, 59.3, 59.2, 52.4, 52.3, 28.4, 25.2, 25.0; HRMS (ESI) m/z calculated for C12H21NO5 [M + Na]+ 282.132 found 282.132; elemental analysis calcd for (C12H21NO5): C, 55.58; H, 8.16; N, 5.40; found: C, 55.57; H, 8.14; N, 5.39.
(R)-tert-Butyl 4-(hydroxymethyl)-2,2-dimethyloxazolidine-3-carboxylate (2)
LiAlH4 (3.16 equiv.) was added at 0 °C over 15 min to a solution of compound 1 (6 g, 23.14 mmol) taken in 250 ml round bottom flask in THF (80 ml). The reaction mixture was stirred at 0 °C for 1 h. Water was added slowly to the reaction mixture at 0 °C. The suspension was stirred 15 min, diluted with diethyl ether (50 ml, 3 times), filtrated through Celite pad and eluted with ether. The filtrated was washed with brine, dried over Na2SO4, filtrated and concentrated with reduced pressure. The crude compound is purified by column chromatography on silica gel 60–120, eluted with 25% v/v ethyl acetate/hexane to give the title compound as colorless oil (5.6 g, 94%). [α]25D = −14.73 (c = 250, CHCl3). 1H NMR (500 MHz, CDCl3): δ 4.04–3.70 (m, 5H), 3.55 (m, 1H), 1.52–1.44 (m, 15H); 13C NMR (100 MHz, CDCl3): δ 145.1, 94.1, 18.2, 65.3, 65.1, 58.4, 28.4, 27.2, 24.6; HRMS (ESI) m/z calculated for C11H21NO4 [M + Na]+ 254.137 found 254.137; elemental analysis calcd for (C11H21NO5): C, 57.12; H, 9.15; N, 6.06; found: C, 57.11; H, 9.16; N, 6.05.
(R,Z)-tert-Butyl 4-((hexadec-8-en-1-yloxy)methyl)-2,2-dimethyloxazolidine-3-carboxylate (3)
Under nitrogen atmosphere to a solution of an alcohol 2 (2 g, 8.64 mmol), and TBAI (0.27 mg, 0.86 mmol) in THF, NaH (60% in mineral oil, 414 mg, 17.28 mmol) was added at 0 °C and the whole solution was stirred for 30 min, then (Z)-1-iodooctadec-9-ene (3.32 g, 9.50 mmol) was added to the solution at 0 °C and then the whole solution was stirred for 1 h at room temperature. After quenching the reaction with ice-water, the obtained organic layer was diluted with EtOAc and the whole was washed with brine and dried over Na2SO4. The solvent was cotton filtrated and evaporated and the resultant residue was purified by chromatography (5% EtOAc in hexane). The appearance of the purified compound 3 (3.49 g, 89%) is like a colorless oil. Rf = 0.5 (10% EtOAc in hexane). [α]25D = −11.34 (c = 55, CHCl3). 1H NMR (500 MHz, CDCl3): δ 5.34–5.32 (m, 4H), 3.99–3.89 (m, 3H), 3.49–3.37 (m, 3H), 3.30–3.28 (t, J = 5 Hz, 1H), 2.02–1.97 (m, 4H), 1.55–1.51 (m, 5H), 1.46 (m, 12H), 1.27–1.17 (m, 27H), 0.88–0.85 (t, J = 5 Hz, 3H); 13C NMR (125 MHz, CDCl3): δ 152.3, 130.0, 129.9, 93.4, 80.3, 79.8, 70.9, 56.6, 56.5, 32.7, 32.0, 30.8, 29.9, 29.8, 29.7, 29.6, 29.5, 29.4, 29.3, 29.2, 28.5, 27.7, 27.6, 27.4, 27.3, 26.8, 26.4, 26.3, 26.2, 24.5, 23.2, 22.8, 14.2.
N-((S)-1-Hydroxy-3-((Z)-octadec-9-en-1-yloxy)propan-2-yl)oleamide (4)
To a solution of (2 g, 4.41 mmol) of 3 in 10 ml of DCM taken in 100 ml of round bottle flask, 1 ml (13.23 mmol) of TFA was added dropwise at 0 °C in an ice bath. The reaction mixture was stirred at room temperature for 4 h. After quenching the reaction with saturated NaHCO3, the obtained organic layer was diluted with EtOAc and the whole was washed with brine and dried over Na2SO4. The solvent was cotton filtrated and evaporated and the resultant residue was purified by chromatography (25% EtOAc in hexane). The appearance of the purified compound (S,Z)-2-amino-3-(octadec-9-en-1-yloxy)propan-1-ol is like a colorless oil. Rf = 0.5 (30% EtOAc in hexane). [α]25D = +1.54 (c = 70, CHCl3);
To a solution of 3 g (10.62 mmol) of oleic acid in 30 ml of anhydrous DCM taken in 100 ml of round bottle flask, 0.67 ml (5.31 mmol) of oxalic chloride was added dropwise at 0 °C in an ice bath. The reaction mixture was stirred at room temperature for 3 h till the complete disappearance of starting material then DCM was removed in reduced pressure. Compound (S,Z)-2-amino-3-(octadec-9-en-1-yloxy)propan-1-ol was dissolved in 10 ml dichloromethane which was added dropwise at ice bath in 5 min. The reaction mixture was stirred at room temperature for 18 h. After quenching the reaction with saturated NaHCO3, the obtained organic layer was diluted with EtOAc and the whole was washed with brine and dried over Na2SO4. The solvent was cotton filtrated and evaporated and the resultant residue was purified by chromatography (10% EtOAc in hexane). The appearance of the purified compound 4 (1.71 g, 64%) is like a colorless oil. Rf = 0.5 (10% EtOAc in hexane). [α]25D = 1.38 (c = 79, CHCl3); 1H NMR (500 MHz, CDCl3): δ 7.41–7.40 (br, 1H), 5.34–5.31 (m, 4H), 4.10–3.39 (m, 8H), 2.32–1.19 (m, 10H), 1.62–1.32 (m, 6H), 1.28–1.11 (m, 40H), 0.92–0.85 (m, 6H); 13C NMR (125 MHz, CDCl3): δ 173.9, 130.1, 130.0, 129.9, 71.9, 71.7, 64.2, 50.7, 36.9, 34.3, 34.0, 33.9, 32.7, 32.2, 32.0, 31.5, 29.9, 29.8, 29.7, 29.6, 29.5, 29.4, 29.3, 29.2, 29.0, 27.3, 26.2, 25.8, 25.7, 25.0, 24.8, 24.0, 23.5, 22.7, 20.7, 17.4, 14.7, 14.6; HRMS (ESI) m/z calculated for C39H75NO3 [M + Na]+ 628.564 found 628.564; elemental analysis calcd for (C39H75NO3): C, 77.29; H, 12.47; N, 2.31; found: C, 77.26; H, 12.48; N, 2.30.
Triethylammonium (R)-3-((Z)-octadec-9-en-1-yloxy)-2-oleamidopropyl phosphite (5)
To a solution of compound 4 (1 g, 1.65 mmol) in dry pyridine diphenyl phosphite (2.31 ml, 9.90 mmol) was added dropwise over 2 min at 0 °C ice water bath and the resulting solution was stirred for 1 h. After that 5 ml of 1 : 1 triethyl amine–water mixture was added. The reaction mixture was stirred at room temperature for another 1 hour, following the removal of pyridine under reduced pressure. The crude product was dissolved in CH2Cl2; the organic phase was washed with a saturated solution of NaHCO3 (3 times), and next with brine finally dried over Na2SO4. After removal of the drying agent by filtration, the filtrate was concentrated under reduced pressure. The crude product was purified by silica gel column chromatography (95 : 5 : 0.5 CHCl3–MeOH–NEt3) to yield the desired product 6 (1.17 g, 92% yield) as a colorless substance Rf = 0.4 (5% MeOH in CHCl3). [α]25D = 3.6 (c = 53, CHCl3); 1H NMR (500 MHz, CDCl3): δ 7.58 (br, 1H), 6.02 (s, 1H), 5.83 (br, 1H), 5.34–5.29 (m, 4H), 4.05–3.87 (m, 3H), 3.51–3.35 (m, 4H), 3.05–2.99 (m, 6H), 2.24–2.09 (m, 8H), 1.56–1.42 (m, 4H), 1.38–1.07 (m, 53H), 0.85–0.83 (m, 6H); 13C NMR (125 MHz, CDCl3): δ 173.3, 130.3, 129.9, 129.8, 71.4, 69.0, 68.6, 62.5, 60.5, 50.9, 49.3, 49.2, 45.6, 39.2, 36.8, 35.1, 32.6, 31.9, 29.8, 29.7, 29.5, 29.4, 29.3, 29.2, 29.1, 27.6, 27.2, 26.1, 25.8, 25.6, 25.4, 24.6, 22.7, 14.1, 8.7; 31P NMR (202 MHz, CDCl3): δ 6.29, 6.07 (rotamer); MALDI-MS (ESI) m/z calculated for C45H91N2O5P [M + Na–NEt3]+ 692.536 found 692.536 (in MALDI-MS counter ion triethyl amine is replaced by sodium ion); elemental analysis calcd for (C45H91N2O5P): C, 70.08; H, 11.89; N, 3.63; found: C, 70.04; H, 11.96; N, 3.60.
(R)-3-((Z)-Octadec-9-en-1-yloxy)-2-oleamidopropyl (2-(trimethylammonio)ethyl)phosphate (6)
To a solution of compound 5 (150 mg, 0.187 mmol) and choline chloride (31.33 mg, 0.224 mmol) in dry pyridine, pivaloyl chloride (0.150 ml, 1.12 mmol) was added in dropwise manner at 0 °C ice-water bath and the resulting solution was stirred for 1 h. The solvent was removed under reduced pressure. The crude product was dissolved in CH2Cl2, the organic phase was washed with a saturated solution of NaHCO3 (3 times), and brine and dried over Na2SO4. The resultant compound in 95% pyridine–water (1.5 ml), iodine (10 mol%) was added at 0 °C in ice-water bath. The resulting solution was stirred for 3 h. The solvent was removed under reduced pressure, washed with brine and dried over Na2SO4. After removal of the drying agent by filtration, the filtrate was concentrated under reduced pressure. The crude product was purified by silica gel column chromatography (9.5 : 0.5 : 0.5 = CHCl3 : MeOH : NEt3) to yield the desired product 6 (140 mg, 94% yield) as a colorless semisolid, Rf = 0.23 (5% MeOH in CHCl3). [α]25D = +5.6 (c = 76, CHCl3); 1H NMR (500 MHz, CDCl3): δ 8.64–8.63 (br, 1H), 5.33–5.28 (m, 4H), 4.38–3.98 (m, 9H), 3.55–3.34 (m, 11H), 2.01–1.99 (m, 8H), 1.54–1.52 (m, 2H), 1.34–1.03 (m, 46), 0.86–0.81 (m, 6H); 13C NMR (125 MHz, CDCl3): δ 174.1, 130.0, 129.9, 129.4, 129.3, 72.5, 54.8, 53.5, 47.2, 46.4, 45.4, 40.3, 38.8, 38.6, 33.9, 33.5, 32.0, 30.2, 30.1, 29.8, 29.7, 29.6, 29.4, 29.2, 29.0, 28.5, 27.4, 27.3, 27.2, 27.0, 14.1; 31P NMR (162 MHz, CDCl3): δ 0.32, MALDI-MS (ESI) m/z calculated for C44H87N2O6P [M + Na]+ 793.620 found 793.620; elemental analysis calcd for (C44H87N2O6P): C, 68.53; H, 11.37; N, 3.63; found: C, 68.54; H, 11.36; N, 3.63.
3. Results and discussion
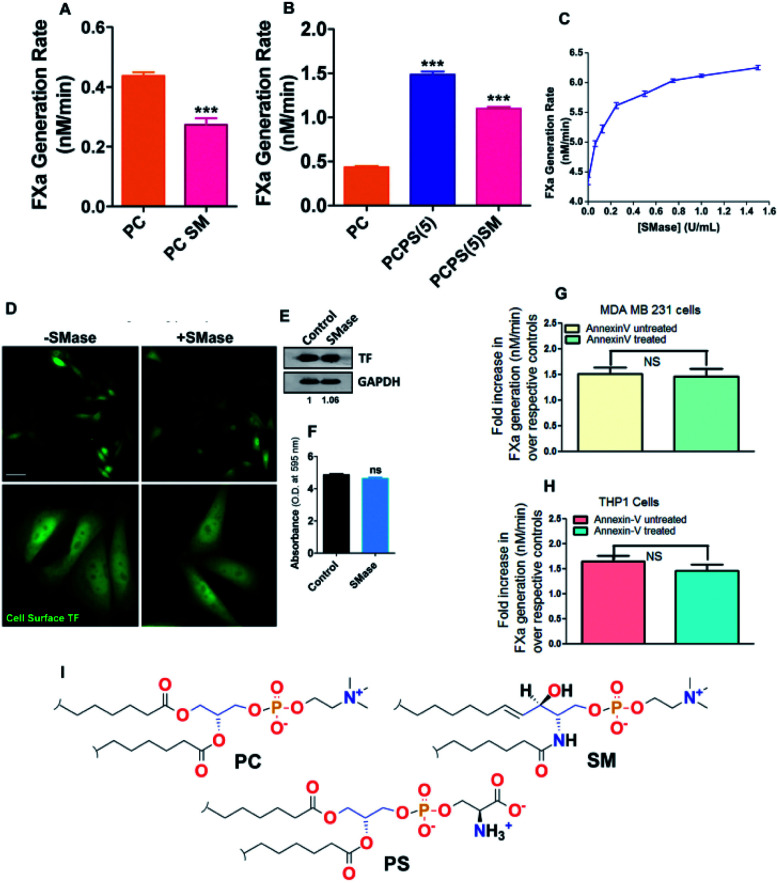
In agreement with the previous finding,12,28 we also found a significant attenuation of TF–FVIIa proteolytic activity when 20% of SM has been introduced in place of PC or PS (Fig. 1A and B) in proteoliposome. SM is the major lipid component on the cell surface.29 Next to evaluate the effect of SM on MDA MB231 cell (ubiquitously express TF on the cell surface), cell surface SM was removed with varying concentrations of sphingomyelinase (SMase) followed by FXa generation assay was performed. Dose-dependent enhancement of TF–FVIIa activity (Fig. 1C) was observed which saturates near 1 U ml−1 SMase concentration. Through cell surface ELISA and immunoblot we further established that this enhancement is not due to overexpression of TF (Fig. 1D and F). We further exclude the possibility of greater PS exposure due to SMase treatment because we got the similar enhancement of TF procoagulant activity in ± annexin V (PS blocker) pretreated SMase treated cells (Fig. 1G). Similar results were obtained from THP1 cell (monocyte) derived macrophage (Fig. 1H). This establishes that like in vitro proteoliposome, SM actively inhibits the TF activity on the cell surface which is independent of cell type.
Fig. 1. SM-dependent regulation of activity of coagulation factors. (A and B) TF–FVIIa activity by FXa generation chromogenic assay with the proteoliposomes containing different PL compositions. (C) TF–FVIIa activity by FXa generation chromogenic assay on MDA-MB-231 cells after treatment of varying concentration (0–2 U ml−1) SMase. (D) TF antigenic levels on the MDA cell surface by immunostaining and captured through fluorescence microscopy. (E) TF antigenic levels in the MDA cell surface by western blot. (F) TF antigenic levels on MDA cell surface by cell surface ELISA. (G) TF–FVIIa activity by FXa generation chromogenic assay on MDA-MB-231 cells ± annexin V treatment. (H) TF–FVIIa activity by FXa generation chromogenic assay on THP1 derived macrophage cells ± annexin V treatment. All data presented here are as mean ± SEM (n ≥ 3). Differences are statistically significant at p < 0.05 by Student's t-test. (I) Chemical structure of PC, SM, and PS.
Through this report, we have tried to identify the mechanistic interpretation of SM-induced inhibition of initiation complexes activity. Structurally PC and SM share the same head group choline, but the differences lie in their basic backbone structure. In PC a glycerol backbone is present whereas SM has a ceramide backbone. More precisely in PC, the fatty acid chains are linked with glycerol by making two ester linkages whereas in SM at ceramide backbone one fatty acid is linked with an amide linkage and the other hydrophobic tail is linked directly by C–C bond. Apart from that, there is an additional OH group at C-3 carbon in SM (Fig. 1I).
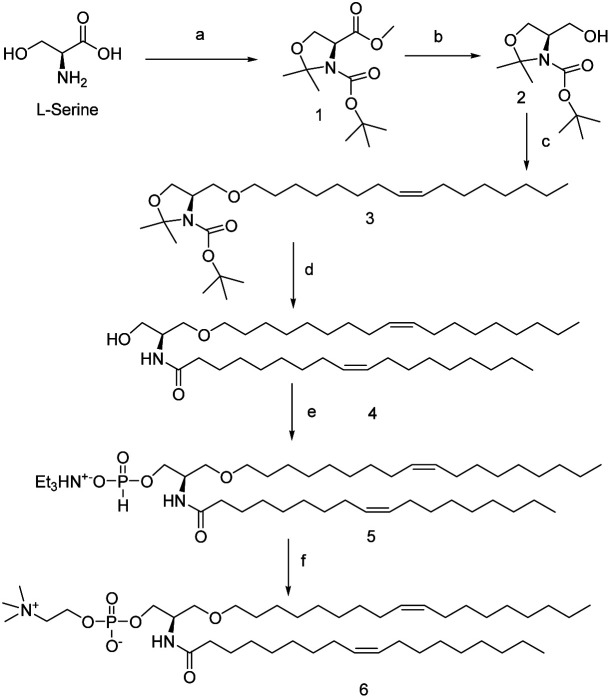
Based on these structural differences, we hypothesize that the OH functionality at the C3 carbon may play a vital role in SM-mediated inhibition of binary or ternary complexes. To establish that we have adapted the functional group replacement (FGR) method, where we have synthesized the lipid analog of SM which does not have any C3 OH (compound 6). The synthesis of 6 is shown in Scheme 1.
Scheme 1. Synthesis scheme of compound 6. Reagents and conditions: (a) (i) SOCl2, MeOH, 0 °C, 18 h; (ii) Boc2O, CH2Cl2, NEt3; rt, 24 h; (iii) 2,2-dimethoxypropane, acetone, BF3·OEt2, 86%; (b) LiAlH4, Et2O, 0 °C, 96%; (c) (Z)-1-iodooctadec-9-ene, NaH, THF, TBAI, 0 °C, 89%; (d) (i) TFA, CH2Cl2, 0 °C, 4 h, 74%; (ii) oleic acid, (COCl)2, CH2Cl2, 0 °C, 4 h, 64%; (e) (i) diphenyl phosphite, pyridine, 0 °C, 0.5 h (ii) NEt3 : H2O (1 : 1), 1 h, rt. 92%; (f) (i) choline, PivCl, pyridine, 0.5 h, rt, 94% (ii) I2, pyridine–H2O (9 : 1), rt, 94%.
We have started with commercially readily available l-serine. The acid and amine functional groups were protected with MeOH and Boc respectively followed by protection of the alcohol functionality with acetone to result in compound 1. Ester functionality of 1 is then reduced with LAH to yield compound 2 with >90% yield. Next alcohol of compound 2 was reacted with (Z)-1-iodooctadec-9-ene to form an ether, which on deprotection gave the compound 3. Compound 3 was then subjected to reaction with oleoyl chloride which has been in situ generated by a reaction between oleic acid and oxyl chloride to yield the amide 4. This amide 4 then reacted with diphenyl phosphite followed by triethylamine to yield the triethylamine H-phosphonate salts (TEAHP) intermediate 5.30,31 This TEAHP intermediate upon treatment with choline in the presence of PivCl and pyridine followed by oxidation with I2 generated our desired compound 6. Compound 6 is the compound having almost identical molecular weight and formula that of SM but does not possess any alcoholic functionality like SM.
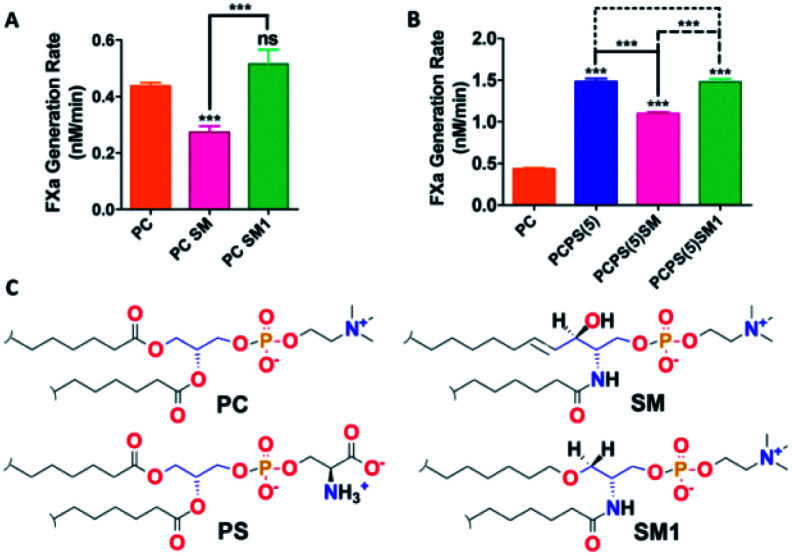
With this SM analog (compound 6) and native SM proteoliposomes (with recombinant TF) were prepared as mentioned in our earlier study.30 With these liposomes, we performed the FX activation assay. Interestingly we found that the SM analog failed to impart any inhibition in binary/ternary complex proteolytic activity and behave almost similar to PC both in the presence and absence of PS (Fig. 2). This result experimentally established our hypothesis that the free alcoholic group at C3 position of SM plays a vital role in inhibiting the proteolytic activity of blood coagulation initiation complexes.
Fig. 2. Influence of SM & SM analog (SM1) on the activity of coagulation factors. (A and B) TF–FVIIa activity by FXa generation chromogenic assay with the proteoliposomes containing different PL compositions including native SM or synthesized SM derivative compound 6 (SM1). Data presented here are as mean ± SEM (n ≥ 3). Differences are statistically significant at p < 0.05 by Student's t-test. (C) Chemical structure of PC, SM, PS and SM1.
Next, to obtain the mechanistic details at the molecular level we have adopted MD simulation approach. Wang et al.12 have already demonstrated experimentally that SM has the least influence on amidolytic activity of TF–FVIIa but on the other hand, we and others got a definite attenuation at the proteolytic activity of TF–FVIIa complex, so instead of restricting our study at the binary complex, we went a step ahead and prepared membrane-bound ternary complex of TF–FVIIa–FXa (methods for the build of the model is provided at ESI section†). We have prepared this ternary complex in two different lipids PCPS and SM surfaces separately and did MD simulation for 150 ns time periods.
Interestingly we found differential protein–lipid interaction profiles for the different lipid surfaces (Table 1). Results depict significant more interactions of the ternary complex with the PCPS surface compare to the SM surface. It has been well reported that interactions of Gla residues of FVIIa and FXa with lipids are crucial for showing the optimum activity of TF–FVIIa–FXa.32,33 Surprisingly we found FXa Gla residues hardly interact with the SM layer whereas the FVIIa Gla domain has a reduced number of interactions with SM surface than PCPS (Table S1†) and these reduced interactions may play a significant contribution in SM mediated ternary complex inhibition. Moreover, our MD data suggest that TF residues Tyr157, Trp158, Ser161, Ser162 can interact with the PCPS surface but failed to interact with the SM surface. These residues of TF have already been reported as the regulating residues in order to substrate interactions.34 So these differential interactions between TF and lipid might play a significant role in the inhibition of the ternary complex by SM.
Interacting residues of ternary complex (FVIIa–TF–FX) with PC, PC:PS (4 : 1) and SM lipid bilayer with a cut-off distance of 3.5 Å.
| Protein | PC | PC:PS (4 : 1) | SM |
|---|---|---|---|
| Tissue factor (TF) | Lys122, Ser161, Ser162, Ser163, Lys166, Arg218, His243, Arg246, Val250, Gly251, Gln252, Ser253, Lys247 | Gln118, Lys122, Tyr157, Trp158, Ser161, Ser162, Ser163, Lys166, Thr167, Lys169, Arg218, Lys244, Arg246, Val250, Gly251, Gln252, Ser253, Lys255 | Thr121, Lys122, Ser163, Lys166, Arg218, Lys247, Gln252, Ser253, Lys255 |
| Gla domain (FVIIa) | Asn2, Phe4, Leu5, Arg9, Ser12, Arg15, Arg28, Lys32 | Ala1, Asn2, Phe4, Leu5, Gla7, Gly11, Ala27, Arg28, Gla29, Asp33, Ala34, Gla35, Arg36, Thr37, Lys38 | Asn2, Ala3, Leu5, Gla6, Arg9, Ser12, Gla14, Arg15, Arg28 |
| Gla domain (FX) | Asn2, Ser3, Leu5, Lys9, Lys10, Arg15 | Ser3, Leu5, Gla6, Gla7, Lys9, Lys10, Gla29 | Leu5, Lys9, Lys10, Arg15 |
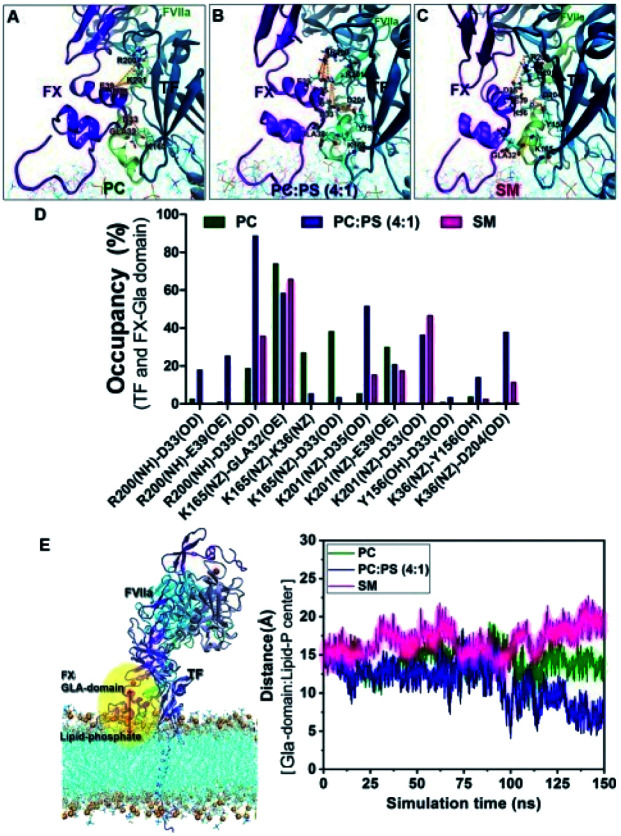
Protein–protein interactions also play a crucial role in regulating the optimal activity of the ternary complex. Interestingly we observed significantly more interactions between the FXa Gla domain with TF on the PCPS surface compare to the SM surface. These altered interaction profiles might be a cause for the altered activity of the ternary complex (Fig. 2) on different lipid surfaces.
Now to investigate the molecular reason behind less or no interaction of the Gla domain with SM, we analyzed our MD simulation data more intrinsically. It has been well established that the coagulation factors mainly interacts with the phospholipids (PL) through the interaction between Gla residues of protein and with the phosphate residues of the PL.35 Interestingly we found that on SM surface the distances between the centre of mass of the Gla domain of FX and the phosphate residue of the lipid always remain higher compared to either PC or PCPS surface (Fig. 3). This means that the Gla domain of FX remains less accessible to the phosphate group of SM compared to the PC or PCPS.
Fig. 3. Differential interactions on different lipid surfaces: interaction of FX with TF on (A) PC surface, (B) PCPS surface and (C) SM surface. (D) H bond occupancy plot (%) between the interacting residues of Gla domain (FX) and TF with a cut off distance of 3.5 Å. (E) Distance between Gla domain and phosphate residue of different lipids.
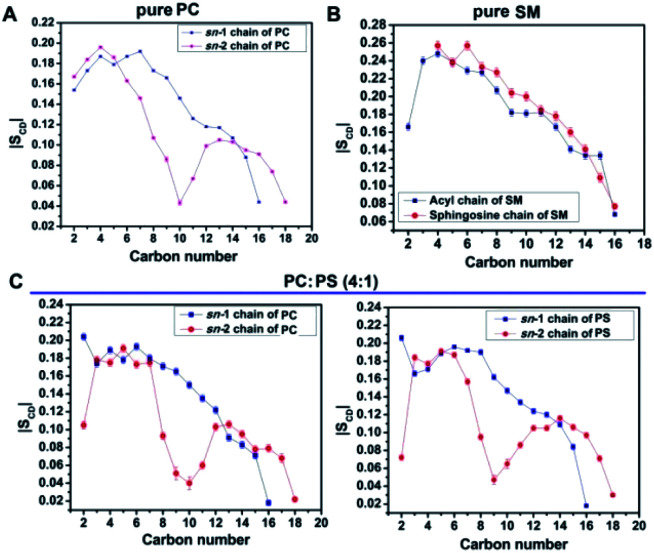
To further investigate the inaccessibility of the Gla domain to the phosphate moiety of the lipid, we found SM is a very closely packed system and that might restrict the Gla domain to penetrate through the head group and interact with the phosphate group of SM. We measured the order parameter of the two fatty acids chain in order to evaluate the compactness of the lipid assembly. If the order of the one chain deviates deviate than the other, implies the lipid is comparatively loosely compact on the other hand if the order of the two fatty acids chain remains close then it can be assumed that the lipid assembly is tightly packed. It is obvious from the order parameter profile in Fig. 4 that in SM the two fatty acid chains remain closely packed whereas either in PC or PCPS both the fatty acids chain remains relatively less ordered, which means in SM bilayer lipids form tight cluster compare to PC or PCPS bi-layer.
Fig. 4. Order parameter profile of bilayers, (A) sn-1 and sn-2 chains of PC, (B) sn-1 and sn-2 chains of PC:PS (4 : 1) and (C) acyl and sphingosine chains of SM.
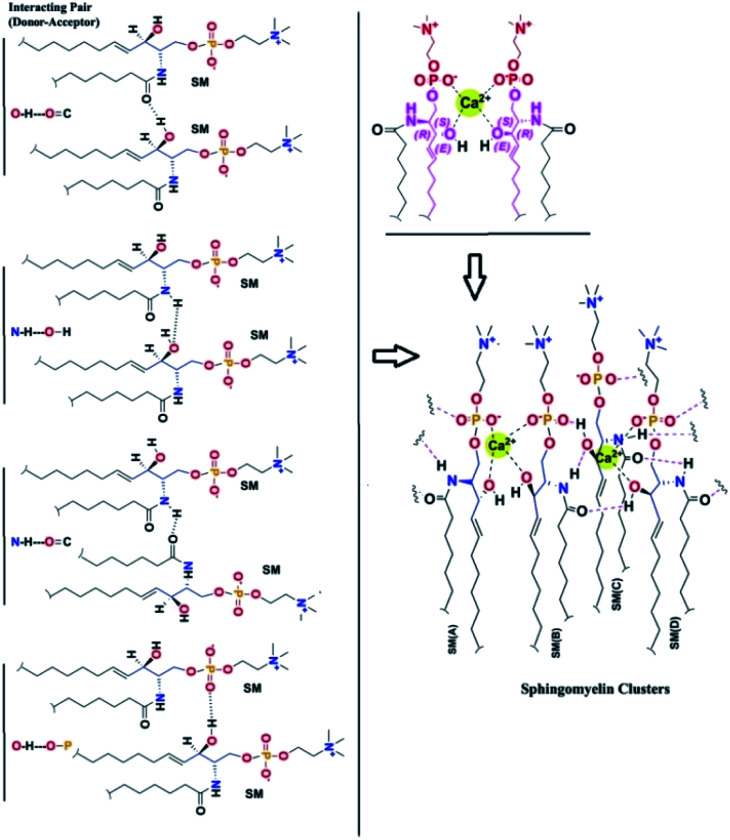
To find out the reason behind this close assembly of the SM bilayer36–39 we investigate the molecular interactions more intrinsically. We found two distinct reasons behind the close tight assembly of the SM. (i) One SM molecule can form several H bonds with the neighboring SM molecules (ii) one SM can interact with another SM through Ca2+ chelation as shown in Fig. 5.
Fig. 5. Different kind of intermolecular interactions of SM.
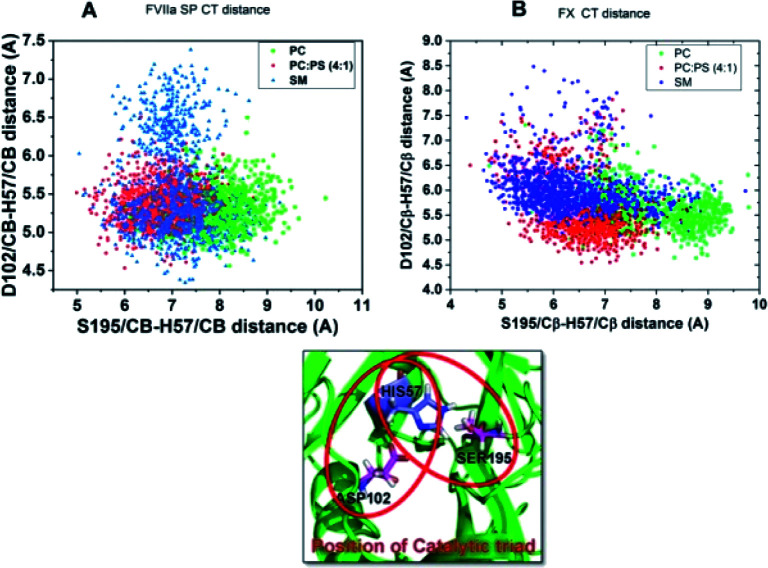
As both FVIIa and FX belong to the chymotrypsin family both of them have the key regulatory catalytic triad residues Ser–His–Asp at their protease domain.40–42 As catalytic triad (CT) stability of these proteases governs the protease activity, we measured the status of the CT of both the proteases in the TF–FVIIa–FXa complex at different lipid surfaces. We measured Ser to His distances at X-axis and Asp to His distance at Y-axis. Results suggest, both in FVIIa and FXa the distances remain more dispersed when the complex in on SM surface compare to either PC or PCPS. The dispersion of the CT residues implies that CT remains more fluctuating means more unstable conditions. So this result depicts that altered protein–lipid interactions allosterically regulate CT stability (Fig. 6).
Fig. 6. Catalytic triad distribution profile. (A) FVIIa catalytic triad distribution profile of FVIIa protease domain in ternary complex throughout the simulation period. (B) FX catalytic triad distribution profile in the ternary complex throughout the simulation period.
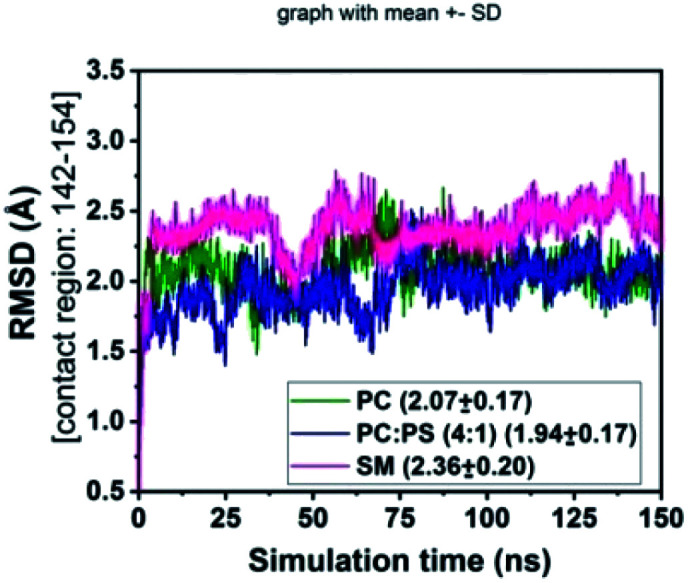
Residues 142–154 of FVIIa have been reported43,44 as the substrate (FX) recognition site of the binary complex, so we checked the stability of these residues of FVIIa in the binary complex on different lipid surfaces (Fig. 7) by measuring the RMSD of the above-mentioned residues. The greater fluctuation in the RMSD profile on the SM surface compare to PCPS and PC surface indicates that SM may inhibit the activity by allosterically regulates the substrate (FX) recognition site of FVIIa in the binary complex.
Fig. 7. RMSD of FVIIa contact residues 142–154 in the binary complex with FX.
4. Conclusions
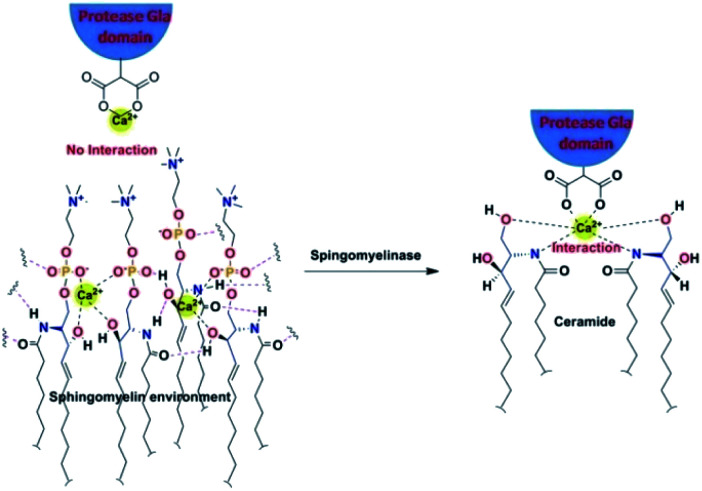
In conclusion through this report, we have tried to find out the mechanistic insight of how SM attenuates the activity of the blood coagulation complexes. To address this problem we have adopted biochemical as well as MD simulation approach. Biochemically we have established that in SM additional OH group at the C3 position of the ceramide moiety is responsible for the inhibition of the blood coagulation complexes. Through our MD study, we have shown that due to the presence of this above mentioned OH group SM gets more tightly packed than other lipid surfaces (PC and PCPS). The rationale behind this tight assembly is several inter-molecular bonding between the SM molecules either through H bond or through Ca2+ chelation. Because of this close assembly, the interacting Gla domains of coagulation factors hinder interacting with the SM phosphate moiety. These altered lipid–protein interactions influence protein–protein interactions and allosterically destabilizes the protease domain as well as the substrate contact sites, which could be the possibility for the inhibition of the coagulation complex on the SM surface. In case of cell surface when we have treated with SMase all the head groups of surface SM cleaves and SM converts to ceramide which fails to form close assembly because, without head and phosphate group, only the ceramide group does not support the intermolecular H bonding and Ca2+ chelation. That's why the treatment of SMase allows the lipid interacting Gla domain to properly interact with lipids by disrupting the hindering SM moieties (Fig. 8).
Fig. 8. Disruption of tight SM assembly on the cell surface due to SMase treatment.
Author contributions
P. S. designed research; S. M., R. P. and K. D. performed research and analyzed data; P. S., R. P. and S. M. wrote the manuscript.
Conflicts of interest
There are no conflicts to declare.
Supplementary Material
Electronic supplementary information (ESI) available: Supplementary figures and table, 1H, 13C and 31P NMR spectra of all new compounds and the experimental procedures for their preparation. See DOI: 10.1039/d0ra09218e
Notes and references
- Davie E. W. Fujikawa K. Kisiel W. Biochemistry. 1991;30:10363–10370. doi: 10.1021/bi00107a001. [DOI] [PubMed] [Google Scholar]
- Mann K. G. Krishnaswamy S. Lawson J. H. Semin. Hematol. 1992;29:213–226. [PubMed] [Google Scholar]
- Esmon C. T. Annu. Rev. Cell Biol. 1993;9:1–26. doi: 10.1146/annurev.cb.09.110193.000245. [DOI] [PubMed] [Google Scholar]
- Braunwald E. Califf R. M. Cannon C. P. Fox K. A. Fuster V. Gibler W. B. Harrington R. A. King S. B. Kleiman N. S. Theroux P. Topol E. J. Van de Werf F. White H. D. Willerson J. T. Am. J. Med. 2000;108:41–53. doi: 10.1016/S0002-9343(99)00416-7. [DOI] [PubMed] [Google Scholar]
- Murray C. J. Lopez A. D. Lancet. 1997;349:1269–1276. doi: 10.1016/S0140-6736(96)07493-4. [DOI] [PubMed] [Google Scholar]
- Franchini M. Montagnana M. Targher G. Manzato F. Lippi G. J. Thromb. Thrombolysis. 2007;24:29–38. doi: 10.1007/s11239-007-0028-6. [DOI] [PubMed] [Google Scholar]
- Zwaal R. F. A. Comfurius P. Bevers E. M. Cell. Mol. Life Sci. 2005;62:971–988. doi: 10.1007/s00018-005-4527-3. [DOI] [PubMed] [Google Scholar]
- Gerads I. Govers-Riemslag J. W. P. Tans G. Zwaal R. F. A. Rosing J. Biochemistry. 1990;29:7967–7974. doi: 10.1021/bi00486a027. [DOI] [PubMed] [Google Scholar]
- Ansari S. A. Pendurthi U. R. Sen P. Rao L. V. M. PLoS One. 2016;11:e0158377. doi: 10.1371/journal.pone.0158377. [DOI] [PMC free article] [PubMed] [Google Scholar]
- Shaw A. W. Pureza V. S. Sligar S. G. Morrissey J. H. J. Biol. Chem. 2007;282:6556–6563. doi: 10.1074/jbc.M607973200. [DOI] [PubMed] [Google Scholar]
- Deguchi H. Yegneswaran S. Griffin J. H. J. Biol. Chem. 2004;279:12036–12042. doi: 10.1074/jbc.M302531200. [DOI] [PubMed] [Google Scholar]
- Wang J. Pendurthi U. R. Rao L. V. M. Blood Adv. 2017;1:849–862. doi: 10.1182/bloodadvances.2016003947. [DOI] [PMC free article] [PubMed] [Google Scholar]
- Mallik S. Prasad R. Bhattacharya A. Sen P. ACS Med. Chem. Lett. 2018;9:434–439. doi: 10.1021/acsmedchemlett.8b00008. [DOI] [PMC free article] [PubMed] [Google Scholar]
- Pike A. C. Brzozowski A. M. Roberts S. M. Olsen O. H. Persson E. Proc. Natl. Acad. Sci. U. S. A. 1999;96:8925–8930. doi: 10.1073/pnas.96.16.8925. [DOI] [PMC free article] [PubMed] [Google Scholar]
- Murakami M. T. Rios-Steiner J. Weaver S. E. Tulinsky A. Geiger J. H. Arni R. K. J. Mol. Biol. 2007;366:602–610. doi: 10.1016/j.jmb.2006.11.040. [DOI] [PubMed] [Google Scholar]
- Harlos K. Martin D. M. O'Brien D. P. Jones E. Y. Stuart D. I. Polikarpov I. Miller A. Tuddenham E. G. Boys C. W. Nature. 1994;370:662–666. doi: 10.1038/370662a0. [DOI] [PubMed] [Google Scholar]
- Muller Y. A. Ultsch M. H. de Vos A. M. J. Mol. Biol. 1996;256:144–159. doi: 10.1006/jmbi.1996.0073. [DOI] [PubMed] [Google Scholar]
- Altschul S. F. Gish W. Miller W. Myers E. W. Lipman D. J. J. Mol. Biol. 1990;215:403–410. doi: 10.1016/S0022-2836(05)80360-2. [DOI] [PubMed] [Google Scholar]
- Sen M. Herzik Jr M. Craft Jr J. W. Creath A. L. Agrawal S. Ruf W. Legge G. B. Open Spectrosc. J. 2009;3:58–64. doi: 10.2174/1874383800903010058. [DOI] [PMC free article] [PubMed] [Google Scholar]
- Brooks B. R. Bruccoleri R. E. Olafson B. D. States D. J. Swaminathan S. Karplus M. J. Comput. Chem. 1983;4:187–217. doi: 10.1002/jcc.540040211. [DOI] [Google Scholar]
- MacKerell A. D. Bashford D. Bellott M. Dunbrack R. L. Evanseck J. D. Field M. J. Fischer S. Gao J. Guo H. Ha S. Joseph-McCarthy D. Kuchnir L. Kuczera K. Lau F. T. K. Mattos C. Michnick S. Ngo T. Nguyen D. T. Prodhom B. Reiher W. E. Roux B. Schlenkrich M. Smith J. C. Stote R. Straub J. Watanabe M. Wiórkiewicz-Kuczera J. Yin D. Karplus M. J. Phys. Chem. B. 1998;102:3586–3616. doi: 10.1021/jp973084f. [DOI] [PubMed] [Google Scholar]
- Jorgensen W. L. Chandrasekhar J. Madura J. D. Impey R. W. Klein M. L. J. Chem. Phys. 1983;79:926. doi: 10.1063/1.445869. [DOI] [Google Scholar]
- Feller S. E. Zhang Y. Pastor R. W. Brooks B. R. J. Chem. Phys. 1995;103:4613–4621. doi: 10.1063/1.470648. [DOI] [Google Scholar]
- Martyna G. J. Tobias D. J. Klein M. L. J. Chem. Phys. 1994;101:4177–4189. doi: 10.1063/1.467468. [DOI] [Google Scholar]
- Pike A. C. W. Brzozowski A. M. Roberts S. M. Olsen O. H. Persson E. Proc. Natl. Acad. Sci. U. S. A. 1999;96:8925–8930. doi: 10.1073/pnas.96.16.8925. [DOI] [PMC free article] [PubMed] [Google Scholar]
- Prasad R. Sen P. Phys. Chem. Chem. Phys. 2017;19:22230–22242. doi: 10.1039/C7CP02179H. [DOI] [PubMed] [Google Scholar]
- Prasad R. Sen P. J. Biomol. Struct. Dyn. 2018;36:621–633. doi: 10.1080/07391102.2017.1289125. [DOI] [PubMed] [Google Scholar]
- Neuenschwander P. F. Bianco-Fisher E. Rezaie A. R. Morrissey J. H. Biochemistry. 1995;34:13988–13993. doi: 10.1021/bi00043a004. [DOI] [PubMed] [Google Scholar]
- Harayama T. Riezman H. Nat. Rev. Mol. Cell Biol. 2018;19:281–296. doi: 10.1038/nrm.2017.138. [DOI] [PubMed] [Google Scholar]
- Mallik S. Prasad R. Bhattacharya A. Sen P. ACS Med. Chem. Lett. 2018;9:434–439. doi: 10.1021/acsmedchemlett.8b00008. [DOI] [PMC free article] [PubMed] [Google Scholar]
- Lindh I. Stawinski J. J. Org. Chem. 1989;54:1338–1342. doi: 10.1021/jo00267a020. [DOI] [Google Scholar]
- Muller M. P. Wang Y. Morrissey J. H. Tajkhorshid E. J. Thromb. Haemostasis. 2017;15:2005. doi: 10.1111/jth.13788. [DOI] [PMC free article] [PubMed] [Google Scholar]
- Morrissey J. H. Tajkhorshid E. Sligar S. G. Rienstra C. M. Thromb. Res. 2012;129:S8–S10. doi: 10.1016/j.thromres.2012.02.019. [DOI] [PMC free article] [PubMed] [Google Scholar]
- Ndonwi M. Broze G. J. Agah S. Schmidt A. E. Bajaj S. P. J. Biol. Chem. 2007;282:15632–15644. doi: 10.1074/jbc.M701908200. [DOI] [PubMed] [Google Scholar]
- Tavoosi N. Davis-Harrison R. L. Pogorelov T. V. Ohkubo Y. Z. Arcario M. J. Clay M. C. Rienstra C. M. Tajkhorshid E. Morrissey J. H. J. Biol. Chem. 2011;286:23247–23253. doi: 10.1074/jbc.M111.251769. [DOI] [PMC free article] [PubMed] [Google Scholar]
- Mombelli E. Morris R. Taylor W. Fraternali F. Biophys. J. 2003;84:1507–1517. doi: 10.1016/S0006-3495(03)74963-7. [DOI] [PMC free article] [PubMed] [Google Scholar]
- Slotte J. P. Biochim. Biophys. Acta, Biomembr. 2016;1858:304–310. doi: 10.1016/j.bbamem.2015.12.008. [DOI] [PubMed] [Google Scholar]
- Yasuda T. Al Sazzad M. A. Jäntti N. Z. Pentikäinen O. T. Slotte J. P. Biophys. J. 2016;110:431–440. doi: 10.1016/j.bpj.2015.11.3515. [DOI] [PMC free article] [PubMed] [Google Scholar]
- de la Arada I. González-Ramírez E. J. Alonso A. Goñi F. M. Arrondo J. L. R. Sci. Rep. doi: 10.1038/s41598-020-74781-8. [DOI] [PMC free article] [PubMed] [Google Scholar]
- Gajsiewicz J. H. Morrissey J. M. Semin. Thromb. Hemostasis. 2015;41:682–690. doi: 10.1055/s-0035-1564044. [DOI] [PMC free article] [PubMed] [Google Scholar]
- Venkateswarlu D. Perera L. Darden T. Pedersen L. G. Biophys. J. 2002;82:1190–1206. doi: 10.1016/S0006-3495(02)75476-3. [DOI] [PMC free article] [PubMed] [Google Scholar]
- Prasad R. Sen P. J. Biomol. Struct. Dyn. 2018;36:621–633. doi: 10.1080/07391102.2017.1289125. [DOI] [PubMed] [Google Scholar]
- Norledge B. V. Petrovan R. J. Ruf W. Olson A. J. Proteins: Struct., Funct., Genet. 2003;53:640–648. doi: 10.1002/prot.10445. [DOI] [PubMed] [Google Scholar]
- Vadivel K. Bajaj S. P. Front. Biosci. 2012;17:2476. doi: 10.2741/4066. [DOI] [PMC free article] [PubMed] [Google Scholar]
Associated Data
This section collects any data citations, data availability statements, or supplementary materials included in this article.


