Abstract
Ru(ii) complexes have attracted increasing attention as promising antitumor agents for their relatively low toxicity, high affinity to DNA molecules, and correlation with multiple targets. Meanwhile, quinolones are synthetic antibacterial agents widely used in the clinical practice. In this paper, two novel Ru(ii) complexes coordinated by levofloxacin (LOFLX), [Ru(bpy)2(LOFLX)]·2ClO4 (1), and [Ru(dmbpy)2(LOFLX)]·2ClO4 (2) (bpy = 2,2′-bipyridine, dmbpy = 4,4′-dimethyl-2,2′-bipyridine) were synthesized with high efficiency under microwave irradiation and characterized by ESI-MS, 1H NMR, and 13C NMR. The binding behavior of these complexes with double-strand calf thymus DNA(CT-DNA) was investigated using spectroscopy, molecular docking, and density functional theory calculations. Results showed that 2 exhibited higher binding affinity than 1 and LOFLX. Further studies showed that 2 could induce the G2/M phase arrest of A549 cells via DNA damage. In summary, these results indicated that 2 could be developed as a potential anticancer agent in treatment of lung cancer through the induction of cell cycle arrest at G2/M phase by triggering DNA damage.
This study showed that levofloxacin-based ruthenium(ii) complex 2 effectively inhibited the growth of A549 cells by inducing G2/M phase arrest through triggering DNA damage.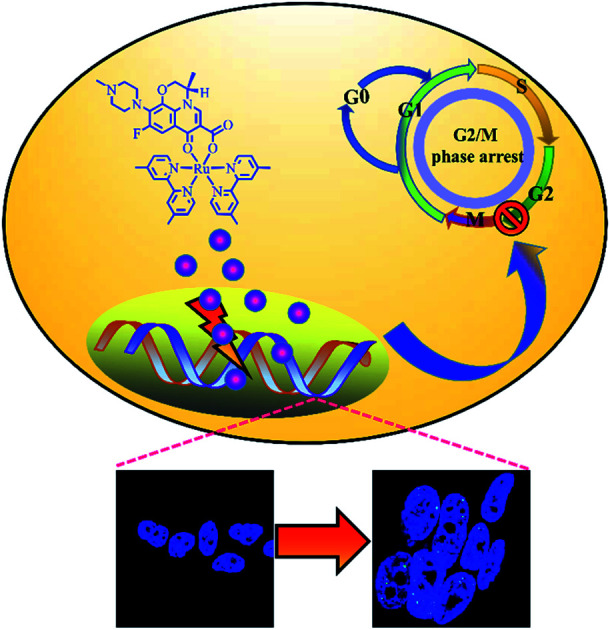
1. Introduction
Cancer had been the single most important barrier to prolonging life expectancy in humans; it had ranked as the leading cause of human death in the 21st century. Statistics showed 18.1 million new patients with cancer around the world in 2018.1 Cancer has evolved into a growing concern in research and clinical practice. Nowadays, chemotherapy is still the commonly used treatment for cancers in clinical practice.2,3 Lung cancer had been one of the most frequently diagnosed cancers, and it had been the leading cause of cancer-related death worldwide. It had accounted for 1.69 million deaths in 2015 and approximately 19% of the total cancer death toll according to the World Health Organization. In the United States, the American Cancer Society estimated 222 500 new cases of lung cancer were diagnosed in 2017, with an estimated mortality of 70% (155 870 deaths) among both sexes. The three main subtypes of non-small cell lung cancer are adenocarcinoma, squamous cell carcinoma, and large cell lung cancer, with adenocarcinoma accounting for 40% of these subtypes. It had been more common in women and non-smokers. Lung adenocarcinoma started in glandular cells, which secrete substances, such as mucus, and tended to develop in smaller airways, such as alveoli. At present, surgery, radiation therapy, chemotherapy, and targeted therapies are used for the treatment of lung adenocarcinoma.
The application of metal-based drugs in cancer therapy rooted in 1965, when Rosenberg and his colleagues accidentally discovered that cisplatin [cis-diamminedichloro platinum(ii)] possessed biological activity.4 Henceforth, platinum-based drugs, such as carboplatin, cisplatin, and oxaliplatin, had been largely applied to the treatment of human neoplasms.5 However, because of their severe side effects and resistance to the treatment, the use of these drugs had major limitations.6 Consequently, massive efforts had been made to develop novel nonplatinum-containing metal complexes.7–9 In the last decades, Ru(ii) compounds had been widely regarded as promising anticancer agents.10–12 They had attracted increasing attention from researchers around the world due to their possibilities of applying different types of mono and bidentate ligands, DNA binding properties, association with various target action, and low toxicity.13,14 Previous research suggested that polypyridyl–Ru(ii) complexes exert great inhibitory effect on the growth of MDA-MB-231 cells by inducing apoptosis through binding and disturbing the function of DNA molecules.15 In the last decades, various Ru(ii) complexes had been designed and investigated as potential anticancer candidatures.16–21 Quinolones, which were synthetic antibacterial agents, had been widely used in clinical practice. As one of quinoline derivatives, they could be applied as ligands on the synthesis of various metal complexes.22,23 The fluoroquinolone ofloxacin with its anionic form, which was a second-generation antibacterial agent, had been used as a bidentate O,O′-ligand to synthesize multifarious metal complexes.24 A previous study of the authors reported that Ru(ii)–ofloxacin complexes with different bipyridine ligands exhibited promising binding affinity to DNA molecules and disturbed the biofunction of DNA.25 Thus, revealing the antitumor activity of Ru(ii) complexes coordinated with levofloxacin was considerable for the clinical development of new anticancer drugs.
In the present study, two novel levofloxacin-based Ru(ii) complexes (Scheme 1) were prepared with high productivity rate via microwave-assisted heating technology. The antitumor activity in vitro of [Ru(bpy)2(LOFLX)]·2ClO4 (1), [Ru(dmbpy)2(LOFLX)]·2ClO4 (2), and LOFLX was evaluated via MTT. Their interactions with DNA were investigated using electron absorption spectroscopy, fluorescence spectral titration, and viscosity assay. Moreover, cell cycle arrest and DNA damage were studied via flow cytometry and immunofluorescence analysis, respectively.
Scheme 1. Microwave-assisted synthesis route of complexes 1 and 2.
2. Experimental
Ru(iii) chloride hydrate, 4,4′-dimethyl-2,2′-bipyridine, 2,2′-bipyridine, and levofloxacin were obtained from Aladdin. N,N-Dimethylformamide, ethanol, acetonitrile, and lithium anhydrous were obtained from Tianjin Damao Chemical Reagent Factory. Calf thymus DNA (CT-DNA) was purchased from Sigma. Human lung adenocarcinoma cells (A549, SPC-A-1), human liver carcinoma cells (HepG2), human breast cancer cells (MDA-MB-231, MCF-7), human esophageal cancer cells (EC-1) and human keratinocyte cells (HaCaT) and human normal lung epithelial cells (Beas-2B) were obtained from ATCC (USA). Tris–HCl buffer (50 mM NaCl, 5 mM Tris–HCl, pH 7.2) was used for electron absorption spectroscopy, fluorescence titration spectroscopy, and viscosity studies. Cis-Ru(dmbpy)2Cl2 and cis-Ru(bpy)2Cl2 were synthesized in accordance with the procedures from the literature, with some modifications.26,27
Chemical reactions were produced using a professional microwave reactor (Anton Paar monowave 300). 1H NMR and 13C NMR spectra were tested in DMSO-d6 on a nuclear magnetic resonance spectrometer (Bruker DRX 2500). Electrospray ionization mass spectrometry (ESI-MS) spectra were measured using an Agilent 1100 ESI-MS system. Fluorescence and electron absorption spectra were detected on a fluorescence spectrophotometer (Shimadzu RF-5301) and on a spectrophotometer (Shimadzu UV-2550), respectively. MTT assay was carried out on a Multiskan GO microplate reader. Confocal cell imaging experiments were performed on a Zeiss 880 laser scanning confocal microscope. The CHN analysis were detected by using elemental analyzer (Elementar vario MICRO cube). The IR spectra of sample (1 mg) in KBr (100 mg) were recorded by using Fourier transform infrared spectrometer (Perkin Elmer Spectrum 100). The pyrolysis characteristics of two complexes were studied in the atmosphere of nitrogen by thermogravimetric analysis by using simultaneous thermal analyzer (Mettler TGA/DSC3+). The lipophilicity (log P) of two complexes were calculated by the concentration distribution ratio in water saturated N-octyl alcohol and N-octyl alcohol saturated water and repeated it three times through using ultraviolet spectrophotometer (Shimadzu UV-2550).
2.1. Synthesis of (1)
Complex 1 was prepared in accordance with the procedures previously reported, with some modifications.28,29 A mixture of cis-[Ru(bpy)2Cl2] (260.0 mg, 0.5 mmol), sodium methoxide (54.02 mg, 1.0 mmol), and levofloxacin (277.8 mg, 0.75 mmol) in 20 mL ethanol was irradiated by microwaves for 30 min at 100 °C. Subsequently, the pH value of the reaction mixture was adjusted to 7.0 using diluted hydrochloric acid. Crude products were obtained after filtration and rotary evaporation and further purified via neutral alumina column chromatography. Yield: 63.6%. The ESI-MS values (in MeOH, m/z) calculated for 1 were 387.4 1/2([M–Cl− + H+]2+) and 773.8 ([M–Cl−]+). Found: 387.1 1/2([M–Cl− + H+]2+), 774.0 ([M–Cl−]+). Calculated for C49H49Cl2FN9O12Ru (%): C 51.31, H 4.31, N 10.99; found (%): C 50.86, H 4.12, N 10.82. (One molecule containing 2ClO4−, 1CH3C6H5, 2CH3CN). IR (in KBr, νmax/cm−1): 3409, 2924, 2838, 2794, 1619, 1571, 1516, 1467, 1267, 1127, 1045, 975, 766 and 727 cm−1. 1H NMR (600 MHz, DMSO-d6) δ 9.03 (d, J = 5.3 Hz, 1H), 8.98 (dd, J = 22.3, 5.4 Hz, 1H), 8.86–8.75 (m, 2H), 8.74–8.56 (m, 3H), 8.28–8.04 (m, 2H), 7.98–7.84 (m, 2H), 7.83–7.74 (m, 2H), 7.74–7.62 (m, 2H), 7.35–7.29 (m, 1H), 7.27 (dd, J = 7.3, 6.0 Hz, 1H), 7.00 (dd, J = 12.5, 2.7 Hz, 1H), 4.86 (d, J = 6.6 Hz, 1H), 4.61–4.43 (m, 1H), 4.41–4.22 (m, 1H), 2.54–2.47 (m, 3H), 2.39 (s, 4H), 2.21 (d, J = 16.7 Hz, 3H). 13C NMR (151 MHz, DMSO-d6) δ 176.48, 165.57, 160.01, 159.80, 158.41–158.22, 158.19, 156.97, 155.34, 153.72, 153.36, 150.93, 150.81, 150.71, 150.48, 149.37, 140.63, 136.82, 136.54, 135.17, 131.50, 127.10, 126.37, 126.13, 124.85–123.56, 123.33, 121.84, 120.43–118.24, 112.58, 112.48, 103.25, 68.57, 55.69, 55.13, 50.49, 46.51.
2.2. Synthesis of (2)
The preparation of complex 2 was similar to that described for complex 1, with cis-[Ru(dmbpy)2Cl2] in place of cis-[Ru(bpy)2Cl2]. The yield was 65.8%. The ESI-MS (in MeOH, m/z) calculated for 2 were 415.5 1/2([M–Cl− + H+]2+) and 829.9 ([M–Cl−]+). Found: 415.1 1/2([M–Cl− + H+]2+), 829.4 ([M–Cl−]+). Calculated for C53H57Cl2FN9O12Ru (%): C 52.91, H 4.78, N 10.48; found (%): C 52.24, H 4.83, N 9.97. (One molecule containing 2ClO4−, 1CH3C6H5, 2CH3CN). IR (in KBr, νmax/cm−1): 3407, 2916, 2842, 2797, 1615, 1571, 1514, 1471, 1267, 1123, 1049, 997 and 827 cm−1. 1H NMR (600 MHz, DMSO-d6) δ 9.02 (d, J = 6.7 Hz, 1H), 8.78 (dt, J = 23.0, 11.5 Hz, 1H), 8.64 (d, J = 6.9 Hz, 2H), 8.53 (d, J = 17.8 Hz, 2H), 7.65–7.55 (m, 2H), 7.48 (dd, J = 11.8, 5.8 Hz, 2H), 7.10 (dd, J = 32.9, 5.5 Hz, 2H), 6.99 (t, J = 16.4 Hz, 1H), 4.97–4.77 (m, 1H), 4.55 (dd, J = 34.8, 11.4 Hz, 1H), 4.34 (dd, J = 35.3, 19.2 Hz, 1H), 2.62–2.54 (m, 6H), 2.50 (d, J = 13.2 Hz, 3H), 2.46 (s, 3H), 2.40 (d, J = 10.5 Hz, 6H), 2.20 (s, 3H). 13C NMR (151 MHz, DMSO-d6) δ 174.43, 163.52, 157.50, 157.24, 155.88, 155.82, 155.76, 154.84, 153.21, 150.68, 150.24, 148.07, 147.94, 147.82, 147.62, 147.15, 147.05, 145.91, 145.60, 144.23, 138.52, 131.47–128.82, 125.72, 125.07, 124.74, 122.52, 122.30, 121.12, 119.84, 116.42, 110.69, 110.58, 101.80–100.90, 66.42, 54.35, 53.56, 52.94, 52.86, 48.34, 44.39, 19.10.
2.3. DNA-binding studies
The binding affinity of these compounds with DNA was determined by the changes in the electron absorption of these compounds (3 μM) on increasing the CT-DNA concentration (0–100 μM). The intrinsic binding constant Kb of compound with CT-DNA was calculated from the spectroscopic titration data by using eqn (1):30,31
| [DNA]/(εa − εf) = [DNA]/(εb − εf) + 1/Kb(εb − εf) | 1 |
where [DNA] was the CT-DNA concentration; εa was the apparent absorption coefficient (Aobsd/[Compound]) observed for the intra-ligand (IL) absorption peak at a given DNA concentration; and εb and εf were the extinction coefficients for the compound in fully bound form and the extinction coefficient for the free compound in the solution, respectively. In the plots of [DNA]/(εa – εf) versus [DNA], Kb was obtained from the ratio of slope to intercept.
The interaction between these compounds and DNA double helix was also studied using emission spectra. Fluorescence spectra were investigated in Tris–HCl buffer by keeping the compound concentration constant (20 μM) with the addition of CT-DNA at room temperature. The solutions were mixed thoroughly for 5 min before the emission spectra were recorded.
2.4. Molecular docking
The molecules were optimized using the Amsterdam Density Functional (ADF) 2019.104 suite program with the generalized gradient approximation (GGA): BP86 level of theory and the Mopac method,32 and the optimized structure of LOFLX, 1, and 2 were used to create the initial PDB structures by using the Mercury software. The interaction properties, including binding mode, energy, and the site of the studied compound with different G4 DNAs, were calculated using AutoDock4.2 via the Lamarckian genetic algorithm local search method. The theoretical calculation sequences of the double-stranded DNA (PDB ID: 1QC1) were obtained from the Protein Data Bank. The calculated area of the grid box was centered at 1.000 for 126 × 126 × 126 points and on all nucleotide sequences. Ten individual calculation results had a binding energy greater than 2.5 × 10⁷ kcal mol−1. The binding conformation with most potential was confirmed by the minimum binding energy in most cluster members.
2.5. Theoretical calculation
Density Functional Theory (DFT) calculations were performed on Amsterdam Density Functional (ADF) 2019 package exploiting Slater-type orbital expansion33 as opposed to Gaussian-type orbital expansion from the Gaussian09 suite. The local density approximation (LDA) exchange-and-correlation (XC) energy functional parameterized by Vosko et al. and the GGA XC energy functional parameterized by Becke-Ernzehoff (GGA-BP86) were used with the polarized triple-ζ basis set (i.e., LDA/TZP and GGA-BP86/TZP, respectively). These basis sets included three Slater functions for each orbital. Relativistic effects were accounted for by simulations within the ZORA Hamiltonian. The ADF calculations employed systems in a gaseous phase. All DFT calculations were conducted for entire molecules with all ligands treated explicitly.
2.6. Anti-tumor activity evaluation
A549 lung cancer cells were cultured using Dulbecco's Modified Eagle Medium, fetal bovine serum (BSA; 10%, HyClone), streptomycin (50 units per mL), and penicillin (100 units per mL) in a humidified atmosphere containing 5% CO2 at 37 °C. The cells were seeded into 96-well plates, cultured for 24 h, and treated with different concentrations of the tested agents for 72 h. The A549 cell line was exposed to the test compound at various concentrations of 2 (0, 1.563, 3.125, 6.25, 12.5, 25, 50, and 100 μM) at 37 °C for 48 h. After incubation was conducted, 20 μL of MTT (5 mg mL−1 in PBS) was added to each well, and incubation was continued for 4 h at 37 °C. The medium was removed, and 150 μM of DMSO per well was added. The absorbance of formed formazan was detected using a microplate marker (Thermo, Multiskan GO) at 570 nm.
2.7. Flow cytometric analysis
The changes in cell cycle distribution and cell apoptosis ratio were investigated via flow cytometry.34 Tumor cells (5 × 10⁴ cells per well) were seeded in a six-well plate and then treated with different concentrations (0, 10, 20, and 40 μM) of complex 2 for 72 h. Then, the tumor cells were harvested, fixed, and stained with propidium iodide (PI) for 15 min in the dark. The cell cycle was then tested using an Epics XL-MCL flow cytometer. For apoptosis analysis, A549 cells were harvested and treated with Annexin V-FITC and PI in the dark for 15 min. Subsequently, the percentage of apoptotic cells was determined using an Epics XL-MCL flow cytometer.
2.8. Immunofluorescence
Tumor cells were incubated with complex 2 at different concentrations (0, 10, 20, and 40 μM) for 72 h and then fixed in 4% formaldehyde on ice for 30 min. Subsequently, the fixed cells were permeabilized, blocked, and probed with primary antibody. Finally, the cells were immunoblotted with secondary antibody and then with DAPI for 15 min at 37 °C.
3. Results and discussion
3.1. Synthesis and characterization
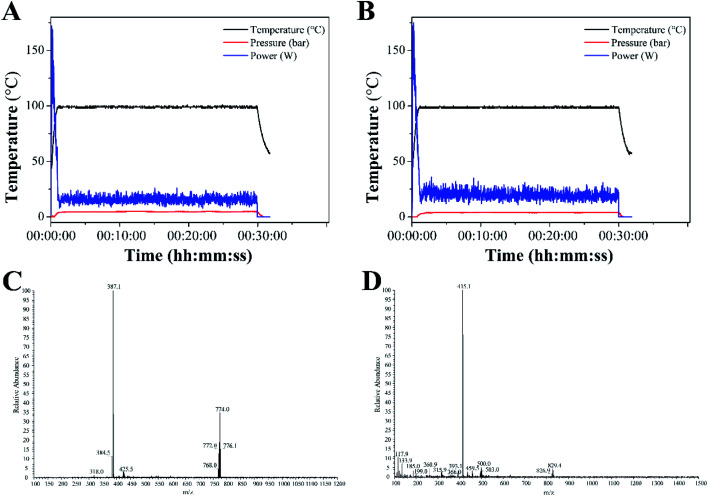
Complexes 1 and 2 were synthesized from cis-[Ru(bpy)2Cl2] or cis-[Ru(dmbpy)2Cl2] and levofloxacin in ethanol at 100 °C microwave for 30 min. The reaction temperature was quickly raised to 100 °C within 2 min under microwave irradiation, and almost no change was noted throughout the reaction process (Fig. 1A and B). The yields of complexes 1 and 2 under microwave irradiation were approximately 63.6% and 65.8%, respectively.
Fig. 1. Temperature profile for the synthesis of complexes 1 (A) and 2 (B) under microwave irradiation. ESI-MS spectra of complexes 1 (C) and 2 (D).
The ESI-MS spectra of complex 1 displayed molecular ion peaks of m/z = 387.1 and 774.0, which were ascribed to 1/2[M–Cl− + H+]2+ (387.4) and [M–Cl−]+ (773.8), respectively (Fig. 1C). As for complex 2, the molecular ion peaks at m/z = 415.1 and 829.4 were attributed to 1/2[M–Cl− + H+]2+ (415.5) and [M–Cl−]+, respectively (Fig. 1D). The 1H NMR spectra of complexes 1 and 2 were displayed in Fig. S1 and S3.† The peaks of levofloxacin in the two complexes appeared between 1.5 and 5.2 ppm with the same signal, which was consistent with the similar structure of ofloxacin-coordinated Ru(ii) complexes. The typical signals of 4,4′-dimethyl-2,2′-bipyridine and 2,2′-bipyridine appeared between 6.5 and 9.5 ppm, with some differences in the two complexes, which was consistent with the Ru(ii) complexes with norfloxacin35. The 13C NMR spectrum of 4,4′-dimethyl-2,2′-bipyridine and 2,2′-bipyridine in both complexes appeared between 110 and 160 ppm, while the methyl groups of 4,4′-dimethyl-2,2′-bipyridine appeared at 19.10 ppm (Fig. S2 and S4†).
3.2. Electron absorption spectra
DNA had been regarded as a potentially important molecular target for many Ru(ii) complexes to suppress the proliferation of tumor cells.36 Studying the interaction between Ru(ii) complexes and DNA may be conducive to elucidate their underlying anti-tumor mechanisms.37 Therefore, investigating the binding of Ru(ii) complexes with CT-DNA through electron absorption spectra, luminescence spectra, and viscosity measurements was very important.
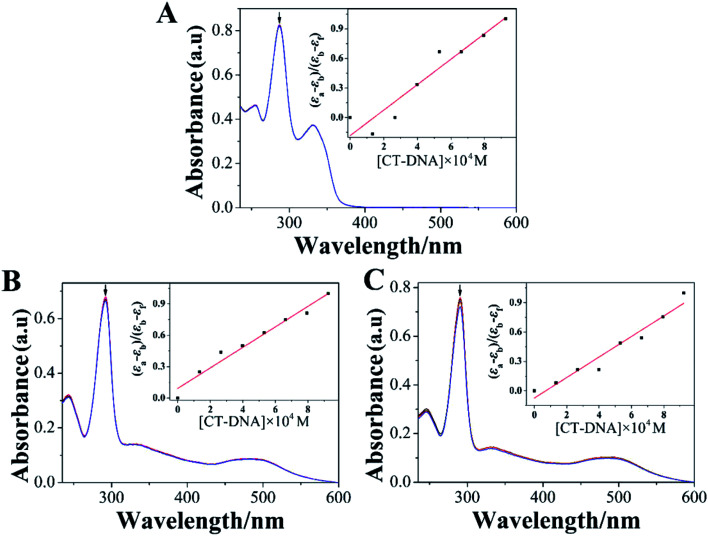
Electron absorption spectrum had been one of the most effective approaches for studying the interaction between metal complexes and DNA.38 When the metal complex bound to DNA, the electron absorption spectrum of the metal complex showed varying degrees of hypochromism and red shift.39 The electron absorption spectra of LOFLX, 1, and 2 in the absence and presence of CT-DNA were displayed in Fig. 2.
Fig. 2. absorption spectroscopy of LOFLX (A), 1 (B) and 2 (C) in Tris–HCl buffer (pH 7.2) in the absence and presence of CT-DNA. Arrow refers to the absorption intensity change upon the addition of increasing amounts of CT-DNA. ([Compound] = 3 μM, [DNA] = 1 mM).
The electron spectra of LOFLX, 1, and 2 in Tris–HCl buffer (50 mM NaCl, 5 mM Tris–HCl, pH 7.2) exhibited typical intra-ligand (IL) transitions in the 350–500 nm region, which was attributed to the internal π–π* transition of the ligand. In addition, the electron absorption spectra of 1 and 2 showed characteristic transitions of metal-to-ligand charge transfer absorption bands at 250–300 nm assigned to the overlap of Ru(dπ) → LOFLX (π*) and Ru(dπ) → dmbpy or bpy (π*).
As shown in Fig. 2, LOFLX, 1, and 2 did not show a red-shift phenomenon at the IL transitions in the presence of CT-DNA. However, the IL transitions of LOFLX, 1, and 2 showed hypochromism of approximately 0.7%, 2.4%, and 4.9% upon the addition of CT-DNA, respectively. The Kb of LOFLX, 1, and 2 was obtained by monitoring the changes at the IL bands with increasing concentration of CT-DNA to further quantitatively evaluate the binding strength of these compounds to DNA. The values of Kb were 0.71, 1.06, and 1.43 × 10⁴ M−1 for LOFLX, 1, and 2, respectively. These data was similar to those of [Ru(bpy)2(OFX)]2+ (1.12 × 10⁴ M−1) and [Ru(dmbpy)2(OFX)]2+ (1.78 × 10⁴ M−1).25 These results indicating that Ru(ii) complexes coordinated with levofloxacin exhibit comparative DNA affinity with the binding constant of Kb 1.43 × 10⁴ M−1.
3.3. Luminescence spectroscopic studies
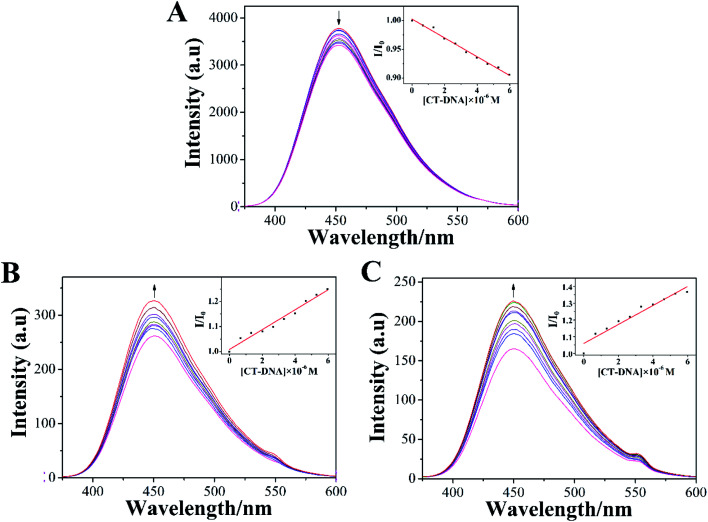
The emission spectra of LOFLX, 1, and 2 in the presence of DNA were also useful for studying the interaction between these compounds and the duplex CT-DNA, and the results were displayed in Fig. 3.
Fig. 3. Spectrum of LOFLX (A), 1 (B), and 2 (C) in the presence of CT-DNA in Tris–HCl buffer (pH 7.2). The arrows show the emission intensity change upon increasing the concentrations of CT-DNA ([Compound] = 20 μM, [DNA] = 1 mM).
As shown in Fig. 3, LOFLX, 1, and 2 could emit strong luminescence in the range of 350–600 nm in Tris–HCl buffer (50 mM NaCl, 5 mM Tris–HCl, pH 7.2) in the absence of CT-DNA at room temperature, with a maximum emission appearing at 453, 450 and 451 nm, respectively. A slight reduction in emission intensity was observed in the luminescence spectrum of LOFLX with increased CT-DNA concentrations (Fig. 3A). However, the emission intensity of 1 and 2 exhibited a significant increase with the addition of DNA, possibly because 1 and 2 were efficiently protected by the hydrophobic DNA molecules from quenching of water. This finding indicated that 1 and 2 could strongly interact with CT-DNA (Fig. 3B and C). When the ratio of [DNA]/[Compound] reached 3.0, the fluorescence intensities of LOFLX, 1, and 2 were 0.91, 1.25, and 1.37 times larger than the original, respectively. These data suggested that these compounds could bind to CT-DNA with different binding affinities in the order of 2 > 1 > LOFLX. These results were also consistent with those of their anticancer activity and electron absorption spectral studies, implying that their anticancer activity may be closely related to their DNA-binding properties.
3.4. Molecular docking
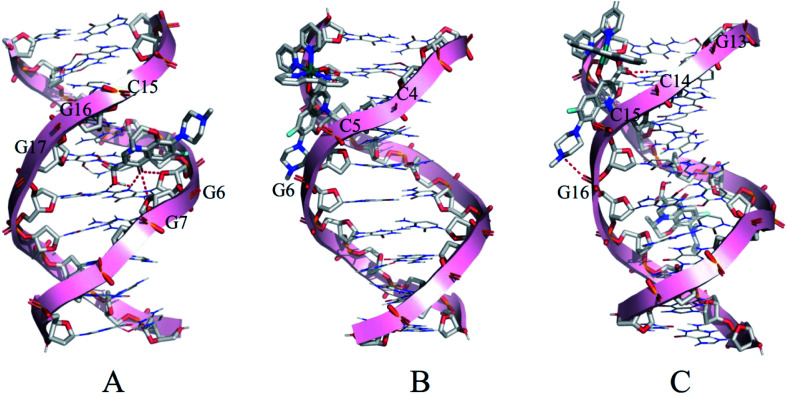
Molecular docking was conducted to study the potential binding interaction of LOFLX, 1, and 2 with double-strand DNA. The crystallographic structure of the double-strand DNA was downloaded from the Protein Data Bank (PDB ID: 1QC1). The conformation corresponding to the lowest binding free energy was selected as the most probable binding conformation.40 Herein, the calculation results showed that three molecules interacted with dsDNA in different sites and diverse properties. As shown in Fig. 4A, for LOFLX, the whole molecule structure was inserted into the major groove constituted by G15–G17 and G6–G7, with the energy of −5.24 kcal mol−1, through hydrogen bonding force. For 1, the main ligand (LOFLX unit) intercalated into the minor groove on the basis of C4–G6 and C18–G20, with the energy of −5.84 kcal mol−1, through electrostatic binding effect. For 2, the main ligand (LOFLX unit) was inserted into the minor groove composed of G13–G16 and G9–G10, with the energy of 6.04 kcal mol−1, through electrostatic binding and hydrogen bonding force. These results suggested that the presence of methyl groups in dipyridyl units was beneficial to the Ru(ii) complex interaction with DNA.
Fig. 4. Docking results of LOFLX (A), 1 (B), and 2 (C) onto the dsDNA (self-fitted B-DNA).
3.5. Theoretical calculation
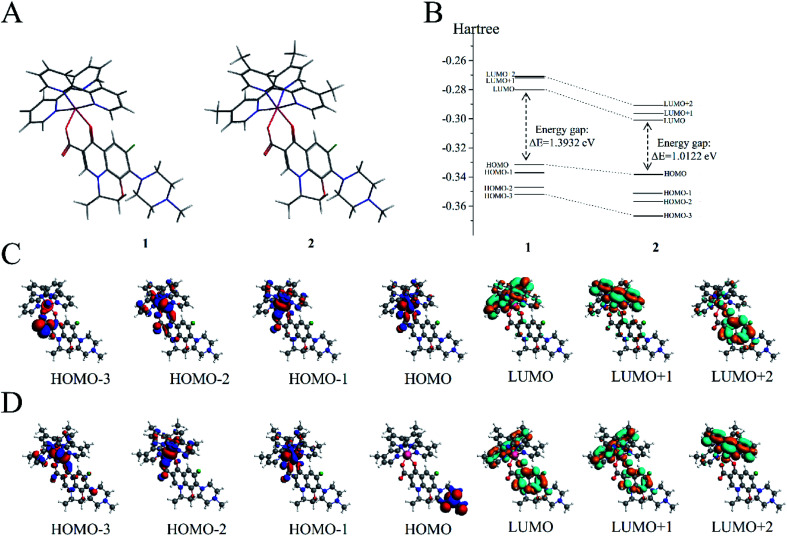
DFT calculations were performed on the two molecules to analyze their electronic structure and investigate the possible reason behind the binding of these two molecules with dsDNA in different properties. All DFT calculations were conducted using the ADF package (2019.10.4, SCM) to investigate the electric shell structure of the ground state and conduct orbital binding analyses of 1 and 2 molecules in accordance with a previously published methodology.41 In particular, GGA-BP86 and scalar relativistic corrections were adopted for structure optimization of the two molecules (Fig. 5A). The ground state of Ru(ii) for 1 and 2 is a single state (S = 0) without unpaired electrons in the two molecules, and the total bonding energies were −12 790.63 and −13 957.98 kcal mol−1, respectively. Then, the electron density distribution of the molecular frontier orbital energy and the substitute group was further analyzed, and some dependencies were observed. The calculation results suggested that 2 had a lower energy gap between HOMO and LUMO at 1.0122 eV than 1 at 1.3932 eV (Fig. 5B), because the electron intercalated and de-intercalated easily due to the smaller energy that the orbit leaped from the HOMO to the LUMO. These results indicated that the introduction of four methyl groups in 2 could shift the LUMO of molecule positively and reduce the force of electron injection into the conduction band. Moreover, for complex 1, the electronic clouds majorly focused on the auxiliary ligand of pyridine ring, but a small quantity was found on the main ligand of levofloxacin on HOMO and LUMO (Fig. 5C). However, for complex 2, the electronic clouds were distributed primarily in the main ligand of levofloxacin of HOMO and LUMO. Combined with docking analysis, these results showed that the two molecules bind to double-strand DNA majorly through levofloxacin unit interaction, and the low energy gap and enriched electrons were beneficial to the stronger interaction of complex 2 with DNA than that of 1.
Fig. 5. (A) Molecular structures of 1 and 2. (B) Gas-phase highest occupied molecular orbital (HOMO) and lowest unoccupied molecular orbital (LUMO) energies of 1 and 2 (in hartree). (C) HOMOs (first four) and LUMOs (last three) of 1. (D) HOMOs (first four) and LUMOs (last three) of 2.
3.6. In vitro anti-tumor activities
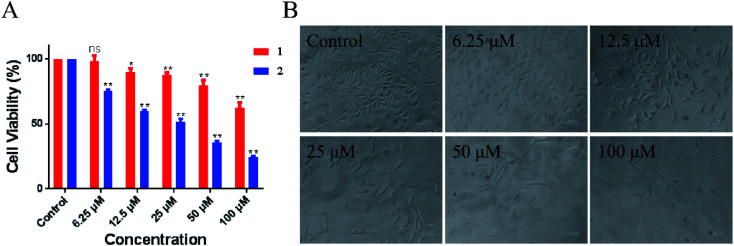
Evaluation of the biological activity of complexes 1 and 2 against different human tumor cells showed that the two synthetic Ru(ii) complexes exhibited acceptable inhibitory effect to lung cancer A549 cells. In particular, 2 showed better IC50 value of 54.2 μM than 1 at > 100 μM. As shown in Fig. 6, the number of A549 cells decreased rapidly and most cells shrank to globular size with the increase in 2. When the concentration was 100 μM, less than 10% of the cell membrane surface became rough and irregular, and the cell structure was broken. Moreover, we tested the toxicity of LOFLX, 1 and 2 against normal lung Beas-2B cells, the IC50 value of three compounds all were >100 μM. These results indicated Ru(ii) complexes coordinated with LOFLX displayed acceptable anti-tumor activity and low toxicity to normal cells. Compared with the ruthenium complexes coordinated with ofloxacin [Ru(dmbpy)2(OFLX)]2+, the Ru(ii) complexes coordinated with levofloxacin [Ru(dmbpy)2(LOFLX)]2+ exhibited better anti-tumor activity against A549 cells with IC50 value of 54.2 μM and comparative affinity to double strand DNA with the binding constant of Kb 1.43 × 10⁴ M−1. These results suggested that electron-rich Ru(ii) complexes displayed increased antitumor activity, which was in agreement with its enhanced DNA-binding properties.
Fig. 6. Inhibitory activity (IC50/μM) of 1 and 2 against A549 cells (A). Morphological change in A459 cells in the absence and presence of 2 (B).
Appropriate lipid–water partition coefficient of the compounds were beneficial to promote the molecules across cellular membrane and distribute easily in cells under physiological conditions. Thus, the n-octanol–water partition constant log Po/w for 1 and 2 were obtained of −0.928 ± 0.019 and −0.506 ± 0.0033, respectively. This result was rational given that molecular polarity changes with the introduction of methyl group, both complexes exhibit acceptable lipophilicity, especially for 2 displays greater lipophilicity, which may be more easily penetrate the cell membrane. Therefore, we concluded that the introduction of methyl group plays a key role in DNA-binding behavior and in the anticancer activity of these arene Ru(ii) complexes.
3.7. DNA damage
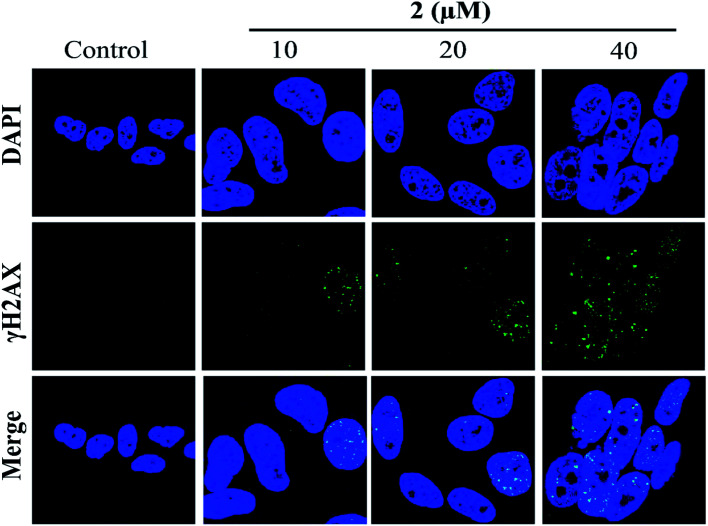
In addition, the formation of γH2AX foci had been considered a sensitive method for detecting DNA damage, especially DNA double-strand breaks (DSBs).42 Therefore, in the present study, the induction of DSBs in A549 cells was detected using immunofluorescence analysis and staining with DSB biomarker γH2AX. As shown in Fig. 7, no γH2AX foci formation was detected in the untreated cells. However, the percentages of γH2AX foci positive cells were significantly increased in A549 cells exposed to complex 2 in a dose-dependent manner. These results indicated that 2 may induce G2/M phase cell cycle arrest by triggering DNA damage.
Fig. 7. Complex 2 induced γH2AX foci formation in A549 cells, as investigated by immunofluorescence.
3.8. G2/M phase arrest induced by complex 2
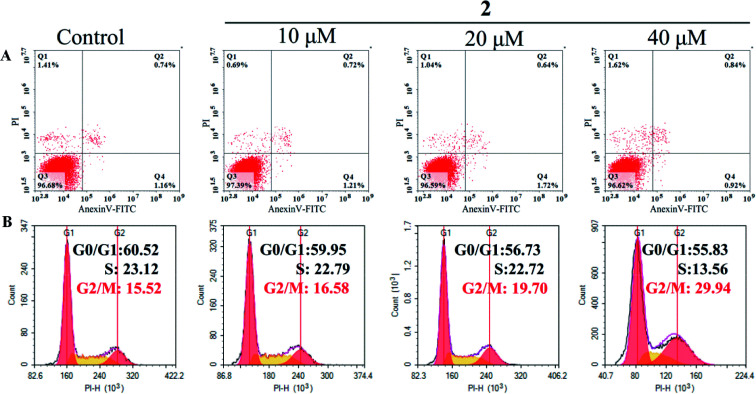
Cell cycle arrest and apoptosis were two major reasons for anticancer drugs to inhibit cell growth.43 Therefore, flow cytometric analysis was performed to investigate the potential mechanisms of complex 2 in suppressing the proliferation of A549 cells. As shown in Fig. 8A, the number of apoptotic cells treated with complex 2 did not increase significantly compared with that of untreated A549 cells, suggesting that complex 2 did not effectively induce apoptosis in A549 cells.
Fig. 8. Flow cytometric analysis of apoptosis induction (A) and cell cycle distribution (B) in A549 cells after exposure to complex 2 at different concentrations for 72 h.
In addition, complex 2 resulted in a significant increase in the percentage of cells at G2/M phase from 15.52% (control) to 29.93 in A549 cells, with an accompanying decrease in the number of cells in the G0/G1-phase and S-phase cell populations (Fig. 8B). These results indicated that complex 2 inhibited the growth of A549 cells by inducing G2/M-phase cell cycle arrest. A common mechanism for inducing and maintaining G2/M cell cycle arrest was through the activation of DNA damage checkpoint,44 which suggested that this class of Ru(ii) complexes may inhibit the growth of tumor cells by binding to DNA, and inducing DNA damage leads to G2/M cell cycle arrest.
4. Conclusions
In conclusion, 1 and 2 were prepared with high efficiency under microwave irradiation. Both complexes interacted with CT-DNA, with 2 exhibiting higher binding affinity than LOFLX and 1. Further studies showed that 2 could inhibit the growth of tumor cells, especially A549 human lung cancer cells, by inducing DNA damage and G2/M phase arrest. In a word, this study showed that these Ru(ii) complexes could be developed as a potential DNA binding agent and a promising inhibitor by inducing DNA damage in chemotherapy.
Conflicts of interest
The funders had no role in the design of the study; in the collection, analyses, or interpretation of data; in the writing of the manuscript, or in the decision to publish the results.
Supplementary Material
Acknowledgments
This work was supported by the National Natural Science Foundation of China (81572926 and 81703349), the China Postdoctoral Science Foundation (2017M610576), the Provincial Major Scientific Research Projects in Universities of Guangdong Province (2014KZDXM053 and 2017KZDXM051), the Innovation Projects in Universities of Guangdong Province (2015cxqx151), the Science and Technology Project of Guangdong Province (2014A020212312 and 2017zc0213), the Innovation Team Projects in Universities of Guangdong Province (2016KCXTD018), Guangzhou Key Laboratory of Construction and Application of New Drug Screening Model Systems (201805010006), Key Laboratory of New Drug Discovery and Evaluation of Ordinary Universities of Guangdong Province (2017KSYS002), and the Project for Innovation and Science & Technology Improvement in Guangdong Pharmaceutical University.
Electronic supplementary information (ESI) available. See DOI: 10.1039/d0ra09418h
Notes and references
- Bray F. Ferlay J. Soerjomataram I. Siegel R. L. Torre L. A. Jemal A. Ca-Cancer J. Clin. 2018;68:394–424. doi: 10.3322/caac.21492. [DOI] [PubMed] [Google Scholar]
- Ghosh S. Bioorg. Chem. 2019;88:102925. doi: 10.1016/j.bioorg.2019.102925. [DOI] [PubMed] [Google Scholar]
- Simpson P. Desai N. Casari I. Massi M. Falasca M. Future Med. Chem. 2019;11:119–135. doi: 10.4155/fmc-2018-0248. [DOI] [PubMed] [Google Scholar]
- Rosenberg B. Vancamp L. Trosko J. E. Mansour V. H. Nature. 1969;222:385–386. doi: 10.1038/222385a0. [DOI] [PubMed] [Google Scholar]
- Webber K. Friedlander M. Best Pract. Res. Cl. Ob. 2017;41:126–138. doi: 10.1016/j.bpobgyn.2016.11.004. [DOI] [PubMed] [Google Scholar]
- Dilruba S. Kalayda G. V. Cancer Chemother. Pharmacol. 2016;77:1103–1124. doi: 10.1007/s00280-016-2976-z. [DOI] [PubMed] [Google Scholar]
- Bruijnincx P. C. Sadler P. J. Curr. Opin. Chem. Biol. 2008;12:197–206. doi: 10.1016/j.cbpa.2007.11.013. [DOI] [PMC free article] [PubMed] [Google Scholar]
- Hanif M. Hartinger C. G. Future Med. Chem. 2018;10:615–617. doi: 10.4155/fmc-2017-0317. [DOI] [PubMed] [Google Scholar]
- Heffeter P. Jungwirth U. Jakupec M. Hartinger C. Galanski M. Elbling L. Micksche M. Keppler B. Berger W. Drug Resist. Updates. 2008;11:1–16. doi: 10.1016/j.drup.2008.02.002. [DOI] [PubMed] [Google Scholar]
- Gaur R. Mishra L. Inorg. Chem. 2012;51:3059–3070. doi: 10.1021/ic202440r. [DOI] [PubMed] [Google Scholar]
- Meng X. Leyva M. L. Jenny M. Gross I. Benosman S. Fricker B. Harlepp S. Hébraud P. Boos A. Wlosik P. Bischoff P. Sirlin C. Pfeffer M. Loeffler J. P. Gaiddon C. Cancer Res. 2009;69:5458–5466. doi: 10.1158/0008-5472.CAN-08-4408. [DOI] [PubMed] [Google Scholar]
- Wang J. Chen Y. Ren J. Zhao C. Qu X. Nucleic Acids Res. 2014;42:3792–3802. doi: 10.1093/nar/gkt1354. [DOI] [PMC free article] [PubMed] [Google Scholar]
- Gao F. Chao H. Zhou F. Yuan Y.-X. Peng B. Ji L.-N. J. Inorg. Biochem. 2006;100:1487–1494. doi: 10.1016/j.jinorgbio.2006.04.008. [DOI] [PubMed] [Google Scholar]
- Gill M. R. Garcia-Lara J. Foster S. J. Smythe C. Battaglia G. Thomas J. A. Nat. Chem. 2009;1:662–667. doi: 10.1038/nchem.406. [DOI] [PubMed] [Google Scholar]
- Zhang Z. Wu Q. Wu X.-H. Sun F.-Y. Chen L.-M. Chen J.-C. Yang S.-L. Mei W.-J. Eur. J. Med. Chem. 2014;80:316–324. doi: 10.1016/j.ejmech.2014.04.070. [DOI] [PubMed] [Google Scholar]
- Golbaghi G. Castonguay A. Molecules. 2020;25:265. doi: 10.3390/molecules25020265. [DOI] [PMC free article] [PubMed] [Google Scholar]
- Liu J. Lai H. Xiong Z. Chen B. Chen T. Chem. Commun. 2019;55:9904–9914. doi: 10.1039/C9CC04098F. [DOI] [PubMed] [Google Scholar]
- Pal M. Nandi U. Mukherjee D. Eur. J. Med. Chem. 2018;150:419–445. doi: 10.1016/j.ejmech.2018.03.015. [DOI] [PubMed] [Google Scholar]
- Riccardi C. Musumeci D. Irace C. Paduano L. Montesarchio D. Eur. J. Org. Chem. 2017;2017:1100–1119. doi: 10.1002/ejoc.201600943. [DOI] [Google Scholar]
- Riccardi C. Musumeci D. Trifuoggi M. Irace C. Paduano L. Montesarchio D. Pharmaceuticals. 2019;12:46. doi: 10.3390/ph12040146. [DOI] [PMC free article] [PubMed] [Google Scholar]
- Thota S. Alencar Rodrigues D. Crans D. Barreiro E. J. Med. Chem. 2018;61:5805–5821. doi: 10.1021/acs.jmedchem.7b01689. [DOI] [PubMed] [Google Scholar]
- Kljun J. Bratsos I. Alessio E. Psomas G. Repnik U. Butinar M. Turk B. Turel I. Inorg. Chem. 2013;52:9039–9052. doi: 10.1021/ic401220x. [DOI] [PubMed] [Google Scholar]
- Kljun J. Bytzek A. K. Kandioller W. Bartel C. Jakupec M. A. Hartinger C. G. Keppler B. K. Turel I. Organometallics. 2011;30:2506–2512. doi: 10.1021/om101180c. [DOI] [PMC free article] [PubMed] [Google Scholar]
- Turel I. Kljun J. Perdih F. Morozova E. Bakulev V. Kasyanenko N. Byl J. A. Osheroff N. Inorg. Chem. 2010;49:10750–10752. doi: 10.1021/ic101355d. [DOI] [PMC free article] [PubMed] [Google Scholar]
- Wang C.-X. Wu Q. Zeng Y.-C. Huang D.-W. Yu C.-Q. Wang X.-C. Mei W.-J. J. Coord. Chem. 2015;68:1–21. doi: 10.1080/00958972.2014.987136. [DOI] [Google Scholar]
- Mei W.-J. Liu J. Zheng K.-C. Lin L.-J. Chao H. Li An-X. Yun F.-C. Ji L.-N. Dalton Trans. 2003;7:1352–1359. doi: 10.1039/B212443B. [DOI] [Google Scholar]
- Sullivan B. Salmon D. Meyer T. K. J. Inorg. Chem. 1978;10:3334–3341. doi: 10.1021/ic50190a006. [DOI] [Google Scholar]
- Chao H. Li R.-H. Jiang C.-W. Li H. Ji L.-N. Li X. Y. J. Chem. Soc., Dalton Trans. 2001;12:1920–1926. doi: 10.1039/B101483H. [DOI] [Google Scholar]
- Hayat F. Zia ur R. Khan M. H. J. Coord. Chem. 2017;70:279–295. doi: 10.1080/00958972.2016.1255328. [DOI] [Google Scholar]
- Chen L.-M. Liu J. Chen J.-C. Tan C.-P. Shi S. Zheng K.-C. Ji L.-N. J. Inorg. Biochem. 2008;102:330–341. doi: 10.1016/j.jinorgbio.2007.09.006. [DOI] [PubMed] [Google Scholar]
- Nair R. B. Teng E. S. Kirkland S. L. Murphy C. J. Inorg. Chem. 1998;37:139–141. doi: 10.1021/ic970432j. [DOI] [PubMed] [Google Scholar]
- Ohkatsu Y. Ishikawa S.-i. Tobita E. Polym. Degrad. Stab. 2000;67:541–545. doi: 10.1016/S0141-3910(99)00157-3. [DOI] [Google Scholar]
- Wolff S. K. Int. J. Quantum Chem. 2005;104:645–659. doi: 10.1002/qua.20653. [DOI] [Google Scholar]
- Wu Q. Zheng K. Huang X. Li L. Mei W. J. Med. Chem. 2018;61:10488–10501. doi: 10.1021/acs.jmedchem.8b01018. [DOI] [PubMed] [Google Scholar]
- Liu X.-K. Zhao X.-H. Li Y.-M. Zheng K.-D. Wu Q. Mei W.-J. Aust. J. Chem. 2019;72:400–406. doi: 10.1071/CH18637. [DOI] [Google Scholar]
- Gallori E. Vettori C. Alessio E. Vilchez F. G. Vilaplana R. Orioli P. Casini A. Messori L. Arch. Biochem. Biophys. 2000;376:156–162. doi: 10.1006/abbi.1999.1654. [DOI] [PubMed] [Google Scholar]
- Nomula R. Wu X. Zhao J. Munirathnam N. R. Mater. Sci. Eng., C. 2017;79:710–719. doi: 10.1016/j.msec.2017.05.123. [DOI] [PubMed] [Google Scholar]
- Barton J. Danishefsky A. Goldberg J. J. Am. Chem. Soc. 1984;106:2172–2176. doi: 10.1021/ja00319a043. [DOI] [Google Scholar]
- Sun J. Wu S. Chen H.-Y. Gao F. Liu J. Ji L.-N. Mao Z.-W. Polyhedron. 2011;30:1953–1959. doi: 10.1016/j.poly.2011.04.047. [DOI] [Google Scholar]
- Spyrakis F. Amadasi A. Fornabaio M. Abraham D. J. Mozzarelli A. Kellogg G. E. Cozzini P. Eur. J. Med. Chem. 2007;42:921–933. doi: 10.1016/j.ejmech.2006.12.037. [DOI] [PubMed] [Google Scholar]
- Larsen A. H. Kleis J. Thygesen K. S. Nørskov J. K. Jacobsen K. W. Phys. Rev. B: Condens. Matter Mater. Phys. 2011;84:245429. doi: 10.1103/PhysRevB.84.245429. [DOI] [Google Scholar]
- Löbrich M. Shibata A. Beucher A. Fisher A. Ensminger M. Goodarzi A. A. Barton O. Jeggo P. A. Cell Cycle. 2010;9:662–669. doi: 10.4161/cc.9.4.10764. [DOI] [PubMed] [Google Scholar]
- Zhang Y. Li X. Huang Z. Zheng W. Fan C. Chen T. J. Nanomed. Nanotechnol. 2013;9:74–84. doi: 10.1016/j.nano.2012.04.002. [DOI] [PubMed] [Google Scholar]
- Zhang R. Loganathan S. Humphreys I. Srivastava S. K. J. Nutr. 2006;136:2728–2734. doi: 10.1093/jn/136.11.2728. [DOI] [PubMed] [Google Scholar]
Associated Data
This section collects any data citations, data availability statements, or supplementary materials included in this article.


