Abstract
Quantitative analysis of multiple-hit potassium permanganate (KMnO4) footprinting has been carried out in vivo on Saccharomyces cerevisiae 5S rRNA genes. The results fix the number of open complexes at steady state in exponentially growing cells at between 8 and 17% of the 150 to 200 chromosomal copies. UV and dimethyl sulfate footprinting set the transcription factor TFIIIB occupancy at 23 to 47%. The comparison between the two values suggests that RNA polymerase III binding or promoter opening is the rate-limiting step in 5S rRNA transcription in vivo. Inhibition of RNA elongation in vivo by cordycepin confirms this result. An experimental system that is capable of providing information on the mechanistic steps involved in regulatory events in S. cerevisiae cells has been established.
Yeast RNA polymerase III transcription machinery components and their interaction with promoter elements are known in detail (for reviews, see references 19, 22, and 45). 5S rRNA transcription requires TFIIIB, which is the initiation factor proper of RNA polymerase III, and two assembly factors, TFIIIA and TFIIIC (25). The in vitro topography of transcription factor complexes is well described thanks to extensive DNA footprinting studies (8, 25, 26), protein-DNA cross-linking (2, 9, 27), and protein subunit assembly studies (13, 29). Analysis of KMnO4 sensitivity on open complexes and stalled elongation complexes has suggested structural analogies to bacterial polymerase mechanisms (25, 28). In spite of all the available information on the in vitro systems, very little is known about the organization of transcription complexes on 5S genes inside yeast cells. A weak modulation of DNase I cutting has recently been observed in the 5′-flanking sequence of 5S genes on episomes in vivo (31, 32). Previous attempts to reveal transcription factor-DNA interactions on the 5S chromosomal genes in vivo did not provide conclusive information. These difficulties are primarily due to (i) the low occupancy by transcription complexes of the multiple copies of the genes present in the cell (14), (ii) the lack of studies making use of noninvasive footprinting techniques, and (iii) the lack of proper nontranscribing control conditions allowing clear distinctions to be made between changes due to transcription complexes and those due to chromatin organization. In this study we overcome these problems. UV (3, 5), dimethyl sulfate (DMS) (21), and KMnO4 (37) footprinting can be performed directly on growing cells. This approach involves short exposure times with minimal impact on the biological structure to be investigated. Histone-DNA interactions have only a small influence on UV irradiation and DMS reactivity patterns, allowing selective visualization of transcription factor footprints (4, 21). KMnO4 is a highly specific probe for open-complex formation. A system was developed to transcribe 5S rRNA genes in the absence of TFIIIA (12). In this system, yeast cells devoid of TFIIIA, which therefore cannot form transcription complexes on endogenous chromosomal copies of 5S rDNA, survive because they carry a hybrid RPR1 promoter-5S gene construct on a multicopy plasmid. Such a strain is the ideal control for its isogenic cohort with wild-type TFIIIA activity. The comparison between footprinting patterns on the two strains allows a clear distinction to be made between footprinting changes due to transcription and those due to other protein complexes, as, for example, those involved in chromatin organization.
MATERIALS AND METHODS
Yeast strains.
Saccharmyces cerevisiae strains YRW1 (MATa can1-100 his3-11 leu2-3,112 trp1-1 ura3-1 ade2-1 tfc2::LEU2) is derived from the LP112 strain. It has the entire coding region of the TFC2 gene deleted and replaced by a LEU2 fragment and survives with the TFC2 gene carried on plasmid pJA230. YSC14 is identical to YRW1, except that plasmid pJA230 is replaced by the multicopy plasmid pRS-RPR1-5S. The two strains are described in detail in reference 12.
Enzymes and chemicals.
Zymolyase 100T was from Seikagaku, Taq polymerase (AmpliTaq) was from Perkin Elmer, Vent (Exo −) DNA polymerase was from New England Biolabs, DMS and piperidine were from Fluka, and cordycepin triphosphate was from Sigma.
UV irradiation and footprinting analysis.
Cells grown at a density of 5 × 10⁷ to 7 × 10⁷ cells/ml in yeast extract-peptone-dextrose (YPD) medium plus 0.2% Tween 80 were irradiated for 8 min in a Spectrolinker (Spectronics Corp.), equipped with a 254-nm lamp, in a volume of 2.5 ml inside a coverless small petri dish at a distance of 4 cm from the lamp and with an irradiation energy of 10 mJ/cm2. Irradiated or unirradiated control cells were collected by centrifugation and resuspended in 500 μl of lysis buffer (50 mM Tris-HCl [pH 8], 10mM EDTA, 0.2% sodium dodecyl sulfate). Cells were lysed by adding 1 volume of glass beads and vortexing. After two phenol extractions, genomic DNA was recovered by isopropanol precipitation. Naked genomic DNA was irradiated under the conditions described above, except that the DNA was dissolved in 50 mM Tris-HCl (pH 8)–50 mM NaCl and the irradiation times are indicated in the figure legends.
Irradiated and purified genomic DNA samples were primer extended with Taq DNA polymerase (30 cycles) under the conditions indicated in the figure legends.
Experiments were carried out to quantitate the UV-induced lesions as a function of the time of UV treatment of the cells and naked genomic DNA. Genomic DNA purified from cells irradiated for different times, or irradiated after purification, was subjected to deamination of photochemically modified cytosines, NaBH4 reduction, and acidic aniline treatment as described in reference 3. This treatment should convert most of the UV lesions to DNA breaks. Recovered DNA samples were run in 4.5% denaturing acrylamide gels with length markers (data not shown) to obtain a gross estimate of the number of breaks per unit length. From these experiments we could see that the reactivity of naked genomic DNA to UV irradiation is much higher than that of genomic DNA inside the cells (30 s of treatment of naked DNA was comparable to 8 min of treatment in vivo), probably due to in vivo shadowing by the intracellular concentrations of nucleotides and RNA and to a consistent quenching by protein components. On the other hand, we found that the mean length distribution of the fragments produced by the breaks was well above 220 bp for the longest time of treatment (24 min in vivo). We therefore expect the irradiation to be in a single-hit condition in our analysis, which is limited to DNA domains shorter than 150 bp.
DMS footprinting.
DMS treatment was performed as in reference 21 using the times and concentrations indicated in the figure legends. After the treatment, genomic DNA was purified and reacted with piperidine as described in reference 21 and finally primer extended with Vent (Exo −) DNA polymerase (12 cycles) under the conditions indicated in the figure legends.
To assess the intrinsic variability of the data, we compared the patterns obtained by treating two independent cultures of strain YRW1 with DMS under the same conditions used for the experiments in Fig. 2, followed by purification and extension of genomic DNA with primer A. Based on the observed variability (ς = 6.3% [data not shown]), protection of 19% or greater was deemed significant.
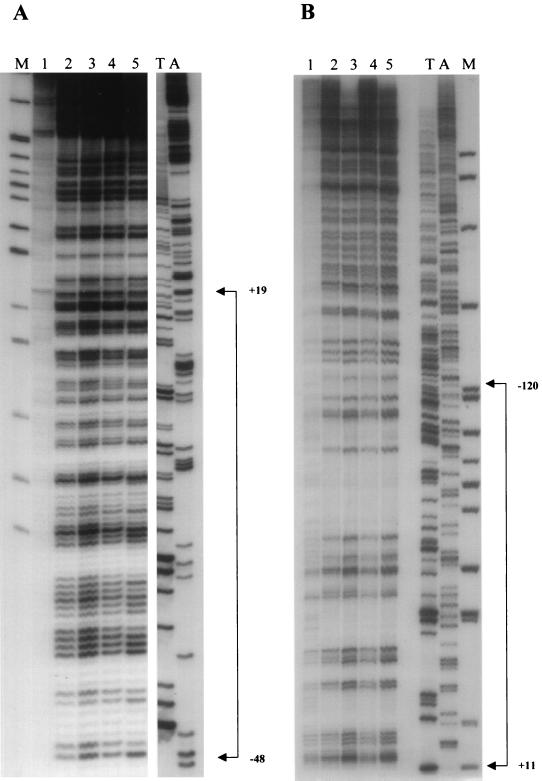
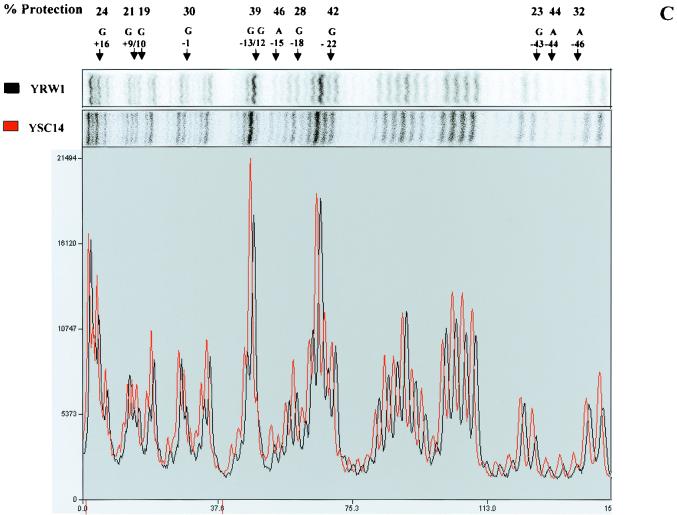
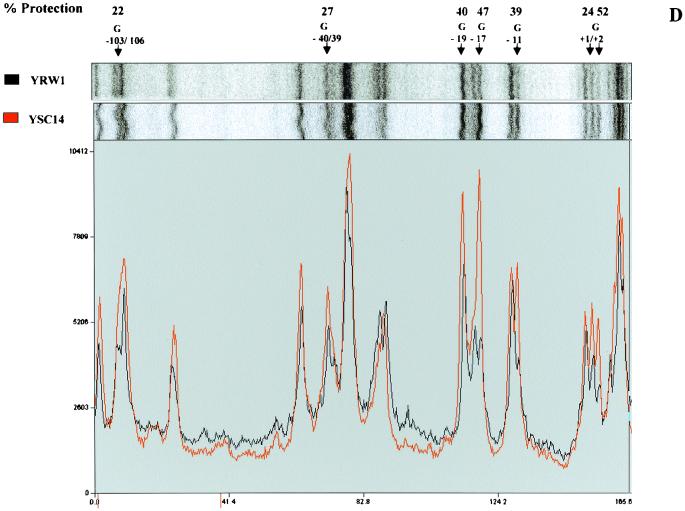
FIG. 2.
DMS footprinting on exponentially growing S. cerevisiae YRW1 and YSC14 cells. (A) Samples treated as described in Materials and Methods were primer extended with Vent (Exo −) polymerase (94°C for 2 min, 60°C for 10 min, and 76°C for 2 min for 12 cycles) using primer A (Fig. 3). After phenol extraction and ethanol precipitation, samples were analyzed on a 6% denaturing polyacrylamide gel. M, PBR322 MspI marker lane. Lanes: 1, untreated naked genomic DNA from strain YRW1; 2, genomic DNA from strain YRW1 treated with 1 μl of DMS for 1 min; 3, genomic DNA from strain YRW1 treated with 1 μl of DMS for 3 min; 4, genomic DNA from strain YSC14 treated with 1 μl of DMS for 1 min; 5, genomic DNA from strain YSC14 treated with 1 μl of DMS for 3 min; T and A, Sanger T and A sequencing lanes. The area considered in the quantitative analysis is indicated on the right side. (B) As in panel A, but samples were primer extended using primer B. (C) A portion of the DMS footprinting patterns shown in panel A (lanes 2 and 4) was analyzed with a phosphorimager (see Materials and Methods). The images are shown in the upper part. The lower part shows the two overlapped densitometric profiles. Note that the densitograms are slightly shifted on the x axis. At the top of the panel, the arrows indicate the position of the residues significantly (≥19% [see Materials and Methods]) protected from methylation in the YRW1 strain and the percent protection (obtained as the ratio of the normalized band intensities multiplied by 100; normalization to the total lane intensity). A single value is given for −12 and −13 guanines overlapping peaks. (D) A portion of the DMS footprinting patterns shown in panel B (lanes 2 and 4) was analyzed with a phosphorimager (see Materials and Methods). The produced images are shown in the upper part. The lower part shows the two overlapped densitometric profiles. At the top of the panel, the arrows indicate the position of the residues significantly (≥19%) protected from methylation in the YRW1 strain and the percent protection (obtained as the ratio of the normalized band intensities multiplied by 100; normalization to the total lane intensity). A single value is given for −103 to −106 purines overlapping peaks.
KMnO4 treatment in vivo.
Cells grown to a density of 1 × 10⁷ to 2 × 10⁷ ml−1 in YPD medium plus 0.2% Tween 80 were collected by centrifugation, resuspended in 1/10 volume of the same medium, and immediately treated with KMnO4 at the concentrations and for the times indicated in the figure legends. The reactions were stopped with 10 volumes of stop mix (1 M sorbitol, 110 mM Tris-HCl [pH 8], 110 mM EDTA, 44 mM β-mercaptoethanol). After addition of 0.5 mg of Zymolyase, samples were incubated for 15 min at 30°C and spheroplasts were recovered by centrifugation. Pelleted spheroplasts were lysed in 500 μl of lysis buffer and treated with proteinase K (80 μg) for 1 h at 56°C. After two phenol extractions, genomic DNA was recovered by isopropanol precipitation. Resuspended genomic DNA was restricted with Sau3AI (2 U/μg of DNA) for 12 h at 37°C. After phenol extraction and ethanol precipitation, the restricted genomic DNA was primer extended with Taq DNA polymerase (30 cycles) under the conditions indicated in the figure legends.
Alternatively, the restricted genomic DNA was resuspended in 100 μl of 10% piperidine and reacted at 89°C for 20 min. The piperidine was eliminated by vacuum drying. Samples were resuspended in 100 μl of water and vacuum dried again. This step was repeated twice. Piperidine-treated genomic DNA was primer extended with Taq DNA polymerase (30 cycles) under the conditions indicated in the figure legends.
KMnO4 sensitivity quantitative analysis.
The method is described in detail in reference 41. If f is the fraction of the initial population of molecules that can be modified by KMnO4 (and therefore f[Dtot] is the concentration of the reactive species), then the concentration of the DNA fragments generated by reaction at the thymines are expressed by the following equations:
 |
1 |
 |
2 |
 |
3 |
 |
4 |
 |
5 |
where the amounts of pausing at positions −8, −7, −6, and −3, normalized to the total lane intensity, are designated [D1], [D2], [D3], and [D4], respectively, the amount of all the primer extension products not due to thymine modification is designated [Du], and [F]tot is the total concentration of KMnO4 in nanomoles per liter. The band intensities due to pausing at the thymines in the wild-type strain were corrected by subtracting the correspondent background intensities on the YSC14 strain, and the fraction [Di]/[Dtot], where [Di] is the intensity of the ith band and [Dtot] is the sum of all band intensities (including the restriction created end-point) in a lane, was calculated and plotted as a percentage on the y axis (see Fig. 6). Plots refer to three independent experiments. The theoretical curves reported are the best global fit by nonlinear least-squares analysis of the data to equations 2 to 5. To obtain the fraction of KMnO4-reactive promoter DNA, we calculated the global best-fit value for f. The fit of the data of the four bands was performed for each experiment while simultaneously minimizing the χ2 of the four related functions 2 to 5. We used the QDP/PLT package (40) The fit minimizes the χ2 by using a modified version of the CURFIT subroutine described in reference 6. This subroutine makes a least-squares fit to a function using the algorithm of Marquardt (34), which combines a gradient search with an analytical solution developed from linearizing the fitting function. Uncertainties in parameter values are estimated using the method described in reference 30 and correspond to the 90% confidence range for a single parameter.
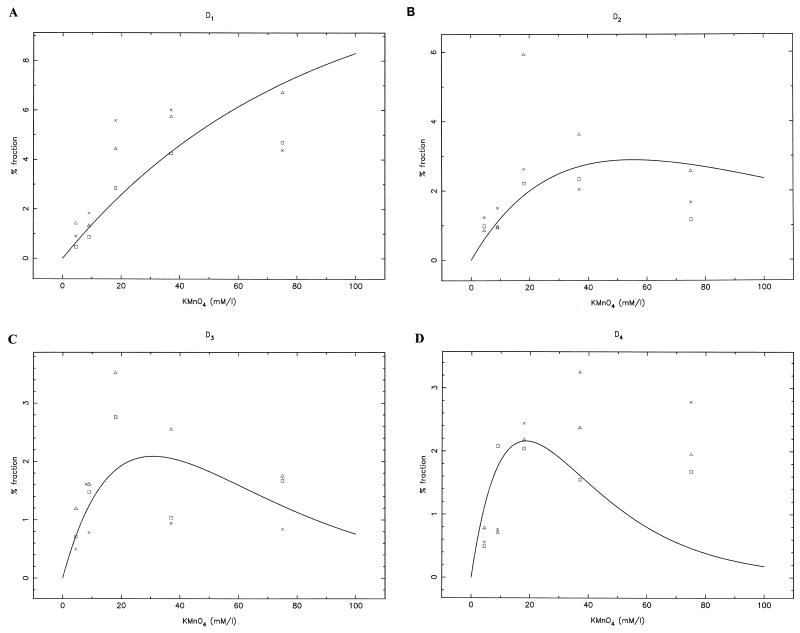
FIG. 6.
Quantitative analysis of KMnO4 titration on S. cerevisiae YRW1 cells. Shown are plots of the KMnO4-induced pausing fraction versus reagent concentration (see Materials and Methods) for D1 (A), D2 (B), D3 (C), and D4 (D). Data from three independent experiments are shown. The theoretical curves are the best global fit of the data (to equations 2 to 5 [see Materials and Methods]).
Cordycepin triphosphate treatment.
Cells grown to a density of 1 × 10⁷ to 2 × 10⁷ ml−1 in YPD medium plus 0.2% Tween 80 were collected by centrifugation, resuspended in 1/10 volume of the same medium plus 4 mM cordycepin triphosphate, and incubated for 20 min at 22°C. After the incubation, the cells were immediately treated with KMnO4 at the concentrations and for the times indicated in the legend to Fig. 7. To monitor the effect of cordycepin on UTP incorporation, 50 μCi of [α-32P]UTP (3,000 Ci/mmol) was added to the cells resuspended in medium containing 4 mM cordycepin triphosphate or ATP (control). After 20 min at 22°C, the cells were centrifuged and washed four times with YPD. Pelleted cells were finally Cerenkov counted. The results of three independent experiments showed that in the presence of cordycepin, UTP incorporation was 15 ± 2.5% compared to the control.
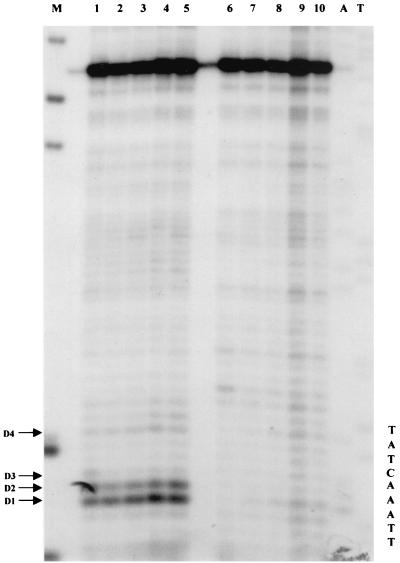
FIG. 7.
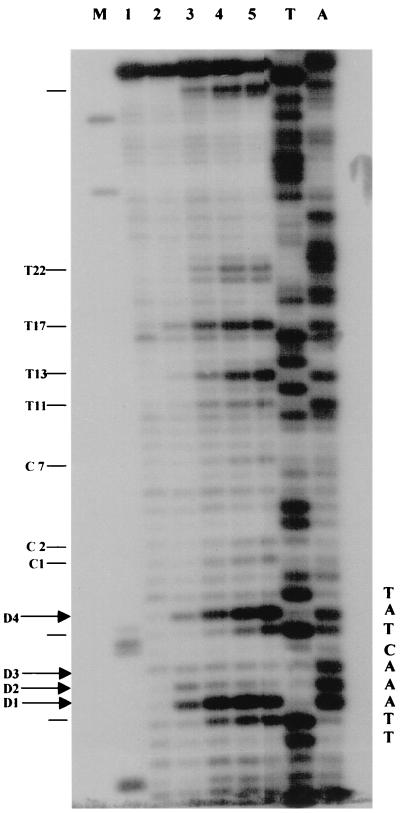
Effects of cordycepin triphosphate treatment on KMnO4 in vivo reactivity. (A) YRW1 cells were incubated with cordycepin triphosphate and then immediately reacted with KMnO4 as in Materials and Methods; genomic DNA purified and restricted with Sau3AI was primer extended with Taq polymerase: (94°C for 45 sec, 60°C for 1 min, and 72°C for 2 min for 30 cycles) using primer C (Fig. 3). Lanes: 1 to 5, cells treated for 2 min at 22°C with 4.5, 9, 18, 37, or 75 mM KMnO4; M, PBR322 MspI marker lane; A and T, Sanger A and T sequencing lanes (a relevant portion of the sequence is reported). The position of in vivo reactive pyrimidines is indicated on the side.
Low-resolution chromatin analysis.
Low-resolution chromatin analysis was performed on nystatin-permeabilized spheroplasts as described in reference 11.
DNase I footprinting analysis.
DNase I footprinting analysis was performed on isolated nuclei as described in reference 42.
Scanning densitometry and quantitation.
Scanning densitometry was performed with a Bio-Rad model GS-670 imaging densitometer using different autoradiographic exposures to maintain the signals to be analyzed in the linear range of that film. Different length runs were used to accurately map band positions and intensities at different distances from the primer. DMS footprinting experiments were analyzed with the Cyclone storage phosphor system (Packard Instrument Co., Meriden, Conn.).
RESULTS
UV footprinting on the chromosomal 5S gene in vivo.
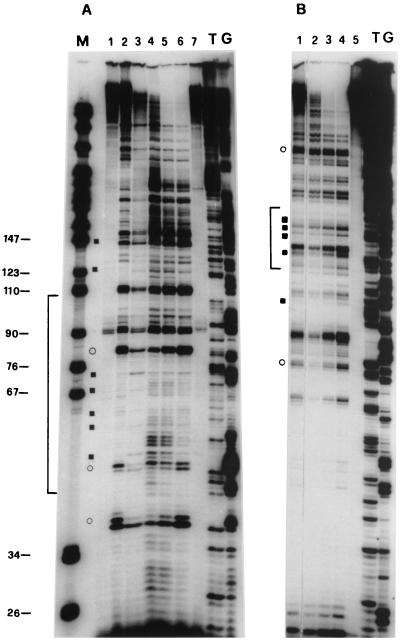
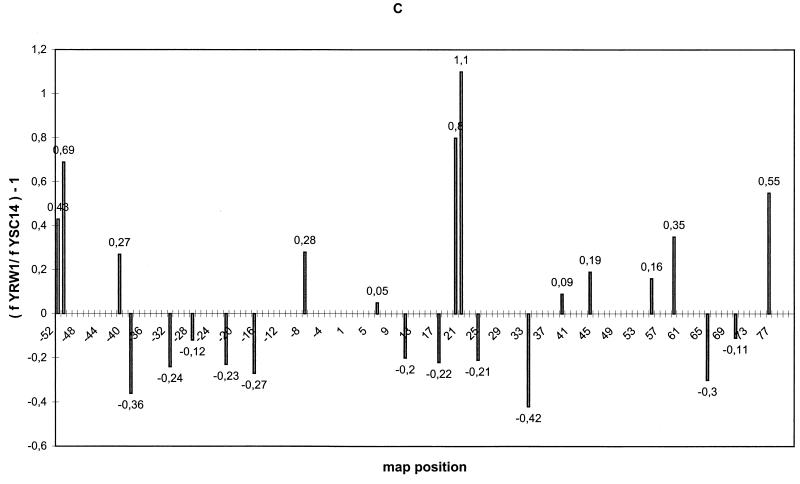
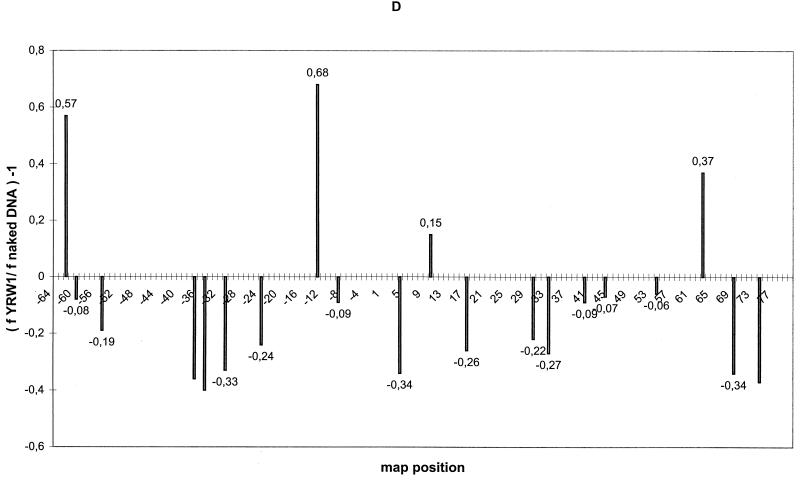
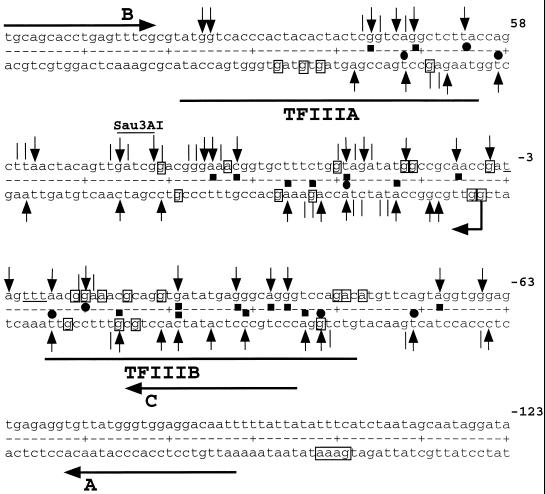
S. cerevisiae exponentially growing cells (YRW1 strain) were irradiated, genomic DNA purified, and processed as described in Materials and Methods. Figure 1 A, lane 2, and Fig. 1B, lane 1, show the pattern obtained by multiple cycles of Taq polymerase primer extension on this DNA using two different primers specific for the two strands of the 5S gene (see Fig. 3). As a control, genomic DNA previously purified from the same strain was UV treated for increasing times and primer extended (Fig. 1A, lanes 4 to 6, and Fig. 1B, lanes 2 to 4). A series of pausing sites clearly increasing in intensity with the time of UV treatment is observed. Scanning densitometry ensures that the ratio between these bands is mantained relatively constant between 30 s and 3 min of irradiation within 150 bp from the primer (data not shown). Moreover, we converted the UV-induced lesions to DNA breaks and controlled the average length of the obtained fragments on a denaturing gel (see Materials and Methods). In this way we could estimate the average number of lesions induced by the treatment we used in vivo (see below) and on the in vitro controls to be well below 1/150. We should therefore be close to a single-hit condition in the analyzed segments (less than 150 bp long). For careful mapping of these UV-induced pausing sites, see Fig. 3. Several weak pausing sites that are induced in the naked DNA control at the lowest UV dose decrease in intensity at longer times of treatment. This mild sensitivity to UV treatment is not associated with a particular sequence motif and has been previously noticed (15). UV-independent pausing is very limited, as shown by the controls (Fig. 1A, lanes 1 and 7; Fig. 1B, lane 5). UV photoproducts can be broadly placed in two categories, those that form between two adjacent bases on one DNA strand and those that form at isolated bases (43). Well-known examples of the former photoproducts include cyclobutane dimers between all pyrimidines; pyrimidine-pyrimidone(6–4) photoproducts at TpC and CpC sequences and, to a much lesser extent, at TpT and CpT; the formation of a pyrimidine-purine dimer at TpA sequences (7); and the formation of purine-purine dimers (18). Examples of photoreactions at isolated bases include photoaddition of H- or -OH to the double bonds at positions 5 and 6 of pyrimidines (43). All these lesions have been observed with different efficiency in UV footprinting experiments (4). Several DNA polymerases terminate at positions preceding the site of a pyrimidine dimer by 1 nucleotide (36), but inspection of Taq polymerase UV-induced pausing patterns suggests that the enzyme is capable of inserting, with high frequency, a nucleotide opposite the adduct (1). The induced pausing sites we observed are often doublets or triplets of bands, with the major band located either opposite a putative photoproduct or 1 nucleotide before it. The putative photoproducts that we observed include mostly pyrimidine dimers, although in some cases we also observed pausing opposite purine dimers and TpA motifs (see Fig. 3). Comparison of the pattern of naked DNA on the lower strand (primer A, nontranscribed strand [Fig. 1A, lanes 4 to 6) with that of native chromatin of strain YRW1 (Fig. 1A, lane 2) identifies several enhancements and protections. Most of the background pausing visible on naked DNA that has been irradiated for 30 s and decreasing at longer times of irradiation is diminished on in vivo-irradiated chromatin. Some of the bands that increase in intensity with UV treatment represent sites at which UV reactivity is clearly increased or diminished by formation of chromatin. Nucleosome-DNA complexes cause a mild effect on UV footprinting (44). Nucleosome formation on this gene exhibits a dominant rotational setting (10). We made use of strain YSC14 (12) as a control to display only the background due to nucleosome interactions. This strain does not possess a functional TFIIIA gene and therefore does not form transcription complexes on its chromosomal 5S genes. The UV pattern on chromatin from this strain retains the protection from the background sensitivity, but it resembles the naked DNA in a number of bands that are instead enhanced or protected in the strain containing TFIIIA (the most evident are marked in Fig. 1A). Figure 1C shows a quantitation of the results of the in vivo UV footprinting on the 5S gene nontranscribed lower strand. Modulation of photoproduct formation is expressed as (f YRW1/ f YSC14) − 1, where f YRW1 and f YSC14 are the intensities of the pausing bands produced by irradiation of strain YRW1 (Fig. 1A, lane 2) and YSC14 (lane 3), respectively, normalized to the total intensity of all bands considered (whose positions are indicated along the x axis). For the analysis of the transcribed upper strand, the mutant strain could not be utilized as a control because primer B also hybridizes with the pRS-RPR1-5S plasmid, which is more reactive than genomic DNA, causing a smeary pattern (data not shown). On this strand, nonambiguous primers must be selected upstream of the poly(A) stretch, but these produce a strong pausing and lower resolution. Thus, we have limited the analysis of the transcribed strand to a comparison between naked DNA and wild-type chromatin (Fig. 1B). Quantitation of the footprinting results (Fig. 1D) is expressed as (f YRW1/ f naked DNA) −1 in this case (data are the average of two independent experiments). For a summary of the results of the quantitations, see Fig. 3, where all protections and all enhancements greater than 20% are reported. The data reported in Fig. 1 and 3 show that (i) in the region of TFIIIB binding from bp −43 to −9 (8, 25), a clear continuous modulation of induced pausing is observed on both strands with protections and enhancements from 20 to 35%, and (ii) no other region of the gene shows such a convincing qualitative correlation with the in vitro footprinting, although the regions from bp +4 to +33 and +59 to +74 also show significant modulations.
FIG. 1.
UV footprinting on exponentially growing S. cerevisiae YRW1 and YSC14 cells. (A) Samples treated as described in Materials and Methods were primer extended with Taq polymerase (94°C for 45 s, 60°C for 1 min, and 72°C for 2 min for 30 cycles) using primer A (Fig. 3). After phenol extraction and ethanol precipitation, samples were analyzed on a 6% denaturing polyacrylamide gel. M, PBR322 MspI marker lane. The band length in base pair is indicated on the side. Lanes: 1, nonirradiated naked genomic DNA from strain YRW1; 2, genomic DNA from 8-min-irradiated strain YRW1; 3, genomic DNA from 8-min-irradiated strain YSC14; 4 to 6, naked genomic DNA irradiated for 30 s, 1 min, and 3 min, respectively; 7, unirradiated naked genomic DNA from strain YSC14; T and G, Sanger T and G sequencing lanes. Empty circles indicate selected increased pausing sites (enhancements) in strain YRW1 relative to strain YSC14; solid squares indicate selected decreased pausing sites (protections) in strain YRW1 relative to strain YSC14. The bracket indicates the position of the TFIIIB binding site. (B) Samples treated as described in Materials and Methods were primer extended with Taq polymerase (94°C for 45 s, 60°C for 1 min, and 72°C for 2 min for 30 cycles) using primer B (Fig. 3). After phenol extraction and ethanol precipitation, samples were analyzed on a 6% denaturing polyacrylamide gel. Lanes: 1, genomic DNA from 8-min-irradiated strain YRW1; 2 to 4, naked genomic DNA irradiated for 30 s, 1 min, and 3 min, respectively; 5, nonirradiated naked genomic DNA from strain YRW1; T and G, Sanger T and G sequencing lanes. Empty circles indicate selected increased pausing sites (enhancements) in strain YRW1; solid squares indicate selected decreased pausing sites (protections) in strain YRW1. The bracket indicates the position of the TFIIIB binding site. (C) Quantitation of the data in panel A. The intensity of UV-induced pausing sites was quantitated by scanning densitometry (see Materials and Methods). The x axis gives the site position in the gene sequence (Fig. 3); the y axis gives (f YRW1/ f YSC14) −1, where f is the band intensity, normalized to the total intensity of the scanned lane segment (from positions −52 to +77 in the gene). For YRW1 and YSC14 we used lanes 2 and 3, respectively. Negative numbers indicate protections; positive numbers indicate enhancements. (D) Quantitation of the data in panel B. The x axis gives the site position in the gene sequence (Fig. 3); the y axis gives (f YRW1/ f naked DNA) − 1, where f is the band intensity, normalized to the total intensity of the scanned lane segment (from positions −64 to +77 in the gene). For YRW1 and naked DNA we used lanes 1 and 3, respectively. Negative numbers indicate protections; positive numbers indicate enhancements. Data are the average of two independent experiments; ς = 0.092.
FIG. 3.
Map of 5S rDNA. Upper strand, transcribed; lower strand, nontranscribed. Numbering is relative to the transcription start. Vertical arrows indicate major UV-induced pausing sites; vertical lines indicate minor UV-induced pausing sites. Solid squares indicate protection of ≥20%; solid circles indicate enhancements of ≥20% (symbols above and below the dotted line refer to the upper and lower strand, respectively). Bent arrow indicates transcription start. The DMS-protected residues (protection, ≥19%) are boxed, and the four KMnO4-reactive thymines, D1, D2, D3, and D4, are underlined. The Sau3AI restriction site indicated. TFIIIB and TFIIA in vitro-protected domains (thick horizontal lines) are as in reference 25 (nontranscribed strand). Primers A, B, and C are indicated by horizontal arrows.
UV-footprinting data suggest a low but detectable TFIIIB occupancy in vivo but do not allow any conclusion on the presence of other transcription factors. This could be due to the nature of the UV footprinting, which allows the detection of the presence of a DNA-protein interaction only when the protein has an effect, positive or negative, on the rotational flexibility of the DNA bases, influencing the efficiency of adduct formation. Moreover, although a clear UV footprint was shown for Xenopus TFIIIA bound to its binding site (44), the induced changes were modest even at very high occupancy. Liu et al. (33) recently showed that UV-induced photoproducts strongly inhibit Xenopus TFIIIA binding to 5S gene and that irradiation of the TFIIIA-5S complex displaces TFIIIA at doses that induce 0.8 to 2 cyclobutane pyrimidine dimers per 214 bp.
DMS footprinting.
UV footprinting allowed us to identify four sites on the upper strand and four on the lower strand that are significantly protected in vivo from damage by UV irradiation. This protection could be due to the binding of TFIIIB impeding free rotation of the adjacent bases to form the adducts. To support this hypothesis, we used a completely unrelated assay that can potentially give complementary information. DMS is a very reactive alkylating agent that methylates the N-7 of guanine (which is in the major groove) and to a lesser extent the N-3 of adenine (which is in the minor groove). Following the same logic as used above, we compared the methylation pattern of strains YRW1 and YSC14. Cells were treated with DMS and genomic DNA was purified and reacted with piperidine as described in Materials and Methods. Samples were primer extended and analyzed on denaturing acrylamide gels. Figure 2 shows the patterns obtained using primer A (Fig. 2A) and B (Fig. 2B) to primer extend genomic DNA from cells reacted for 1 and 3 min. The patterns appear very different from the untreated-DNA pausing pattern. Strong pausing is observed opposite most guanines and some adenines present on the template strand. The pattern does not change significantly from 1 to 3 min of reaction, but clear differences exist between the two strains. We quantified the bands of a portion of this pattern (indicated on the right side of Fig. 2A and B) by using a phosphoroimager system. Figure 2C and D show the overlapping densitometric profiles of the earlier time points of reaction for the two strains. At the top of the panels are indicated the positions of the residues protected from methylation in the YRW1 strain and the percent protection (obtained as the ratio of the normalized band intensities multiplied by 100). Of 13 guanines, 5 are significantly (see Materials and Methods) protected on the transcribed strand and 4 of 6 are protected on the nontranscribed strand inside the putative TFIIIB binding domain. In the same region, few adenines appear to be protected on the transcribed strand. Interestingly, the guanines present between positions −22 and −40 on both strands are poorly protected. In this segment of its binding domain, TFIIIB could adopt prevalent contacts in the minor groove, as recently suggested for a tRNA gene (35).
Other purines are protected downstream of the TFIIIB binding domain inside the putative RNA polymerase III TFIIIC and TFIIIA binding domains (Fig. 2C and data not shown). We also looked at protected purines upstream of the TFIIIB binding site: between positions −41 and −265 on the transcribed strand we identified just one significantly protected site (Fig. 2D and data not shown). All the significantly protected purines are boxed in the map is Fig. 3.
In summary, DMS footprinting identifies four protected residues on the nontranscribed strand and eight on the transcribed strand inside the TFIIIB putative binding domain. Protection spans from 23 to 47%, with an average value of 36%. This is in agreement with UV-footprinting data identifying four significantly protected sites on both strands with protection spanning from 23 to 36% and an average value of 32%.
KMnO4 hypereactivity of 5S rRNA chromosomal genes in vivo.
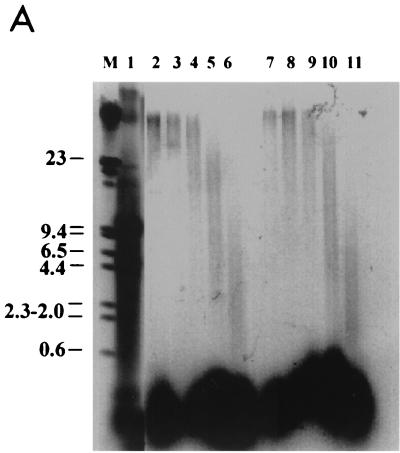
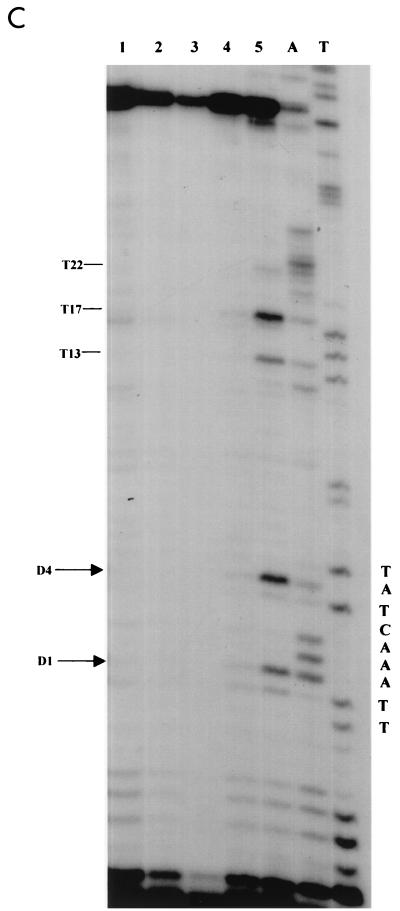
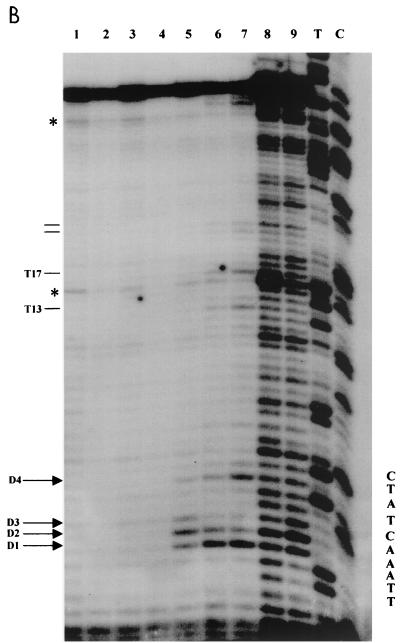
KMnO4 was previously used to study RNA polymerase III open-complex formation in vitro (25, 28). On a 5S gene, a defined set of hypereactive thymines has been identified on both strands after RNA polymerase III binding (25). A clear change in the reactivity pattern was observed when the transcription complex was allowed to elongate RNA to nucleotide 10. No major hypereactive sites were observed in the absence of polymerase. We have set up an experimental system to investigate KMnO4 reactivity on 5S genes in vivo. The assay (37) has been adjusted for use in yeast cells (20). Figure 4 shows the results of a titration of KMnO4 on exponentially growing cells: strain YRW1 (Fig. 4B) or YSC14 (Fig. 4C). After the cells were treated for 2 min at 22°C, the reaction was blocked and genomic DNA was purified as described in Materials and Methods. We then restricted the purified DNA with Sau3AI (site position indicated in Fig. 3) to create an end point for the subsequent primer extension. After restriction, the recovered DNA was primer extended with multiple Taq polymerase cycles using primer C (nontranscribed strand, Fig. 3). It is known that DNA polymerases are able to insert a base across from a thymine glycol residue but are then unable to continue their extension (23). In fact, for YRW1 we observed a series of KMnO4-dependent pausing sites opposite some of the thymines present on the transcribed strand. We also performed an alkali treatment to quantitatively convert the thymine glycols to urea residues. As expected, this piperidine treatment shifted the pausing pattern downward by one position (data not shown) but caused a strong G-specific background (reference 16 and references therein) that interferes with the assay. Inspection of the extension products of the in vivo-treated YRW1 samples (Fig. 4B, lanes 2 to 7) identified few in vivo-reactive thymines (indicated on the side), which were not especially reactive in naked DNA (lanes 8 and 9). Among them are the four thymines (−3, −6, −7, and −8, indicated as D4, D3, D2, and D1, respectively) that have been shown to specifically react in vitro on RNA polymerase III binding to form a complete binary complex (25). Control KMnO4 titration on strain YSC14 cells showed no reactivity for the same thymines with the exception of thymines D4 and D1, which react only at the highest reagent concentration, despite the similar overall reactivity of the two strains in vivo (Fig. 4A and C). We interpret the enhanced sensitivity observed on the four thymines in YRW1 cells as being caused by RNA polymerase binding and promoter melting in vivo. It should also be noticed that the reactivity pattern in the strain YRW1 changed with increasing reagent concentration, suggesting a multiple-hit condition with a subset of molecules simultaneously cut in the four positions. The qualitative and quantitative differences in sensitivity to KMnO4 between the two strains are confirmed by the results of the time course experiment presented in Fig. 5. From this experiment, it is also clear that the reaction does not proceed efficiently beyond the 30-s time point, probably due to fast oxidation of the reagent inside the cell.
FIG. 4.
KMnO4 titration on S. cerevisiae YRW1 and YSC14 cells. (A) YRW1 (lanes 2 to 6) and YSC14 (lanes 7 to 11) cells were treated with 4.5, 9, 18, 37, or 75 mM KMnO4 and genomic DNA was purified. Samples were heated for 3 min at 95°C in loading buffer (50 mM NaOH, 1 mM EDTA, 2.5% Ficoll; 0.25% bromocresol green) and run in a 1% agarose denaturing gel in 50 mM NaCl–50 mM NaOH–1 mM EDTA as running buffer. M, length markers; lane 1, untreated naked genomic DNA. (B) YRW1 cells were treated and genomic DNA was purified and restricted with Sau3AI as in Materials and Methods. Samples were primer extended with Taq polymerase (94°C for 45 s, 60°C for 1 min, and 72°C for 2 min for 30 cycles) using primer C (Fig. 3). Lanes: 1, unreacted naked genomic DNA; 2 to 7, cells treated for 2 min at 22°C with 2, 4.5, 9, 18, 37, or 75 mM KMnO4; 8 and 9, naked genomic DNA treated for 2 min at 22°C with 1 or 4 mM KMnO4; T and C, Sanger T and C sequencing lanes (a relevant portion of the sequence is reported). The position of in vivo-reactive pyrimidines is indicated on the side. Asterisks indicate KMnO4-independent pausing sites. (C) YSC14 cells were treated and genomic DNA was purified and restricted with Sau3AI as in Materials and Methods. Samples were primer extended with Taq polymerase (94°C for 45 s, 60°C for 1 min, and 72°C for 2 min for 30 cycles) using primer C (Fig. 3). Lanes; 1 to 5, cells treated for 2 min at 22°C with 4.5, 9, 18, 37, or 75 mM KMnO4; A and T, Sanger A and T sequencing lanes (a relevant portion of the sequence is reported). The position of in vivo-reactive pyrimidines is indicated on the side. Asterisks indicate KMnO4-independent pausing sites.
FIG. 5.
Time course of KMnO4 reaction on S. cerevisiae YRW1 and YSC14 cells. YRW1 (lanes 1 to 5) or YSC14 (lanes 6 to 10) cells were treated with 20 mM KMnO4 for 15, 30, 60, 120, or 240 s and genomic DNA was purified and restricted with Sau3AI as in Materials and Methods. Samples were primer extended with Taq polymerase (94°C for 45 s, 60°C for 1 min, and 72°C for 2 min for 30 cycles) using primer C (Fig. 3). A and T, Sanger A and T sequencing lanes (a relevant portion of the sequence is reported); M, PBR322 MspI marker lane. The positions of in vivo-reactive pyrimidines are indicated on the side.
We next determined the number of melted complexes present at steady state. To do so, we analyzed three independent KMnO4 titration experiments, identical to that presented in Fig. 4, to apply a quantitative evaluation of multiple-hit KMnO4 footprinting (41). The quantitative analysis was carried out as specified in Materials and Methods. The theoretical curves reported in Fig. 6 are the best global fit of the data of the three independent dose titration experiments to equations 2 to 5 (see Materials and Methods). The plots show that the shortest-pausing product (D1) accumulates steadily while the band intensities of the intermediate species (D2, D3, and D4) exhibit a maximum as a function of the KMnO4 concentration, as predicted by multiple-hit footprinting analysis. From these experiments we obtained a value for f, the percentage of the melted complexes specifically reactive on the four thymines in the wild-type strain. We obtained for f a best-fit average value of 11.64% (with a minimum of 8.11% and a maximum of 17.22%) at the 90% confidence level. The fit was not completely satisfactory for the D4 band at the highest KMnO4 concentration. This band is not cut very efficiently on in vitro assembled open complexes (25) and, indeed, showed some background in the YSC14 strain at high KMnO4 concentration. Although we subtracted this background, it is possible that we are still slightly overestimating the contribution of D4 to f. When we completely excluded D4 data from the best fit and considered only D1, D2, and D3, we obtained an average value of 8.7% for f (data not shown).
Effect of the chain terminator cordycepin on the KMnO4 hyperactivity of 5S rRNA chromosomal genes in vivo.
To confirm that open-complex formation is the rate-limiting step in 5S rRNA transcription in vivo, we made use of the chain terminator cordycepin, which is capable of entering yeast cells (24). We incubated the cells with a large amount of cordycepin triphosphate present in the culture broth. It could be entering the cells in this form or could be converted to cordycepin before uptake. When exponentially growing YRW1 cells were incubated with 4 mM cordycepin triphosphate, [α-32P]UTP incorporation was reduced to 15% ± 2.5% compared to the control, indicating a severe inhibition of RNA elongation. YRW1 cells were treated with KMnO4 after incubation with cordycepin triphosphate. As can be seen in Fig. 7, cordycepin triphosphate strongly increased KMnO4 reactivity at thymines D1 to D4 but also at several other positions along the transcribed strand (i.e., thymines 14, 18, and 23), consistent with its capability of slowing RNA elongation and promoter clearance. A control experiment with the YSC14 strain did not show any significant effect of incubation with cordycepin triphosphate on the KMnO4 reactivity pattern (data not shown).
DISCUSSION
The results of UV and DMS footprinting (Fig. 1 to 3), which are in very good qualitative and quantitative agreement, show a limited in vivo accessibility of the putative TFIIIB binding domain to the modifying agents in the wild-type strain compared with the nontranscribing control strain. Although the protection from UV and DMS caused by DNA-protein interactions is often incomplete, these data allow a minimal estimate of the percentage of 5S genes bound to the activator factor TFIIIB in vivo and fixes this number at 23 to 47% of all 5S chromosomal genes. We have quantified the background due to the effects of the in vivo chromatin structure on the UV- or DMS-induced pausing by analyzing strain YSC14, which is unable to form transcription complexes on chromosomal 5S genes but has an otherwise identical chromatin organization outside the vicinity of the 5S genes. Low-resolution micrococcal nuclease analysis (data not shown) identifies in both strains a clear protected region on the chromosomal 5S genes, and DNase I footprinting on isolated nuclei (data not shown) confirms, for the genes of both strains, the dominant rotational setting that was described previously (10). S. cerevisiae 5S genes are interspersed in the 150 to 200 rRNA RNA polymerase I tandem repeated transcription units. Dammann et al. (14) have used the intercalating drug psoralen to mark the active rRNA gene copies. Their conclusion was that about half of the transcription units were active in growing cells. In the same study, 5S genes showed lower accessibility, suggesting either a lower transcription complex occupancy or a lower impact of transcription on chromatin opening. Lee et al. (31) showed a DNase I cutting modulation on mutant 5S genes carried on plasmids. This footprinting was clearly visible on the 5′-flanking sequences that constitute the TFIIIB binding domain (bp −40 to +5), although a 10-bp periodicity of the modulation would suggest a possible contribution of chromatin structure. Since the mutant genes contained a structural marker mutation, the authors estimated that under growth conditions selective for the plasmid, 80 to 90% of the cellular 5S rRNA was derived from the mutant gene. Since the plasmid was present in 30 to 40 copies/cell versus the 150 to 200 chromosomal copies and since the footprint showed substantial but not complete protection, these data would suggest a TFIIIB maximum occupancy of 20 to 30% at the 5S gene promoters of these growing S. cerevisiae cells. The low transcription factor occupancy detected on the 5S genes seems to conflict with recent results demonstrating that there is a large excess of TFIIIB over the genes transcribed by RNA polymerase III (39), with TFIIIB being the limiting factor (38). On the other hand, overexpression of TFIIIB components has a stimulatory effect on some RNA polymerase III promoters (39), while its effect on 5S rDNA transcription has not been determined. Moreover, our experiments were performed at late-log-phase growth for technical reasons, and this could have reduced the number of genes transcribed as demonstrated by (38).
Having determined the minimal number of TFIIIB-5S genes complexes ready to be transcribed in vivo, we asked how many RNA polymerase III-melted promoters could be identified at steady state. The reagent KMnO4 has been successfully used to probe RNA-polymerase melted regions in vivo (37). We decided to apply a recently developed quantitative analysis of multiple-hit footprinting conditions (41) to count melted complexes at steady state. We again used strain YSC14 to carefully evaluate the background of the system. This strain, which is unable to form transcription complexes on 5S genes, shows a detectable reactivity at the thymines that are diagnostic of RNA polymerase III-melted complexes (25) only at very high reagent concentrations. On the other hand, strain YRW1 shows a good reactivity at D1, D2, D3, and D4 at fourfold-lower KMnO4 concentrations. Quantitative analysis of this reactivity fixes the steady-state number of melted complexes [OC] within experimental uncertainty at between 8 and 17% of the total number of 5S chromosomal genes (0.17 > [OC] > 0.08), with an average value of 11.6%.
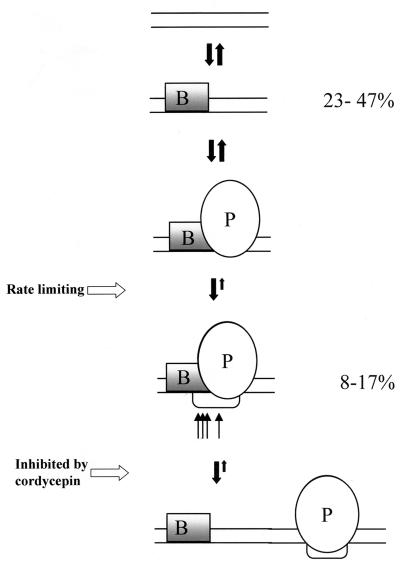
We cannot directly determine the number of closed complex, but from the UV- and DMS-footprinting data we have a minimal estimate of TFIIIB-bound promoters [BP] between 23 and 47% (0.47 > [BP] > 0.23). At steady state, the concentration of open promoter complexes is unchanged, and so the rate of formation is equal to the rate of clearance. Kinetically, this means that [BP] - [OC] multiplied by the apparent rate constant of binding the RNA polymerase III and forming open complexes (k′oc) must equal the product of the concentration of open complexes [OC] and the rate of promoter clearance due to chain initiation (kin): k′oc([BP] - [OC]) = kin[OC]. The calculation reveals which step principally limits transcription from this promoter in vivo. It is easy to see that in our case k′oc/kin = [OC]/[BP] - [OC] and is therefore centered around 1/3. Thus, as in the case for the lac L8:UV5 promoter analyzed in Escherichia coli cells (37), promoter clearance is not the rate-limiting step. In our case, k′oc also includes the rate of RNA polymerase binding to TFIIIB-promoter complex, thus complicating the interpretation of the results. On the other hand, it is quite reasonable to assume very fast RNA polymerase binding and recycling kinetics and slower promoter melting. These results are illustrated in Fig. 8.
FIG. 8.
Cartoon diagram illustrating the interpretation of the results presented. B, TFIIIB; P, RNA polymerase III; thin arrows, KMnO4-hypersensitive sites. The mechanism presented is purely hypothetical.
Analysis of open-complex formation in E. coli could take advantage of the use of rifampin, which traps open complexes in vivo (37), thus allowing a direct determination of the total number of RNA polymerase complexes potentially able to form open complexes and to use single-hit footprinting conditions. The chain terminator cordycepin triphosphate, if used at very high concentrations (4 mM) in the culture media, can considerably inhibit elongation (as proved by consistent reduction of [32P]UTP incorporation [see Materials and Methods]). On YRW1 cells, cordycepin triphosphate treatment strongly stimulates KMnO4 reactivity at several thymines in the transcribed strand (including D1, D2, D3, and D4), confirming our conclusion that RNA elongation is consistently slowed and promoter clearance becomes the rate-limiting step in vivo. The hypothesis that promoter melting is the crucial step in the overall transcription process is compatible with what has been observed in vitro (28) and with the drastic effects shown for the mutations that change thymines around the transcription start in vivo. By analogy to what has been observed in vitro (17) for a tRNA gene, Lee et al. (32) showed that deleting nucleotides from positions −10 to +2 has a severe effect on episomal 5S transcription in vivo. We think that our experimental system could be valuable to confirm that this effect operates at the level of promoter melting.
ACKNOWLEDGMENTS
We thank E. Di Mauro, M. Caserta, and E. P. Geiduschek for critical reading of the manuscript.
This work was supported by Fondazione “Istituto Pasteur Cenci Bolognetti,” MURST-cofinanziamento '99 Prot. 9905268484, MURST 5% “Biomolecole per la Salute Umana,” and the CNR Target Project on Biotechnology.
REFERENCES
- 1.Axelrod J D, Majors J. An improved method for photofootprinting yeast genes in vivo using Taq polymerase. Nucleic Acids Res. 1989;17:172–183. doi: 10.1093/nar/17.1.171. [DOI] [PMC free article] [PubMed] [Google Scholar]
- 2.Bartholomew B, Braun B R, Kassavetis G A, Geiduschek E P. Probing close DNA contacts of RNA polymerase III transcription complexes with the photoreactive nucleoside 4-thiodeoxythymidine. J Biol Chem. 1994;269:18090–18095. [PubMed] [Google Scholar]
- 3.Becker M M, Wang J C. Use of light for footprinting DNA in vivo. Nature. 1984;309:682–687. doi: 10.1038/309682a0. [DOI] [PubMed] [Google Scholar]
- 4.Becker M M, Lesser D, Kurpiewsky M, Baranger A, Jen-Jacobson L. Ultraviolet footprinting accurately maps sequence-specific contacts and DNA kinking in the EcoRI endonuclease-DNA complex. Proc Natl Acad Sci USA. 1988;85:6247–6251. doi: 10.1073/pnas.85.17.6247. [DOI] [PMC free article] [PubMed] [Google Scholar]
- 5.Becker M M, Wang Z. Visualising intimate protein-DNA contacts and altered DNA structures with ultraviolet light. Biomethods. 1991;5:59–69. [Google Scholar]
- 6.Bevington P R. Data reduction and error analysis for the physical sciences. New York, N.Y: Mc Graw-Hill Book Co.; 1969. [Google Scholar]
- 7.Bose S N, Kumar S, Davies R J H, Sethi S, McCloskey A. The photochemistry of d(T-A) in acqueous solution and in ice. Nucleic Acids Res. 1984;12:7929–7947. doi: 10.1093/nar/12.20.7929. [DOI] [PMC free article] [PubMed] [Google Scholar]
- 8.Braun B R, Riggs D L, Kassavetis G A, Geiduschek E P. Multiple states of protein-DNA interaction in the assembly of transcription complexes on Saccharomyces cerevisiae 5S ribosomal RNA genes. Proc Natl Acad Sci USA. 1989;86:2530–2534. doi: 10.1073/pnas.86.8.2530. [DOI] [PMC free article] [PubMed] [Google Scholar]
- 9.Braun B R, Bartholomew B, Kassavetis G A, Geiduschek E P. Topography of transcription factor complexes on the Saccharomyces cerevisiae 5S RNA gene. J Mol Biol. 1992;228:1063–1077. doi: 10.1016/0022-2836(92)90315-b. [DOI] [PubMed] [Google Scholar]
- 10.Buttinelli M, Di Mauro E, Negri R. Multiple nucleosome positioning with unique dominant setting for the Saccharomyces cerevisiae 5S rRNA gene in vitro and in vivo. Proc Natl Acad Sci USA. 1993;90:9315–9319. doi: 10.1073/pnas.90.20.9315. [DOI] [PMC free article] [PubMed] [Google Scholar]
- 11.Buttinelli M, Camilloni G, Costanzo G, Negri R, Venditti P, Venditti S, Di Mauro E. Mapping of yeast nucleosomes in vivo. Methods Mol Genet. 1995;6:169–185. [Google Scholar]
- 12.Camier S, Dechampesme A M, Sentenac A. The only essential function of TFIIIA in yeast is the transcription of 5S rRNA genes. Proc Natl Acad Sci USA. 1995;92:9338–9342. doi: 10.1073/pnas.92.20.9338. [DOI] [PMC free article] [PubMed] [Google Scholar]
- 13.Colbert T, Lee S, Schimmac G, Hahn S. Architecture of protein and DNA contacts within the TFIIIB-DNA complex. Mol Cell Biol. 1998;18:1682–1691. doi: 10.1128/mcb.18.3.1682. [DOI] [PMC free article] [PubMed] [Google Scholar]
- 14.Damman R, Lucchini R, Koller T, Sogo J M. Transcription in the yeast rRNA gene locus: distribution of the active gene copies and chromatin structure of their flanking regulatory sequences. Mol Cell Biol. 1995;15:5294–5303. doi: 10.1128/mcb.15.10.5294. [DOI] [PMC free article] [PubMed] [Google Scholar]
- 15.Englehorn M, Boccard F, Murtin C, Prenki P, Geiselmann J. In vivo interaction of the Escherichia coli integration host factor with its specific binding sites. Nucleic Acids Res. 1995;23:2959–2965. [PubMed] [Google Scholar]
- 16.Ferraboli S, Negri R, Di Mauro E, Barlati S. One lane chemical sequencing of 3′-fluorescent labelled DNA. Anal Biochem. 1993;214:566–570. doi: 10.1006/abio.1993.1539. [DOI] [PubMed] [Google Scholar]
- 17.Fruscoloni P, Zamboni M, Panetta G, De Paolis A, Tocchini Valentini G P. Mutational analysis of the transcription start site in the yeast tRNA (Leu3) gene. Nucleic Acids Res. 1995;23:2914–2918. doi: 10.1093/nar/23.15.2914. [DOI] [PMC free article] [PubMed] [Google Scholar]
- 18.Gasparro F P, Fresco J. Ultraviolet-induced 8,8-adenine dehydrodimers in oligo- and poly-nucleotides. Nucleic Acids Res. 1986;14:4239–4251. doi: 10.1093/nar/14.10.4239. [DOI] [PMC free article] [PubMed] [Google Scholar]
- 19.Geiduschek E P, Kassavetis G A. Comparing transcriptional initiation by RNA polymerase I and III Curr. Opin Cell Biol. 1995;7:344–351. doi: 10.1016/0955-0674(95)80089-1. [DOI] [PubMed] [Google Scholar]
- 20.Giardina C, Lis J T. DNA melting on yeast RNA polymerase II promoters. Science. 1993;261:759–761. doi: 10.1126/science.8342041. [DOI] [PubMed] [Google Scholar]
- 21.Giardina C, Lis J T. Dynamic protein-DNA architecture of a yeast heat shock promoter. Mol Cell Biol. 1995;15:2737–2744. doi: 10.1128/mcb.15.5.2737. [DOI] [PMC free article] [PubMed] [Google Scholar]
- 22.Huet J, Manud N, Dieci G, Peyroche G, Conesa C, Lefebvre O, Ruet A, Riva M, Sentenac A. RNA polymerase III and class III transcription factors from S. cerevisiae. Methods Enzymol. 1996;273:249–267. doi: 10.1016/s0076-6879(96)73024-0. [DOI] [PubMed] [Google Scholar]
- 23.Ide H, Kow Y W, Wallace S S. Thymine glycols and urea residues in M13 DNA constitute replicative blocks in vitro. Nucleic Acids Res. 1985;13:8035–8052. doi: 10.1093/nar/13.22.8035. [DOI] [PMC free article] [PubMed] [Google Scholar]
- 24.Iwashima A, Kawasaki K, Nosaka K, Nishimura H. Effects of thiamin on cordycepin sensitivity in Saccharomyces cerevisiae. FEBS Lett. 1992;311:60–62. doi: 10.1016/0014-5793(92)81367-u. [DOI] [PubMed] [Google Scholar]
- 25.Kassavetis G A, Braun B R, Nguyen L H, Geiduschek E P. S. cerevisiae TFIIIB is the transcription factor proper of RNA polymerase III, while TFIIIA and TFIIIC are assembly factors. Cell. 1990;60:235–245. doi: 10.1016/0092-8674(90)90739-2. [DOI] [PubMed] [Google Scholar]
- 26.Kassavetis G A, Bartholomew B, Blanco J A, Johnson T E, Geiduschek E P. Two essential components of the Saccharomyces cerevisiae TFIIIB: transcription and DNA-binding properties. Proc Natl Acad Sci USA. 1991;88:7308–7312. doi: 10.1073/pnas.88.16.7308. [DOI] [PMC free article] [PubMed] [Google Scholar]
- 27.Kassavetis G A, Joazeiro C A P, Pisano M, Geiduschek E P, Colbert T, Hahn S, Blanco J A. The role of the TATA-binding protein in the assembly and function of the multisubunit yeast RNA polymerase III transcription factor, TFIIIB. Cell. 1992;71:1055–1064. doi: 10.1016/0092-8674(92)90399-w. [DOI] [PubMed] [Google Scholar]
- 28.Kassavetis G A, Blanco J A, Johnson T E, Geiduschek E P. Formation of open and elongating transcription complexes by RNA polymerase III. J Mol Biol. 1992;226:47–58. doi: 10.1016/0022-2836(92)90123-2. [DOI] [PubMed] [Google Scholar]
- 29.Kassavetis G A, Bardeleben C, Kumar A, Ramirez E, Geiduschek E P. Domains of the Brf component of RNA polymerase III transcription factor IIIB (TFIIIB); functions in assembly of the TFIIIB-DNA complexes and recruitment of RNA polymerase to the promoter. Mol Cell Biol. 1997;17:5299–5306. doi: 10.1128/mcb.17.9.5299. [DOI] [PMC free article] [PubMed] [Google Scholar]
- 30.Lampton M, Margon B, Bowyer S. Parameter estimation in X-ray astronomy. Astrophys J. 1976;208:177–190. [Google Scholar]
- 31.Lee Y, Erkine A M, Van Ryk D I, Nazar R N. In vivo analyses of the internal control region in the 5S rRNA gene from Saccharomyces cerevisiae. Nucleic Acids Res. 1995;23:634–640. doi: 10.1093/nar/23.4.634. [DOI] [PMC free article] [PubMed] [Google Scholar]
- 32.Lee Y, Wong W M, Guyer D, Erkine A M, Nazar R N. In vivo analyses of upstream promoter sequence elements in the 5S rRNA gene from Saccharomyces cerevisiae. J Mol Biol. 1997;269:676–683. doi: 10.1006/jmbi.1997.1071. [DOI] [PubMed] [Google Scholar]
- 33.Liu X, Conconi A, Smerdon M J. Strand-specific modulation of uv photoproducts in 5S rDNA by TFIIIA binding and their effects on TFIIIA complex formation. Biochemistry. 1997;36:13710–13717. doi: 10.1021/bi9716736. [DOI] [PubMed] [Google Scholar]
- 34.Marquardt D W. An algorithm for least square estimations of non linear parameters. J Soc Ind Appl Math. 1963;11:431–441. [Google Scholar]
- 35.McBryant S J, Baird E E, Trauger J W, Dervan P B, Gottesfeld J M. Minor groove DNA-protein contacts upstream of a tRNA gene detected with a synthetic DNA binding ligand. J Mol Biol. 1999;286:973–981. doi: 10.1006/jmbi.1999.2539. [DOI] [PubMed] [Google Scholar]
- 36.Moore P D, Bose K K, Rabkin S D, Strauss B S. Sites of termination of in vitro sinthesis on ultraviolet- and N-acetylaminofluorene-treated ΦX174 templates by procaryotic and eukaryotic DNA polymerases. Proc Natl Acad Sci USA. 1981;78:110–114. doi: 10.1073/pnas.78.1.110. [DOI] [PMC free article] [PubMed] [Google Scholar]
- 37.Sasse-Dwight S, Gralla J D. KMnO4 as a probe for lac promoter DNA melting and mechanism in vivo. J Biol Chem. 1989;264:8074–8081. [PubMed] [Google Scholar]
- 38.Sethy I, Moir R D, Librizzi M, Willis I. In vitro evidence for growth regulation of tRNA gene transcription in yeast. J Biol Chem. 1995;270:28463–28470. doi: 10.1074/jbc.270.47.28463. [DOI] [PubMed] [Google Scholar]
- 39.Sethy-Coraci I, Moir R D, Lopez-de-Leon A, Willis I M. A differential response of wild type and mutant promoters to TFIIIB70 overexpression in vivo and in vitro. Nucleic Acids Res. 1998;26:2344–2352. doi: 10.1093/nar/26.10.2344. [DOI] [PMC free article] [PubMed] [Google Scholar]
- 40.Tennant A F. NASA technical memorandum 4301. Washington, D.C.: National Aeronautics and Space Administration; 1991. [Google Scholar]
- 41.Tsodikov O V, Craig M L, Saecker R M, Record M T., Jr Quantitative analysis of multiple-hit footprinting studies to characterize DNA conformational changes in protein-DNA complexes: application to DNA opening by Eς70 RNA polymerase. J Mol Biol. 1998;283:757–769. doi: 10.1006/jmbi.1998.2130. [DOI] [PubMed] [Google Scholar]
- 42.Vogelauer M, Cioci F, Camilloni G. DNA-protein interactions at the Saccharomyces cerevisiae 35S rRNA promoter and in its surrounding region. J Mol Biol. 1998;275:197–209. doi: 10.1006/jmbi.1997.1451. [DOI] [PubMed] [Google Scholar]
- 43.Wang S I. Photochemistry and photobiology of nucleic acids. 1 and 2. New York, N.Y: Academic Press, Inc.; 1976. [Google Scholar]
- 44.Wang Z, Becker M M. Selective visualization of gene structure with ultraviolet light. Proc Natl Acad Sci USA. 1988;85:654–658. doi: 10.1073/pnas.85.3.654. [DOI] [PMC free article] [PubMed] [Google Scholar]
- 45.White R J. Transcription factor TFIIIB. An important determinant of biosynthetic capacity that is targeted by tumor suppressors and transforming proteins. Int J Oncol. 1998;12:741–748. [PubMed] [Google Scholar]


