Abstract
Photodynamic treatment is a promising tool for the therapy of multidrug-resistant bacteria. In this study, we highlight photosensitizer-loaded hydrogels as an application system for infected wounds. The poly(ethylene glycol) diacrylate-based and electron beam-polymerized hydrogels were mechanically stable and transparent. They were loaded with two photoactive, porphyrin-based drugs – tetrakis(1 methylpyridinium-4-yl)porphyrin p-toluenesulfonate (TMPyP) and tetrahydroporphyrin – p toluenesulfonate (THPTS). The hydrogels released a sufficient amount of the photosensitizers (up to 300 μmol l−1), relevant for efficiency. The antimicrobial effectivity of loaded hydrogels was investigated in a tissue-like system as well as in a liquid system against a multiresistant Escherichia coli. In both systems, light induced eradication was possible. In contrast, hydrogels alone showed only minor antimicrobial activity. Furthermore, the loaded hydrogels were successfully tested against seven multidrug-resistant bacterial strains, namely Enterococcus faecium, Staphylococcus aureus, Klebsiella pneumonia, Acinetobacter baumannii, Pseudomonas aeruginosa, Escherichia coli and Achromobacter xylosoxidans. The eradication of these pathogens, except A. xylosoxidans, was successfully demonstrated. In general, TMPyP-loaded hydrogels were more effective than THPTS-loaded ones. Nevertheless, both photosensitizers displayed effectivity against all investigated bacteria strains. Taken together, our data demonstrate that photosensitizer-loaded hydrogels are a promising new tool to improve the treatment of wounds infected with problematic bacterial pathogens.
Photodynamic treatment is a promising tool for the therapy of multidrug-resistant bacteria.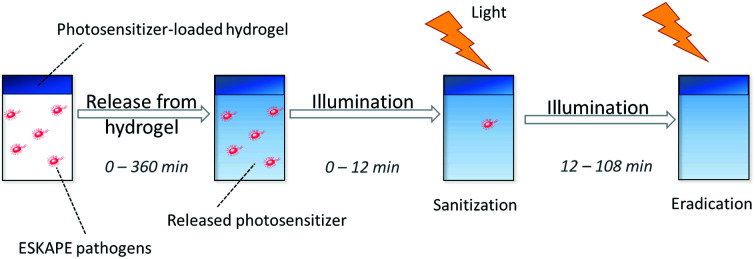
1. Introduction
Nowadays, multidrug-resistant bacteria and microorganisms pose one of the most urgent challenges for humankind.1 Multiple microorganisms have been reported to become resistant against an increasing number of antibiotics. In contrast, the development of new antibiotics has remained nearly static since the end of the last century until today.2,3 Therefore, the possibility of antimicrobial treatment for hard-to-treat multidrug-resistant bacterial infections is currently limited to a small number of last resort antibiotics (e.g. Tigercyclin, Colistin, Ciprofloxacin).4 Thus, more than 700 000 deaths per year are caused by resistant bacteria today.5
The leading cause of infections with multidrug-resistant bacteria throughout the world are the so-called ESKAPE pathogens.6 These pathogens are multidrug-resistant Enterococcus faecium, Staphylococcus aureus, Klebsiella pneumonia, Acinetobacter baumannii, Pseudomonas aeruginosa, Enterobacter spp.7 The ESKAPE pathogens are responsible for most of the nosocomial, multidrug-resistant infections. These pathogens do not only result in higher mortality and extended hospitalization; they also lead to additional high economic costs. In high-income states (e.g. the United States or the countries of the European Union), the ESKAPE pathogens generate costs of several billion US dollar per year.6 Additionally, they represent the most common resistances and transmission mechanisms.8 The problem of antibiotic resistance is even more urgent, if one considers, that antibiotics save more lives than any other kind of drugs.9
Therefore, new effective treatments are required to handle these pathogens. One promising strategy is the so-called photodynamic therapy or photodynamic inactivation of bacteria using photoactive drugs called photosensitizers. These photosensitizers (that by themselves do not show any or little antimicrobial activity) can absorb light and transfer its energy to natural triplet state oxygen from the air or cell metabolisms. Thereby, the oxygen reacts to singlet oxygen or other reactive oxygen species (ROS), such as superoxide radicals, or hydroxyl radicals.10,11 These ROS are known to be cytotoxic, especially for bacteria, fungi and cancer cells. Therefore, photosensitizers can be used as antimicrobial agents in the photodynamic inactivation of bacteria.12–14 Nowadays, almost all approved photosensitizers are porphyrins and porphyrin derivates.15–17 Porphyrin derivates such as chlorin, bacteriochlorin or phthalocyanine are gaining interest, because they show similar antimicrobial properties to porphyrins but differ in their optical properties. This is significant in medical application since light of different wavelengths has varying penetration depths in human tissue.18 For this reason, two porphyrin-based photosensitizers (a porphyrin and a bacteriochlorin, respectively) 5,10,15,20-tetrakis(1-methyl-4-pyridinio)porphyrin tetra(p-toluene-sulfonate) (TMPyP) and 5,10,15,20-tetrakis(1-methyl-3-pyridyl)-21H,23H-7,8,17,18-tetrahydroporphyrin tetra(p-toluene-sulfonate) (THPTS), that differ in their light absorption properties, were chosen in this work. Both photosensitizers have been reported to have antibacterial properties previously.19–21 Additionally, both photosensitizers are cationic. While anionic photosensitizers are ineffective against several bacteria, cationic photosensitizers have shown high efficiency in the past.22,23 Therefore, the two cationic porphyrin-like photosensitizers – TMPyP and THPTS – have been chosen for this study.
Photodynamic inactivation using locally applied photoactive drugs is an attractive strategy for the treatment of wounds infected with multidrug-resistant bacteria. Here, an attractive application strategy allowing the local long-term application of photoactive drugs is still missing today. One problem is the general opaqueness of bandages. Since photosensitizers need light for activation, bandages currently used have to be removed from wounds to enable application of the drug. This procedure can be, however, painful for patients, especially in case of infected large-scale wounds. Therefore, in this study, hydrogels were used as a carrier system for photosensitizers.24,25 Hydrogels have been used as wound patches and bandages for several years.26–30 They provide a humid matrix for wound, which is beneficial for wound healing.26 Moist wound dressings can accelerate the epitalization of wounds and can reduce the number of serious complications like wound contractions.31,32 Furthermore, hydrogels can absorb high amounts of wound exudate and are easy to use.27 In addition, they have been used as drug delivery systems for several medical applications.33–36 Usually hydrogels are not transparent. The hydrogels in this study, however, were translucent and can act as a carrier system for photosensitizers. Therefore, the photoactive drug can be illuminated and activated without removal of the bandage.
2. Materials & methods
2.1. Materials
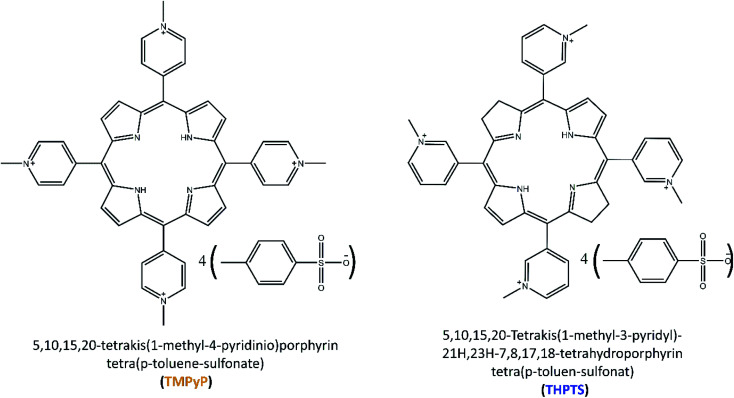
Poly(ethylene glycol) diacrylate (PEGDA) with an average molar mass of 700 g mol−1, and phosphate-buffered saline (PBS) were purchased from Sigma Aldrich (St. Louise, MI, USA). 5,10,15,20-tetrakis(1-methyl-4-pyridinio)porphyrin tetra(p-toluene-sulfonate) (TMPyP) was purchased from TCI Chemicals (Tokyo, Japan). 5,10,15,20-Tetrakis(1-methyl-3-pyridyl)-21H,23H-7,8,17,18-tetrahydroporphyrin tetra(p-toluene-sulfonate) (THPTS) was purchased from TetraPDT GmbH (Rackwitz, Germany). All chemicals were used without further purification. Water was purified using a Merck ultrapure water system (Burlington, VT, USA). The chemical structures of TMPyP and THPTS are displayed (Fig. 1). in 0.9% (w/v) NaCl solution was purchased from BBraun (Melsungen, Germany).
Fig. 1. Chemical structures of TMPyP (left) and THPTS (right).
The multiresistant bacteria strains E. coli (Seq.-no.: 443733), S. aureus (Seq.-no.: 617953), E. faecium (Seq.-no.: 432107), A. baumannii (Seq.-no.: 127028), P. aeruginosa (Seq.-no.: 119769), K. pneumonia (Seq.-no.: 429421) and A. xylosoxidans (Seq.-no.: 802518) were isolated at the University Hospital Leipzig. The resistance patterns are displayed in Tables S1–S7 in the ESI.† Blood agar plates, containing 10% sheep blood (w/v), were prepared on-site at the Institute of Medical Microbiology at the University Hospital Leipzig.
2.2. Hydrogel synthesis and loading
For the preparation of the electron-beam-cured hydrogels, a formulation containing 30 wt% PEGDA in PBS was fabricated and injected into a glass mold (Fig. 2). The self-made mold was built from two glass plates separated by a ring-shaped silicon spacer. Diameter and thickness can be continuously varied by spacer thickness with respect to the application. The formulation was slowly injected by a syringe via an inlet.
Fig. 2. Schematic graphic of the mold for the hydrogel preparation.
The spacer between the glass plates was set to 300 μm. The formulation was polymerized using a 10 MeV linear electron accelerator (MB10-30 MP, Mevex Corp, Stittville, ON, Canada). A dose of 6 kGy (determined by standard graphite calorimetry) was applied at once as described before.25 The resulting gels had a homogenous thickness of 300 μm in swollen state and were washed twice for 1 h in PBS (pH = 7.4). Afterwards, the hydrogels were washed three times in Milli-Q water and cut into round discs. Afterwards, the hydrogels were dried for 24 h at room temperature (25 °C). The discs had a diameter of 25 mm for DMA (dynamic mechanical analysis) and UV/VIS transmittance analysis and 6 mm for antimicrobial testing.
The hydrogel loading was performed as described elsewhere.37 In short, the hydrogels for antimicrobial testing were loaded with TMPyP and THPTS, respectively. The 6 mm hydrogel discs (Vswollen hydrogel ≈ 10 μl) were immersed in an 800 μM photosensitizer solution for 48 h. 100 μl solution per disc were applied.
2.3. Dynamic mechanical analysis
Dynamic modulus G* and loss factor tan(δ) were determined using a MCR300 rheometer (Anton Paar, Graz, Austria) device. The rheometer was equipped with a 25 mm probe head. The probe head was pressed on the sample with 10 N at 25 °C. Hydrogels were analyzed in dry state because the hydrogels will be applied to the skin in dry state so they can absorb the wound exudate. The dried samples had an average thickness of 210 μm and a diameter of 25 mm. All values were recorded at an amplitude of 1% and an oscillation frequency of 1 Hz.
2.4. UV/VIS absorbance and transmittance
The absorbance spectra of the THPTS and TMPyP as well as the transmittance of the dried hydrogels were investigated using an UV-2101PC UV/VIS spectrometer (Shimadzu, Kyoto, Japan). The studied range was set to 200–800 nm with 0.5 nm step width. Samples had an average thickness of 210 μm.
2.5. Swelling ratio
The dry, unloaded hydrogels were placed for 24 h in 0.9% (w/v) NaCl solution to swell. The swelling ratio (q) was determined as a ratio of mwet (mass of the wet hydrogel after swelling) and mdry (mass of the dry hydrogel) as shown in the following equation.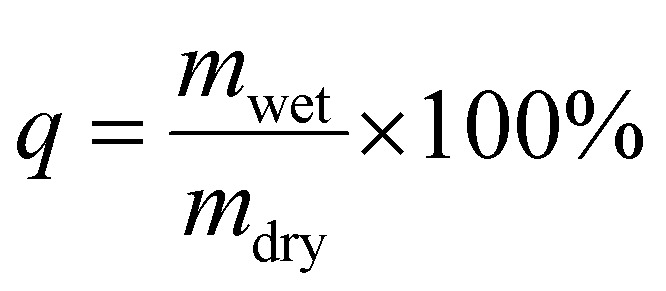
2.6. Release studies
The hydrogel was loaded with photosensitizers as described in Section 2.2 and dried. Hydrogels with a diameter of 6 mm were immersed in 100 μl of a 0.9% (w/v) NaCl solution (Vswollen = 10 μl). Subsequently, the photosensitizer was released to the solution. The concentration of the photosensitizer (TMPyP and THPTS, respectively) in the solution was determined after 0, 30, 45, 60, 90, 135, 180, 270 and 360 min by UV/VIS spectroscopy. An Infinite M200 reader from Tecan (Maennedorf, Switzerland) was used.
2.7. Qualitative antibacterial testing
Blood agar plates with a diameter of 33 mm were inoculated with 25 μl of an ESBL (extended spectra beta-lactamase) E. coli suspension. The suspension had a concentration of 1.5 × 10⁸ CFU ml−1 (colony forming unites per milliliter). Photosensitizer-loaded hydrogels of 6 mm diameter were placed on the plates and 10 μl of a 0.9% (w/v) NaCl solution were added on top of the gels. The plates were placed in an incubator at 37 °C in water-saturated atmosphere containing 5% CO2. The photosensitizer was released from the hydrogel during the release time (t1). Afterwards, the plates were illuminated with a 420 nm LED array and a light dose of 13 mW cm−2 for samples loaded with TMPyP,38 while THPTS-loaded samples were activated using an LED with 760 nm and a light dose of 18 mW cm−2. As reference, non-loaded hydrogels were treated in the same way (referred as light control). The release time (t1) and the illumination time (t2) were varied in individual experiments.
Additionally, a dark control was prepared to analyze the dark toxicity of the photosensitizers and the hydrogels. Here, experiments were performed using an identical procedure to the experiment described before, but without illumination of the samples.
At the end, all samples were incubated in an incubator at 37 °C in water-saturated atmosphere containing 5% CO2 for 16–18 h. The diameter of the resulting inhibition area without bacteria growth was measured (inhibition zone).
2.8. Quantitative antibacterial testing
Dried, photosensitizer-loaded hydrogels with a diameter of 6 mm were placed in 96 well plates. 100 μl 0.9% (w/v) NaCl solution were added on the hydrogels. Then, the samples were placed in an incubator at 37 °C in water-saturated atmosphere containing 5% CO2. The photosensitizer released from the hydrogel during this release time (t1). In a next step, 100 μl ESBL E. coli suspension (3 × 10⁸ CFU ml−1) were added to each well. After 4 min the samples were illuminated with an LED array. For samples loaded with TMPyP an LED array with a wavelength of 420 nm and a light dose of 13 mW cm−2 was used.38 THPTS-loaded samples were activated using an LED with 760 nm and a light dose of 18 mW cm−2. As reference, non-loaded hydrogels were treated in the same way (referred as light control). The release time (t1) and the illumination time (t2) were varied in individual experiments.
Additionally, a dark control was prepared to analyze the dark toxicity of the photosensitizers. Here, experiments were performed using an identical procedure to the experiment described before, but without illumination of the samples.
The resulting solutions were dissolved 1 : 10, 1 : 1000 and 1 : 10 000 in 0.9% NaCl solution. 100 μl of the serial dilution were injected on blood agar plates. The grown colonies were counted after an incubation time of 16–18 h.
Further experiments were performed using a similar procedure for the ESKAPE pathogens S. aureus, E. faecium, A. baumannii, P. aeruginosa, K. pneumonia and the multiresistant bacteria strain A. xylosoxidans. The release time and the illumination time were set to 90 min and 36 min, respectively.
3. Results & discussion
3.1. Appearance and properties of the hydrogels
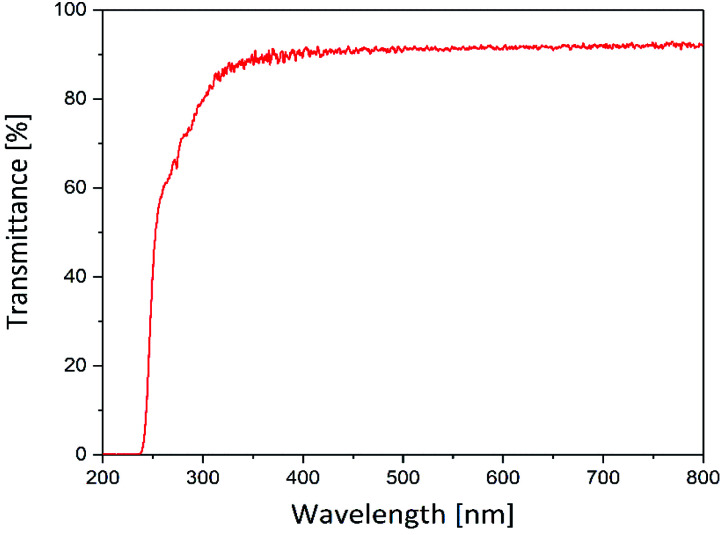
The suitability of the hydrogels prepared in this study as carriers for photosensitizers was tested initially. Therefore, their optical transmission was analyzed to ensure sufficient illumination of the photoactive drug even below a wound dressing, formed by this hydrogel. Fig. 3 displays the transmittance of the hydrogel matrix in the visible and UV spectral range.
Fig. 3. UV/VIS transmittance of the hydrogels (thickness = 210 μm) in the range of 200 to 800 nm.
The hydrogels were translucent in the range of 250–800 nm. In the range of 350–800 nm the transmittance was 92%. Below 350 nm the transmittance decreases and falls towards zero beyond 250 nm. However, the hydrogels showed a high transmittance (≥90%) within the visible light range. Since most photosensitizers, especially porphyrin-based photosensitizers (see Section 3.2), absorb light between 400 and 800 nm the hydrogels are suitable for application in the photodynamic inactivation of bacteria.
Apart from the application as a carrier for photosensitizers, the hydrogels prepared in this study will be used simultaneously as wound patches. Thus, the material has to provide mechanical properties alike human skin, to deliver adequate protection for the wounds. However, since skin is a highly anisotropic and complex tissue, the values of shear modulus and Young's modulus vary between 25 kPa and 1 × 10⁵ kPa depending on the location of the analyzed skin and the characterization method.39 The mechanical properties of the hydrogel are displayed in Table 1.
Mechanical properties recorded at 1 Hz.
| Shear modulus G* [kPa] | 261 ± 23 |
| Loss factor tan(δ) | 0.026 ± 0.002 |
| Crosslinking density [mmol l−1] | 105 ± 9 |
| Mesh size [nm] | 2.5 ± 0.1 |
| Swelling ratio | 283 ± 11% |
The hydrogels synthesized in this study provide a dynamic modulus of 261 ± 23 kPa, which is in the aspired range.
The crosslinking density and the mesh size were calculated from the storage modulus. Both impact the drug release behavior (amount and velocity).25 A large mesh size leads to rapid drug release.40 In contrast, hydrogels with a smaller mesh size in the nanometer range – e.g. 2.5 nm for the here-described hydrogels – provide slow release velocities and therefore extended release time scales of several hours or even days.
Additionally, the swelling ratio was determined. The swelling ratio is important for the exudate uptake. The hydrogels had a swelling ratio of 283 ± 11%. That means, they can absorb about three times their own weight of water or wound exudate. This makes the hydrogels well suitable for the application as wound patch.
3.2. Properties of the photosensitizers
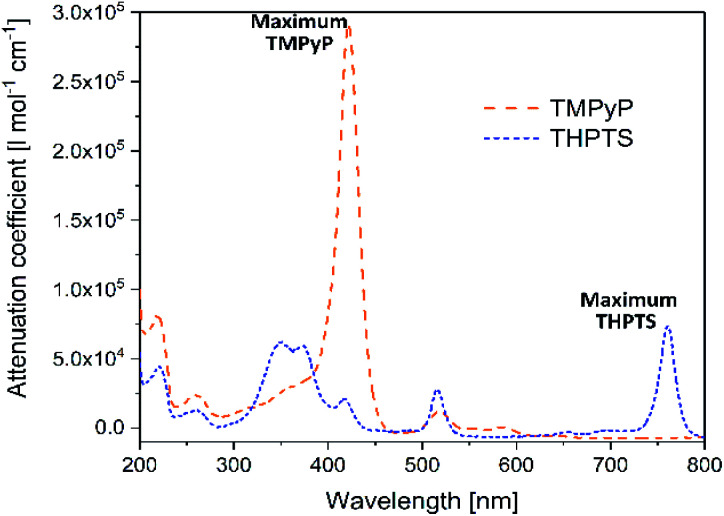
As already mentioned in Section 3.1, in the photodynamic inactivation of bacteria, the photosensitizer needs to be activated in the infected tissue by illumination with light. Thus, for application in the hydrogel carrier system the ideal photosensitizer has to absorb light with a wavelength >350 nm as the hydrogel is transparent in this spectral range. The spectral properties of the photosensitizers TMPyP and THPTS – determined by UV/VIS spectroscopy – are displayed in Fig. 4.
Fig. 4. UV/VIS spectra of TMPyP and THPTS. Dashed, orange line corresponds to TMPyP and dotted, blue line corresponds to THPTS.
Both photosensitizers showed the characteristic spectral properties of porphyrins and bacteriochlorins, respectively.41,42 The Soret band of TMPyP which was the band with strongest absorption was detected at 422 nm (ε422 nm = 2.97 × 10⁵ l mol−1 cm−1). Furthermore, the Q bands of TMPyP were detected at 518 nm (ε518 nm = 1.7 × 10⁴ l mol−1 cm−1), 555.5 nm (ε555.5 nm = 7 × 10³ l mol−1 cm−1) and 583 nm (ε583 nm = 8 × 10³ l mol−1 cm−1). THPTS showed a spectra with Soret bands at 350 nm and 375 nm (ε550 nm = 6.9 × 10⁴ l mol−1 cm−1 and ε375 nm = 6.5 × 10⁴ l mol−1 cm−1, respectively), and Q bands at 516 nm (ε516 nm = 3.4 × 10⁴ l mol−1 cm−1) and 761 nm (ε761 nm = 8.0 × 10⁴ l mol−1 cm−1). The band at 761 nm was the band with the strongest absorption.
The maximum absorption band of TMPyP was at 422 nm and at 761 nm for THPTS, respectively. For this reason, two illumination systems with these wavelengths were chosen to activate the photosensitizers. Thus, TMPyP and THPTS absorbed light in the desired spectral range and were suitable for the application in the hydrogels described here. Since the hydrogels were translucent at wavelengths above 350 nm.
Even though THPTS had a lower attenuation coefficient, the effectivity in human tissue can be higher than in the case of TMPyP because of the higher penetration depth of light with the larger wavelength of 760 nm in human tissue. While light with a wavelength of 415 nm penetrates human tissue to only a few mm, light with a wavelength of 760 nm can pass to areas 5 to 6 times as deep.18 Therefore, a bacteriochlorin-based photosensitizer is highly promising for photodynamic inactivation of bacteria, especially for skin-related applications such as wound healing.
3.3. Release studies
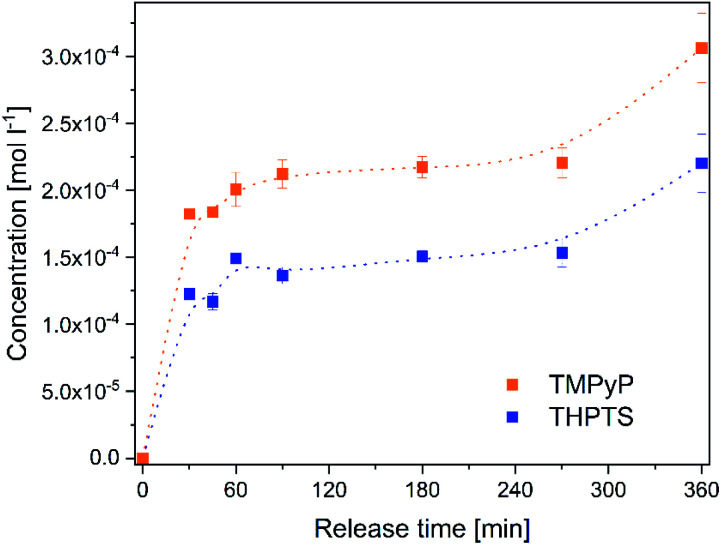
The release of the photosensitizers into a solution isotonic to blood (Fig. 5) was determined to estimate the concentration of photosensitizer in the target tissue. Both photosensitizers were released to the solution. The release time of 6 h is in very good agreement with the planned application. In wound treatment a wound patch will stay on the wound for several hours and will be changed afterwards. No saturation of the photosensitizers occurred in the analyzed period.
Fig. 5. Concentration of the photosensitizers TMPyP (orange dots) and THPTS (blue squares) released from the hydrogels to a 0.9% NaCl-solution within 0–360 min.
The concentration increased continuously within 360 min. After 6 h the concentration of TMPyP in the solution was 300 ± 26 μmol l−1 and the concentration of THPTS was 220 ± 22 μmol l−1. This corresponds to 38% (TMPyP) and 28% (THPTS) of amount of photosensitizer in the hydrogels, respectively. The concentration determined in this study is in good agreement to former, successful clinical studies. E.g. Mroz et al. applied 500 μmol l−1 of a photosensitizer and observed a significant reduction of bacteria colonization in wounds and diabetic foot ulcers.43
3.4. Antimicrobial performance
Subsequently, the antimicrobial effect of the photosensitizer-loaded hydrogels was analyzed. Thus, the hydrogels were placed on blood agar plates. The blood agar plates were inoculated with an ESBL (extended spectrum beta lactamases) producing E. coli (resistance pattern see Table S1†), which were used to simulate an infected wound. The ESBL E. coli was chosen because it is a very common pathogen in wounds and well-studied.44,45 Additionally, the photodynamic inactivation of Gram-negative bacteria like E. coli is often ineffective and they are hard to treat.46,47 Therefore, this pathogen is interesting for this study.
The samples were illuminated with a wavelength of 420 nm (in case of TMPyP) or 760 nm (in case of THPTS), respectively. An example for the resulting samples using TMPyP is shown in Fig. 6 (sample using THPTS see Fig. S1†). Obviously, there was no bacteria growth (grayish film) below and next to the illuminated, loaded hydrogels (Fig. 6 left). Thereby, a dark red corona is visible. On the contrary, neither in the dark control nor in the non-loaded samples such an inhibition zone was detected. Therefore, the antimicrobial effect was affiliated to the phototoxic effect of the photosensitizer-loaded hydrogels.
Fig. 6. Example of loaded hydrogel samples on blood agar plates. Left: sample loaded with photosensitizer (TMPyP) + illumination. Middle: sample without photosensitizer + illumination (light control). Rigth: sample loaded with photosenitizer without illumination (dark control). Hydrogels are surrounded by white dashed circles for better visualization.
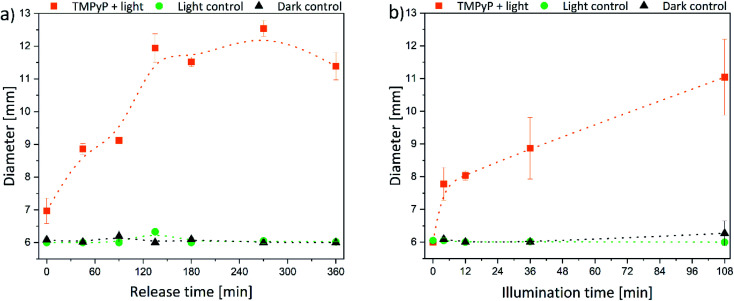
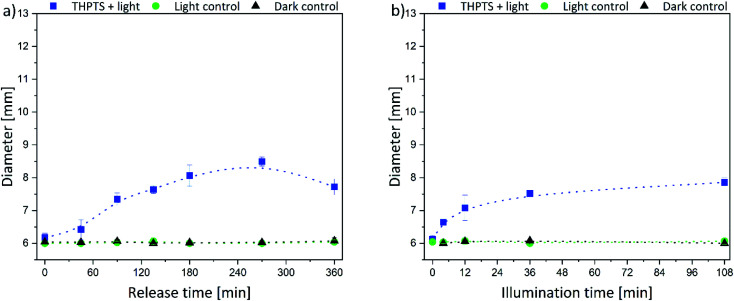
The size of the corona around the hydrogels can be related to the penetration depth of photosensitizers in human tissue since the agar is a wound-like matrix. Therefore, the diameter of the inhibition zone next to the hydrogels is displayed in Fig. 7 and 8.
Fig. 7. Diameter of the inhibition zone for TMPyP-loaded hydrogels depending on (a) release time (illumination time fixed to 36 min) and (b) the illumination time (release time fixed to 90 min) (the intergroup differences between the samples and the dark control were statistically significant (P < 0.05) for all illumination durations equal to or greater than 4 min (two-tailed t-test; n ≥ 3)).
Fig. 8. Diameter of the inhibition zone for THPTS-loaded hydrogels depending on the (a) release time (illumination time fixed to 36 min) and (b) the illumination time (release time fixed to 90 min) (the intergroup differences between the samples and the dark control were statistically significant (P < 0.05) for all illumination durations equal to or greater than 4 min (two-tailed t-test; n ≥ 3)).
The size of the inhibition zone was dependent on the time of release and illumination, respectively. For TMPyP-loaded hydrogels, the corona increased linearly with longer release time (Fig. 7a). The effect of the illumination time was similar (Fig. 7b). However, the size of the inhibition zone increased up to a release time of 135 min. With a release time of 135–360 min the diameter remained almost constant between 11.5 and 12.5 mm because through the slow diffusion within the matrix, the local concentration no longer increased. Therefore, only next to the hydrogels a sufficient amount of photosensitizer for inhibition of bacteria growth was present. The largest diameter of 12.5 mm was detected after 270 min release and 36 min illumination. Additionally, the diameter of the inhibition zone was increasing with increasing illumination time.
The same trend was determined for the THPTS-loaded samples. The size of the inhibition zone increased with increasing release (Fig. 8a) and illumination time (Fig. 8b). In general, the corona was smaller than in the case of the TMPyP-loaded hydrogels and did not rise above 8.5 mm (at 270 min release time and 36 min illumination). Since the released amount and the attenuation coefficient of THPTS were lower compared to TMPyP, the inhibition zone was smaller. Nevertheless, the penetration depth of 760 nm in human tissue is higher than that of 415 nm.18 Therefore, the effectivity in human tissue might be different. However, light can penetrate tissue 1 mm up to about 20 mm depending on the wavelength of the applied light.18,48 Thus, the penetration depth of the photosensitizer fits very well with the penetration depth of light in tissue. This is important regarding the application because that way all photosensitizer in the tissue can be activated.
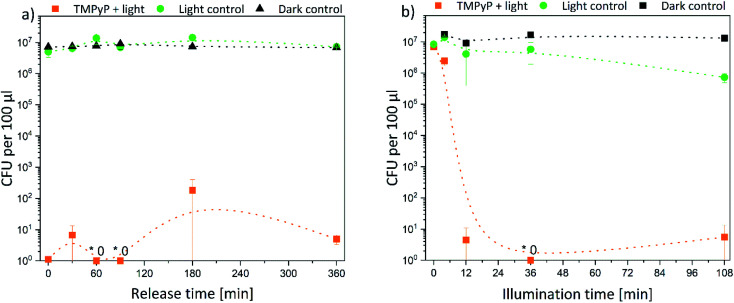
Subsequently, the results were quantified. Thus, the decrease of bacterial density was determined in solution. In Fig. 9 the bacterial density of samples treated with TMPyP-loaded hydrogels and illumination with 415 nm are illustrated. A complete eradication of the E. coli bacteria was possible. The release time (Fig. 9a) did not affect the bacterial reduction. In all samples, the amount of bacteria decreased by at least 5 logarithmic steps (logs). Therefore, a disinfection (defined as reduction of bacteria by 5 logs) was possible. However, the illumination time (Fig. 9b) influenced the bacterial reduction significantly. While during an illumination of 4 min the bacterial density was reduced only by 50%, after 12 min illumination and more, the bacteria were eradicated completely in the samples. On the contrary, no effect was found in the dark control. The bacterial density remained constant in all samples. Therefore, the photosensitizer and the hydrogel were not toxic themselves to the bacteria. Also, the illumination alone did not have a major effect on the bacterial numbers. Only after an illumination time of 108 min (Fig. 9b, green dots) there was a small, but significant effect on bacterial numbers. However, this effect was six orders of magnitude smaller than the effect in the samples treated with light and the TMPYP-loaded hydrogels.
Fig. 9. Colony forming units (CFU) of E. coli bacteria after treatment with TMPyP-loaded hydrogels depending on (a) release time (illumination time fixed to 36 min) and (b) illumination time (release time fixed to 90 min) (the intergroup differences between the samples and the dark control were statistically significant (P < 0.05) for all illumination durations equal to or greater than 4 min (two-tailed t-test; n ≥ 3)) (* refers to values that are zero).
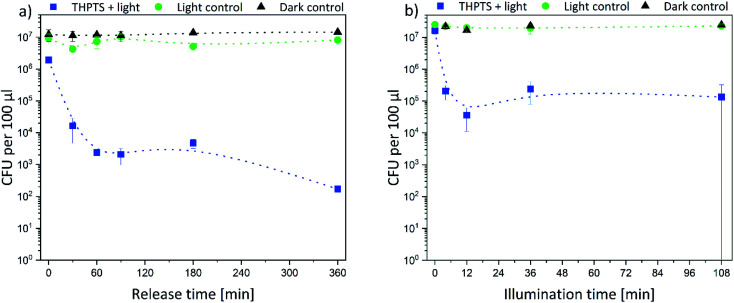
Afterwards, the E. coli samples were treated with THPTS-loaded hydrogels and illuminated with 760 nm. The results are displayed in Fig. 10. Again, there was no effect on the bacterial density neither in the dark control nor in the light control. Thus, neither the photosensitizer-loaded hydrogels nor the 760 nm light was toxic for the bacteria. On the contrary, the bacterial density only decreased when the THPTS-loaded hydrogels were illuminated (Fig. 10b).
Fig. 10. Colony forming units (CFU) of E. coli bacteria after treatment with THPTS-loaded hydrogels depending on (a) release time (illumination time fixed to 36 min) and (b) illumination time (release time fixed to 90 min) the intergroup differences between the samples and the dark control were statistically significant (P < 0.05) for all illumination durations equal to or greater than 4 min (two-tailed t-test; n ≥ 3).
As for the TMPyP-loaded hydrogels, the bacterial density decreased by 2 logarithmic steps with increasing illumination time. After an illumination time of 12 min, the bacterial density remained constant. When the illumination time was fixed to 36 min, the bacterial density decreased with increasing release time by 1 log (for 0 min release) to 5 logs (after 360 min release) (Fig. 10a). Again, the bacteria were not killed as effectively as with TMPyP-loaded hydrogels. Taken together our data indicate that disinfection was possible with both THPTS- and TMPyP-loaded hydrogels.
3.5. Efficiency against ESKAPE pathogens
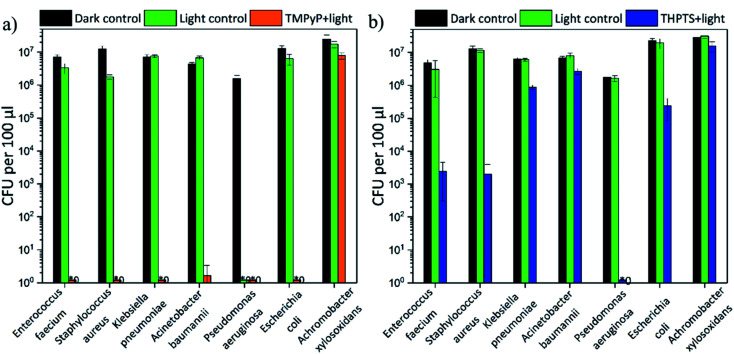
In addition to the effectiveness against the ESBL E. coli, the efficiency against five strains of the ESKAPE pathogens (E. faecium, S. aureus, K. pneumonia, A. baumannii and P. aeruginosa) was also investigated. All bacterial strains were resistant against multiple antibiotics (for further information see Table S2–S6†). Additionally, an A. xylosoxidans strain was investigated. No tested antibiotic was effective (see Table S7†) against this strain. The results are displayed in Fig. 11.
Fig. 11. Colony forming units (CFU) after treatment of ESKAPE pathogens and A. xylosoxidans with (a) TMPyP-loaded hydrogels and 415 nm and (b) THPTS-loaded hydrogels and 760 nm (illumination time fixed to 36 min and release time fixed to 90 min) (the intergroup differences between the samples and the dark control were statistically significant (P < 0.05, two-tailed t-test; n ≥ 3)) (* refers to values that are zero).
The TMPyP-loaded hydrogels (Fig. 11a) led to a complete eradication of all ESKAPE pathogens and E. coli after illumination with a wavelength of 415 nm. The bacterial density of the highly environmentally persistent A. xylosoxidans strain was decreased by 1 logarithmic steps. A. xylosoxidans naturally produces oxidase and catalase enzymes that make them more resistant against oxidative stress from singlet oxygen (and other reactive oxygen species).
Therefore, the photodynamic treatment is less effective on this pathogen than on others. But even though a complete eradication was not possible for this pathogen, the loaded hydrogels were still more efficient than currently available antibiotics. The THPTS-loaded hydrogels (Fig. 11b) decreased the bacterial density of the analyzed pathogens by 0.5 (50%) to 7 orders of magnitude after illumination. A complete eradication was achieved only for P. aeruginosa. Furthermore, the bacterial density of the two Gram-positive pathogens E. faecium and S. aureus was lowered by 3 orders of magnitude and the one of E. coli by 2 logarithmic steps. Therefore, sanitization (defined as decrease by 2 orders of magnitude) was possible for these pathogens. For the other pathogens (K. pneumonia, A. baumannii and A. xylosoxidans) a decrease of at least 50% (0.5 logs) was achieved (see Table 2). Thus, all pathogens were successfully treated by the hydrogels loaded with TMPyP and THPTS.
Bacterial decrease after treatment of the pathogens with loaded hydrogels and light in percent.
| Pathogens | TMPyP-loaded hydrogels | THPTS-loaded hydrogels |
|---|---|---|
| E. faecium | 100.0% | 99.9% ± 0.1% |
| S. aureus | 100.0% | 99.8% ± 0.2% |
| K. pneumonia | 100.0% | 86.3% ± 2.2% |
| A. baumannii | 100.0% | 61.0% ± 8.6% |
| P. aeruginosa | 100.0% | 100.0% |
| E. coli | 100.0% | 98.9% ± 0.7% |
| A. xylosoxidans | 67.8% ± 21.5% | 55.1% ± 1.9% |
4. Conclusions
In this study, we could show that hydrogels are promising candidates for wound dressings allowing a photodynamic therapy of infected wounds. Due to the optical properties of the used hydrogels, they might allow phototherapy without removal of the wound dressing. In detail, we demonstrated that the hydrogels allow efficient loading with the photosensitizers, TMPyP and THPTS. Both photosensitizers were released from the hydrogels and showed high efficiency to eradicate multidrug-resistant E. coli bacteria after illumination. The antibacterial treatment was achieved both on agar plates as a model system for an infected wound as well as in solution. Both eradicated not only E. coli, but also further relevant, multidrug-resistant bacteria strains. Five of the ESKAPE pathogens were successfully eradicated after photodynamic treatment using one of the photosensitizer-loaded hydrogels. Moreover, the density of a bacterial strain resistant against all currently known antibiotics (A. xylosoxidans) to date decreased through use of the hydrogels. Thus, it was demonstrated, that even pathogens, which acquired strategies against oxidative stress, were not completely resistant against the photodynamic inactivation.
In general, the TMPyP-loaded hydrogels were more effective than those loaded with THPTS, since TMPyP had a higher attenuation coefficient and was released more efficiently from the hydrogels. Nevertheless, both photosensitizers were effective against all bacteria strains. However, the effectivity can be different in human tissue, as the penetration depth of 760 nm in skin is higher than that of 415 nm. This should be evaluated in an in vivo model in future studies. Such an in vivo model has to be the next step to show the suitability of the photosensitizer-loaded hydrogels.
Conflicts of interest
There are no conflicts to declare.
Supplementary Material
Acknowledgments
The authors are thankful for the support of the Prof. Schwarz (TU Chemnitz, Germany) and his group by providing the LED systems. We also thank Robert Konieczny for help operating the electron beam accelerator.
Electronic supplementary information (ESI) available: Table S1 Antibiotic resistance pattern of ESBL E. coli Seq. no. 443733, Table S2 Antibiotic resistance pattern of VRE E. faecium Seq. no. 432107, Table S3 Antibiotic resistance pattern of MRSA S. aureus Seq. no. 617953, Table S4 Antibiotic resistance pattern of KPC K. pneumoniae Seq. no. 429421, Table S5 Antibiotic resistance pattern of P. aeruginosa Seq. no. 119769, Table S6 Antibiotic resistance pattern of A. baumannii Seq. no. 127028, Table S7 Antibiotic resistance pattern of A. xyoloxidans Seq. no. 802518. See DOI: 10.1039/d0ra09786a
References
- Cassini A. Högberg L. D. Plachouras D. Quattrocchi A. Hoxha A. Simonsen G. S. Colomb-Cotinat M. Kretzschmar M. E. Devleesschauwer B. Cecchini M. Ouakrim D. A. Oliveira T. C. Struelens M. J. Suetens C. Monnet D. L. Strauss R. Mertens K. Struyf T. Catry B. Latour K. Ivanov I. N. Dobreva E. G. Tambic Andraševic A. Soprek S. Budimir A. Paphitou N. Žemlicková H. Schytte Olsen S. Wolff Sönksen U. Märtin P. Ivanova M. Lyytikäinen O. Jalava J. Coignard B. Eckmanns T. Abu Sin M. Haller S. Daikos G. L. Gikas A. Tsiodras S. Kontopidou F. Tóth Á. Hajdu Á. Guólaugsson Ó. Kristinsson K. G. Murchan S. Burns K. Pezzotti P. Gagliotti C. Dumpis U. Liuimiene A. Perrin M. Borg M. A. de Greeff S. C. Monen J. C. M. Koek M. B. G. Elstrøm P. Zabicka D. Deptula A. Hryniewicz W. Caniça M. Nogueira P. J. Fernandes P. A. Manageiro V. Popescu G. A. Serban R. I. Schréterová E. Litvová S. Štefkovicová M. Kolman J. Klavs I. Korošec A. Aracil B. Asensio A. Pérez-Vázquez M. Billström H. Larsson S. Reilly J. S. Johnson A. Hopkins S. Lancet Infect. Dis. 2018;19:56–66. doi: 10.1016/S1473-3099(18)30605-4. [DOI] [PMC free article] [PubMed] [Google Scholar]
- Laxminarayan R. Matsoso P. Pant S. Brower C. Røttingen J.-A. Klugman K. Davies S. Lancet. 2016;387:168–175. doi: 10.1016/S0140-6736(15)00474-2. [DOI] [PubMed] [Google Scholar]
- Cieplik F. Deng D. Crielaard W. Buchalla W. Hellwig E. Al-Ahmad A. Maisch T. Crit. Rev. Microbiol. 2018;44:571–589. doi: 10.1080/1040841X.2018.1467876. [DOI] [PubMed] [Google Scholar]
- Holmes A. H. Moore L. S. P. Sundsfjord A. Steinbakk M. Regmi S. Karkey A. Guerin P. J. Piddock L. J. V. Lancet. 2016;387:176–187. doi: 10.1016/S0140-6736(15)00473-0. [DOI] [PubMed] [Google Scholar]
- Renwick M. J., Simpkin V. and Mossialos E., Targeting Innovation in Antibiotic Drug Discovery and Development: the Need for a One Health–One Europe–One World Framework, European Observatory on Health Systems and Policies, Health Policy Series, Denmark, 2016 [PubMed] [Google Scholar]
- Zhen X. Lundborg C. S. Sun X. Hu X. Dong H. Antimicrobial Resistance & Infection Control. 2019;8:137. doi: 10.1186/s13756-019-0590-7. [DOI] [PMC free article] [PubMed] [Google Scholar]
- Rice L. B. J. Infect. Dis. 2008;197:1079–1081. doi: 10.1086/533452. [DOI] [PubMed] [Google Scholar]
- Santajit S. Indrawattana N. BioMed Res. Int. 2016;2016:8. doi: 10.1155/2016/2475067. [DOI] [PMC free article] [PubMed] [Google Scholar]
- Lipsky B. A. Diabetes/Metab. Res. Rev. 2016;32:246–253. doi: 10.1002/dmrr.2739. [DOI] [PubMed] [Google Scholar]
- Moor A. C. E., Ortel B. and Hasan T., in Photodynamic Therapy, ed. T. Patrice, The Royal Society of Chemistry, 2003, vol. 2, pp. 19–58 [Google Scholar]
- Ormond A. B. Freeman H. S. Materials. 2013;6:817–840. doi: 10.3390/ma6030817. [DOI] [PMC free article] [PubMed] [Google Scholar]
- Preuss A. Zeugner L. Hackbarth S. Faustino M. A. Neves M. G. Cavaleiro J. A. Roeder B. J. Appl. Microbiol. 2013;114:36–43. doi: 10.1111/jam.12018. [DOI] [PubMed] [Google Scholar]
- Johnson G. A. Muthukrishnan N. Pellois J.-P. Bioconjugate Chem. 2013;24:114–123. doi: 10.1021/bc3005254. [DOI] [PubMed] [Google Scholar]
- Wainwright M. Maisch T. Nonell S. Plaetzer K. Almeida A. Tegos G. P. Hamblin M. R. Lancet Infect. Dis. 2017;17:e49–e55. doi: 10.1016/S1473-3099(16)30268-7. [DOI] [PMC free article] [PubMed] [Google Scholar]
- Berg K. Selbo P. K. Weyergang A. Dietze A. Prasmickaite L. Bonsted A. Engesaeter B. Ø. Angell-Petersen E. Warloe T. Frandsen N. HØGset A. J. Microsc. 2005;218:133–147. doi: 10.1111/j.1365-2818.2005.01471.x. [DOI] [PubMed] [Google Scholar]
- Moreira L. M. dos Santos F. V. Lyon J. P. Maftoum-Costa M. Pacheco-Soares C. da Silva N. S. Aust. J. Chem. 2008;61:741–754. doi: 10.1071/CH08145. [DOI] [Google Scholar]
- Kou J. Dou D. Yang L. Oncotarget. 2017;8:81591–81603. doi: 10.18632/oncotarget.20189. [DOI] [PMC free article] [PubMed] [Google Scholar]
- Ash C. Dubec M. Donne K. Bashford T. Lasers in Medical Science. 2017;32:1909–1918. doi: 10.1007/s10103-017-2317-4. [DOI] [PMC free article] [PubMed] [Google Scholar]
- Hanakova A. Bogdanova K. Tomankova K. Pizova K. Malohlava J. Binder S. Bajgar R. Langova K. Kolar M. Mosinger J. Kolarova H. Microbiol. Res. 2014;169:163–170. doi: 10.1016/j.micres.2013.07.005. [DOI] [PubMed] [Google Scholar]
- Müller A. Preuß A. Bornhütter T. Thomas I. Prager A. Schulze A. Röder B. Photochem. Photobiol. Sci. 2018;17:1346–1354. doi: 10.1039/C8PP00254A. [DOI] [PubMed] [Google Scholar]
- Ziganshyna S. Guttenberger A. Lippmann N. Schulz S. Bercker S. Kahnt A. Rüffer T. Voigt A. Gerlach K. Werdehausen R. Int. J. Antimicrob. Agents. 2020;55:105976. doi: 10.1016/j.ijantimicag.2020.105976. [DOI] [PubMed] [Google Scholar]
- Pereira M. A. Faustino M. A. F. Tomé J. P. C. Neves M. G. P. M. S. Tomé A. C. Cavaleiro J. A. S. Cunha Â. Almeida A. Photochem. Photobiol. Sci. 2014;13:680–690. doi: 10.1039/c3pp50408e. [DOI] [PubMed] [Google Scholar]
- Maisch T. Spannberger F. Regensburger J. Felgenträger A. Bäumler W. J. Ind. Microbiol. Biotechnol. 2012;39:1013–1021. doi: 10.1007/s10295-012-1103-3. [DOI] [PubMed] [Google Scholar]
- Pelras T. Glass S. Scherzer T. Elsner C. Schulze A. Abel B. Polymers. 2017;9:639. doi: 10.3390/polym9120639. [DOI] [PMC free article] [PubMed] [Google Scholar]
- Glass S. Kühnert M. Abel B. Schulze A. Polymers. 2019;11:501. doi: 10.3390/polym11030501. [DOI] [PMC free article] [PubMed] [Google Scholar]
- Jandera V. Hudson D. A. de Wet P. M. Innes P. M. Rode H. Burns. 2000;26:265–270. doi: 10.1016/S0305-4179(99)00133-3. [DOI] [PubMed] [Google Scholar]
- Bullock A. Pickavance P. Haddow D. Rimmer S. MacNeil S. Regener. Med. 2010;5:55–64. doi: 10.2217/rme.09.67. [DOI] [PubMed] [Google Scholar]
- Haryanto D. Kim S. Kim J. H. Kim J. O. Ku S. Cho H. Han D. H. Huh P. Macromol. Res. 2014;22:131–138. doi: 10.1007/s13233-014-2023-z. [DOI] [Google Scholar]
- Kamoun E. A. Chen X. Mohy Eldin M. S. Kenawy E.-R. S. Arabian J. Chem. 2015;8:1–14. doi: 10.1016/j.arabjc.2014.07.005. [DOI] [Google Scholar]
- Stubbe B. Mignon A. Declercq H. Van Vlierberghe S. Dubruel P. Macromol. Biosci. 2019;19:1900123. doi: 10.1002/mabi.201900123. [DOI] [PubMed] [Google Scholar]
- Winter G. D. Nature. 1962;193:293. doi: 10.1038/193293a0. [DOI] [PubMed] [Google Scholar]
- Gibas I. Janik H. Chem. Chem. Technol. 2010;4:297–304. doi: 10.23939/chcht04.04.297. [DOI] [Google Scholar]
- Peppas N. A. Bures P. Leobandung W. Ichikawa H. Eur. J. Pharm. Biopharm. 2000;50:27–46. doi: 10.1016/S0939-6411(00)00090-4. [DOI] [PubMed] [Google Scholar]
- Qiu Y. Park K. Adv. Drug Delivery Rev. 2012;64:49–60. doi: 10.1016/j.addr.2012.09.024. [DOI] [Google Scholar]
- Parhi R. Adv. Pharm. Bull. 2017;7:515–530. doi: 10.15171/apb.2017.064. [DOI] [PMC free article] [PubMed] [Google Scholar]
- Abbas M. Xing R. Zhang N. Zou Q. Yan X. ACS Biomater. Sci. Eng. 2018;4:2046–2052. doi: 10.1021/acsbiomaterials.7b00624. [DOI] [PubMed] [Google Scholar]
- Glass S. Rüdiger T. Griebel J. Abel B. Schulze A. RSC Adv. 2018;8:41624–41632. doi: 10.1039/C8RA08093C. [DOI] [PMC free article] [PubMed] [Google Scholar]
- Habermann N. Wachs M. Schulz S. Werdehausen R. Schwarz U. T. Jpn. J. Appl. Phys. 2019;58:SCCC25. doi: 10.7567/1347-4065/ab09e3. [DOI] [Google Scholar]
- Kalra A. Lowe A. Al-Jumaily A. J. Mater. Sci. Eng. 2016;5:254–260. [Google Scholar]
- Hoare T. R. Kohane D. S. Polymer. 2008;49:1993–2007. doi: 10.1016/j.polymer.2008.01.027. [DOI] [Google Scholar]
- Riyad Y. M. Naumov S. Schastak S. Griebel J. Kahnt A. Häupl T. Neuhaus J. Abel B. Hermann R. J. Phys. Chem. B. 2014;118:11646–11658. doi: 10.1021/jp507270k. [DOI] [PubMed] [Google Scholar]
- Gouterman M. J. Mol. Spectrosc. 1961;6:138–163. doi: 10.1016/0022-2852(61)90236-3. [DOI] [Google Scholar]
- Mroz P. Hamblin M. R. Photochem. Photobiol. Sci. 2011;10:751–758. doi: 10.1039/c0pp00345j. [DOI] [PMC free article] [PubMed] [Google Scholar]
- Oli A. N. Eze D. E. Gugu T. H. Ezeobi I. Maduagwu U. N. Ihekwereme C. P. Journal. 2017;27:66. doi: 10.11604/pamj.2017.27.66.10226. [DOI] [PMC free article] [PubMed] [Google Scholar]
- Idowu O. J. Onipede A. O. Orimolade A. E. Akinyoola L. A. Babalola G. O. J. Global Infect. Dis. 2011;3:211–215. doi: 10.4103/0974-777X.83524. [DOI] [PMC free article] [PubMed] [Google Scholar]
- Pereira M. A. Faustino M. A. F. Tomé J. P. C. Neves M. G. P. M. S. Tomé A. C. Cavaleiro J. A. S. Cunha Â. Almeida A. Photochem. Photobiol. Sci. 2014;13:680–690. doi: 10.1039/c3pp50408e. [DOI] [PubMed] [Google Scholar]
- Hamblin M. R. O'Donnell D. A. Murthy N. Rajagopalan K. Michaud N. Sherwood M. E. Hasan T. J. Antimicrob. Chemother. 2002;49:941–951. doi: 10.1093/jac/dkf053. [DOI] [PubMed] [Google Scholar]
- Smith A. M. Mancini M. C. Nie S. Nat. Nanotechnol. 2009;4:710–711. doi: 10.1038/nnano.2009.326. [DOI] [PMC free article] [PubMed] [Google Scholar]
Associated Data
This section collects any data citations, data availability statements, or supplementary materials included in this article.


