Abstract
We report a facile one-pot solvothermal way to prepare two-dimensional Ni-based metal–organic framework microsheets (Ni-MOFms) using only Ni precursor and ligand without any surfactant. The Ni-MOFms exhibit good specific capacities (91.4 and 60.0 C g−1 at 2 and 10 A g−1, respectively) and long-term stability in 5000 cycles when used for a supercapacitor electrode.
Two-dimensional Ni-based metal–organic framework microsheets (Ni-MOFms) were synthesized via a facial one-pot solvothermal approach and exhibited good specific capacities and excellent long-term stability when used for a supercapacitor electrode.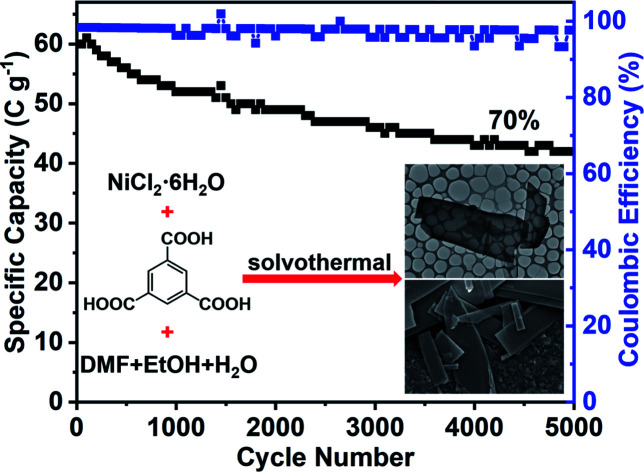
With the continuous growth of energy demand worldwide, high-performance, environmental-friendly, and low-cost energy storage devices have attracted extensive research interest.1–3 Among them, supercapacitors are considered most promising because of their high power density, long lifespan, and fast charging/discharging speed.4–6 To date, numerous materials have been explored for fabricating supercapacitors. Carbon materials have been usually used for electrical double-layer capacitors (EDLCs), including carbon fibers, carbon nanotubes, carbon spheres, carbon aerogels, and graphene,7–12 while conducting redox polymers and transition metal oxides/hydroxides are widely explored as active materials for pseudocapacitance and battery-type electrodes.13–16
Metal–organic frameworks (MOFs), a porous crystalline material composed of metal nodes and organic linkers, have been widely applied in versatile fields including chemical sensors, catalysis, separation, biomedicine, and gained more and more attention in the area of energy storage.17–25 Recently, two-dimensional (2D) MOFs have aroused great interest as a new kind of 2D materials.26,27 Compared with traditional bulk MOFs, 2D MOFs possess distinctive properties, such as short ion transport distances, abundant active sites, and high aspect ratios, making them exhibit better performance than their bulk counterparts.28–32 Bottom-up methods are generally adopted to prepare 2D MOFs with the addition of surfactants to control the growth of MOFs in a specific direction.33–35 However, the use of surfactants inevitably blocks part of the active sites at the expense of the performance of materials. Therefore, it is highly necessary to explore and develop a direct solvothermal synthesis of 2D MOFs with the advantages of additive-free, simple operation, and easy scale-up.
Herein, we report a facile one-pot solvothermal method to synthesize 2D Ni-based MOF microsheets (denoted as Ni-MOFms) by treating nickel chloride hexahydrate (NiCl2·6H2O, the metal precursor) together with the trimesic acid (H3BTC, the ligand) in a mixed solvent of N,N-dimethylformamide (DMF), ethanol (EtOH) and H2O. During the whole preparation process, only Ni precursor and the ligand are used while no surfactant is added. When used as active materials for a supercapacitor electrode, the obtained Ni-MOFms displayed excellent reversibility and rate performance. It also exhibited specific capacities of 91.4 and 60.0 C g−1 at 2 and 10 A g−1, respectively. Besides, they showed a good cycling performance in 5000 cycles with about 70% of the specific capacity and almost 100% of the coulombic efficiency maintained.
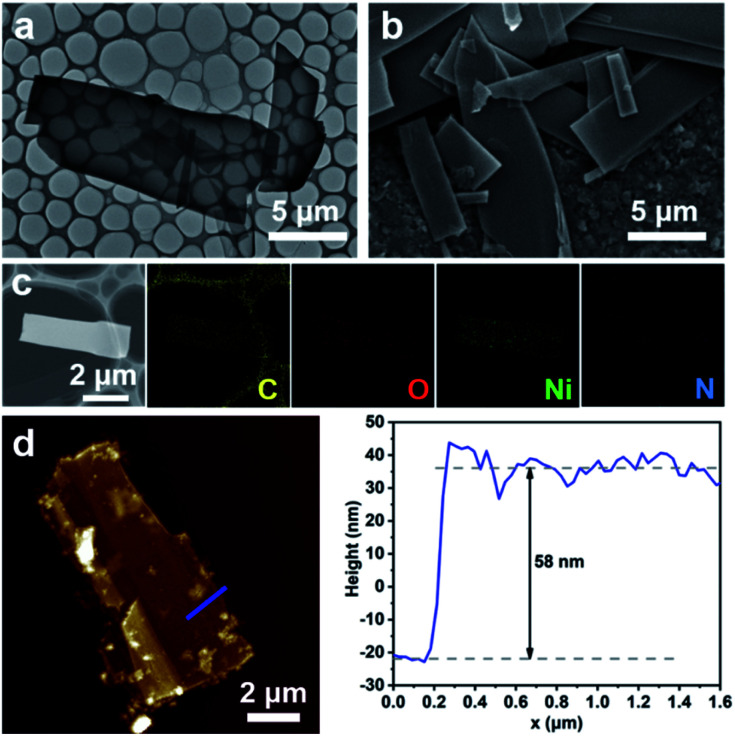
Morphologies of the Ni-MOFms were characterized by scanning electron microscopy (SEM) and transmission electron microscopy (TEM). As shown in Fig. 1a and b, the Ni-MOFms were successfully fabricated via the facile one-pot solvothermal method with varying lateral sizes on the micron scale. Energy dispersive spectroscopy (EDS) mapping indicated that the obtained microsheets were mainly composed of C, O, and Ni. A trace amount of N was also observed, which could be attributed to the residual DMF in the mixed solvent (Fig. 1c). These elements were uniformly distributed throughout the whole microsheet. To measure the exact thickness of the Ni-MOFms, atomic force microscopy (AFM) was used. Fig. 1d showed that the thickness of the microsheet was about 58 nm. Considering the large lateral size, even such thickness could produce a relatively high aspect ratio, which is beneficial to the electrochemical performance.
Fig. 1. (a) TEM image, (b) SEM image, (c) EDS mapping, and (d) AFM image and the corresponding height profile of the Ni-MOFms.
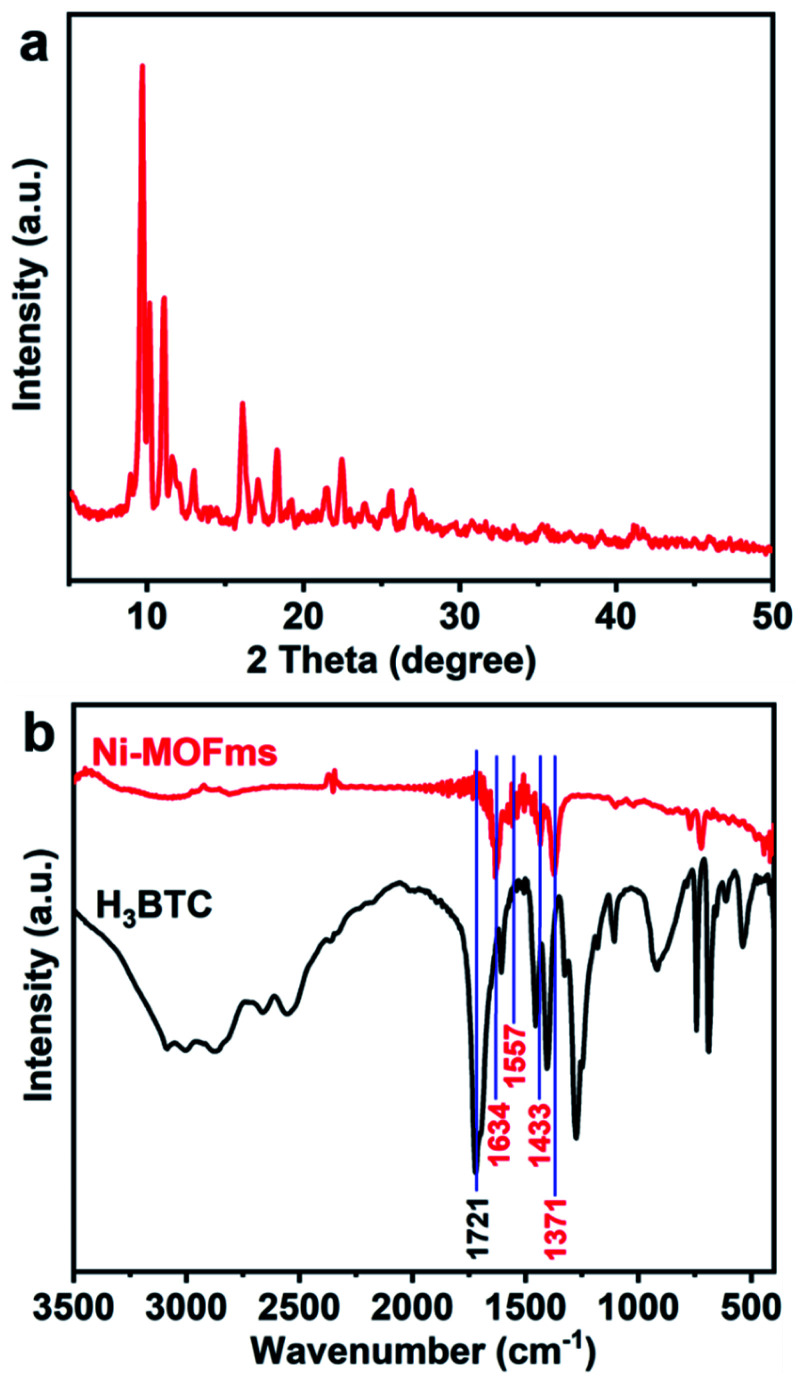
The composition information of the Ni-MOFms was analyzed by X-ray diffraction (XRD) and the resulting diffraction pattern was shown in Fig. 2a. It was clear that the sample was a crystalline material. However, the exact structure was difficult to determine because no matching MOF structure has been found. Therefore, the structure of the Ni-MOFms was further confirmed by Fourier transform infrared spectroscopy (FT-IR). As shown in Fig. 2b, there was a sharp peak at 1721 cm−1 for H3BTC, which could be ascribed to the stretching vibration of C O in the nonionized carboxyl group.36 For the Ni-MOFms, the peak at this location disappeared while four new peaks appeared. Bands at 1634 and 1557 cm−1 were related to the asymmetric stretching vibration of carboxylate ions (–COO−) and peaks at 1433 and 1371 cm−1 were the characteristic peaks of the symmetric stretching vibration of –COO−.37,38 All these changes indicate that the ligand interacted well with the metal precursor.
Fig. 2. (a) XRD pattern of the Ni-MOFms. (b) FT-IR spectra of H3BTC and the Ni-MOFms.
The chemical status and surface composition of the Ni-MOFms were further examined by X-ray photoelectron spectroscopy (XPS). From Fig. S1a† we could see that the Ni-MOFms were composed of C, O, Ni, and N, which was consistent with the result of EDS mapping. High-resolution spectra of C 1s, Ni 2p, O 1s, and N 1s were shown in Fig. S1b–e.† Characteristic peaks of C 1s at 288.27, 286.50, 285.85, and 284.80 eV were related to O C–OH, C–O, C–C, and C C, respectively, suggesting the presence of H3BTC (Fig. S1b†).39 The Ni 2p spectrum showed two peaks at 873.32 and 855.77 eV, which could be ascribed to Ni 2p1/2 and Ni 2p3/2, respectively, together with two satellite peaks at 879.26 and 861.05 eV, verifying the existence of Ni2+ (Fig. S1c†).40 In the O 1s region, bands positioned at 532.94 and 531.40 eV could be ascribed to the adsorbed H2O molecules on the surface of Ni-MOFms and typical metal–oxygen bonds, respectively, further corroborating the coordination between H3BTC and Ni2+ (Fig. S1d†).39 Finally, the high-resolution spectrum of N 1s was also analyzed (Fig. S1e†). There were two main peaks at 400.18 and 402.21 eV that could be ascribed to neutral amine and charged nitrogen, respectively,41 further proving the residual DMF on the Ni-MOFms surface.
To explore the crucial factors in the formation process of the Ni-MOFms, the reaction time and temperature, the solvent, the ligand addition amount, and the ligand type were studied. As shown in Fig. S2,† different crystalline materials were obtained at different reaction times. With the increase of reaction time, the material gradually changed from sphere to sheet. The reaction temperature is another crucial factor. At 120 °C, the material was amorphous and spherical. When the temperature rose, the crystal formed and appeared as microsheets (Fig. S3†). The effect of solvent was illustrated in Fig. S4.† Microsheets could not be synthesized in DMF or DMF with a small amount of EtOH. In the mixed solvent of DMF and H2O, crystals could be prepared, indicating the vital role of H2O. However, spheres existed in the products. Only when a mixture of DMF, EtOH, and H2O with a certain proportion was used as the solvent, the Ni-MOFms could be obtained. Furthermore, we investigated the effect of the ligand addition amount. From Fig. 1 and S5† we can see that the Ni-MOFms crystals formed when the molar ratio of Ni precursor and H3BTC was 1 : 2 (Fig. 1). We speculated that ligands could simultaneously act as regulators to adjust the morphology of materials, avoiding the use of additional surfactants. When the ligand was replaced with 2-methylimidazole (2-MI) or terephthalic acid (H2BDC), flower-like crystals rather than microsheets were obtained (Fig. S6†), indicating the importance of the ligand type. Taking the above factors into account, we could finally determine the suitable conditions for preparing the Ni-MOFms (see the experimental section in ESI†).
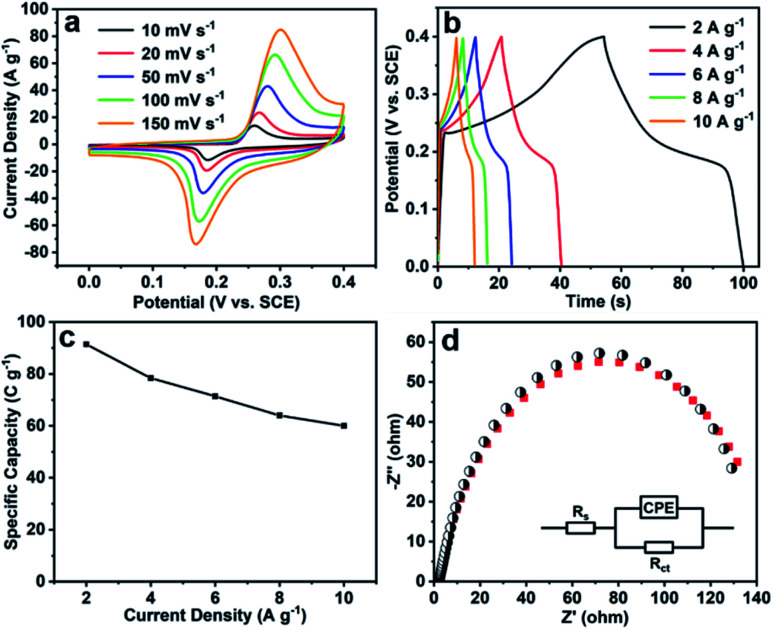
The potential application of the Ni-MOFms in supercapacitors was first tested by cyclic voltammetry (CV) in 3 M KOH between 0 and 0.4 V (vs. saturated calomel electrode, SCE). As can be seen from Fig. 3a, all CV curves had similar shapes and the peak currents improved gradually as the scan rate increased, suggesting the good capacitive behavior of the Ni-MOFms electrode.42 When the scan rate was as high as 150 mV s−1, redox peaks could still be observed, which indicated the excellent rate performance and kinetic reversibility.43 Besides, as the scan rate went up from 10 to 150 mV s−1, the reduction and oxidation peaks moved towards negative and positive potential, respectively, demonstrating the electrode polarization at large scan rates.44
Fig. 3. Electrochemical measurements of the Ni-MOFms. (a) CV curves at different scan rates. (b) GCD curves at various current densities and (c) corresponding specific capacities. (d) The EIS Nyquist plot at the bias potential of 0.4 V and the equivalent circuit model with the fitted plots (the red dots).
The galvanostatic charge–discharge (GCD) behavior was further investigated to assess the coulombic efficiency and the specific capacity of the Ni-MOFms (see the ESI† for detailed calculation method).45,46 As shown in Fig. 3b, the shape of GCD curves was highly symmetric during charging and discharging, indicating that the coulombic efficiency of Ni-MOFms was almost 100% at various current densities. The specific capacities of 91.4, 78.4, 71.4, 64.0, and 60.0 C g−1 were achieved at current densities of 2, 4, 6, 8, and 10 A g−1 (Fig. 3c), respectively, demonstrating the excellent rate capability with about 65.6% of the specific capacity maintained from 2 to 10 A g−1. The specific capacity at 2 A g−1 was comparable with or even superior to that of some MOF materials reported in the literatures (Table S1†).47–50
The kinetics of the electroanalytical process was then investigated by electrochemical impedance spectroscopy (EIS). Fig. 3d showed the Nyquist plot of Ni-MOFms from 0.01 to 100000 Hz and the corresponding equivalent circuit model (inset) with the fitted plots. CPE was the constant phase element related to the double layer capacity.51 The equivalent series resistance was denoted by Rs and its value obtained from the x-axis intercept was about 2.1 Ω, indicating the low resistance of the solution.43Rct represented the charge-transfer resistance at the interface of the electrode and electrolyte.52 For Ni-MOFms, the value of Rct was up to 147.1 Ω, which could be attributed to the poor conductivity of MOF materials.
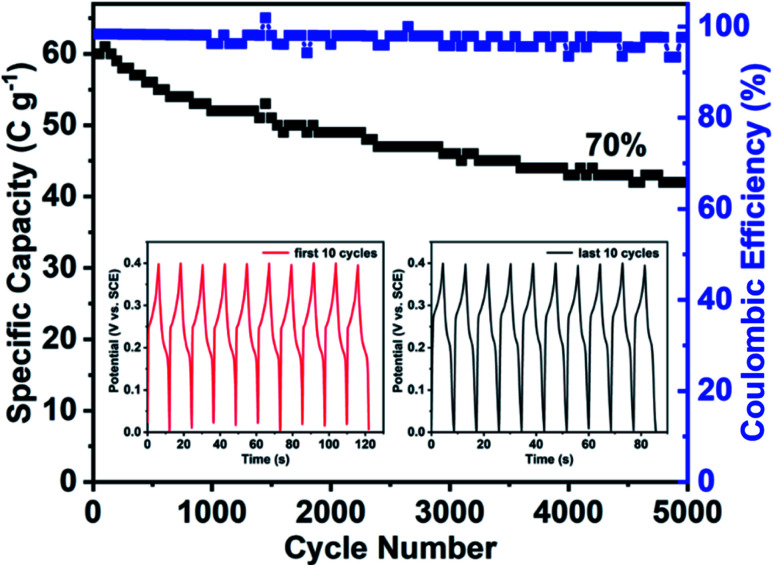
The long-term stability of Ni-MOFms was also explored by charging–discharging at 10 A g−1 for 5000 consecutive cycles. From Fig. 4 we could see that the specific capacity retention remained about 70% after 5000 cycles and the coulombic efficiency was maintained at almost 100% throughout the whole process. Furthermore, the inset in Fig. 4 exhibited that the GCD curves of the last 10 cycles were the same as the first 10 cycles, indicating excellent cycling stability.
Fig. 4. Cycle property of Ni-MOFms at 10 A g−1. Inset: GCD curves of the first 10 cycles (left) and the last 10 cycles (right).
Conclusions
In conclusion, a facile one-pot solvothermal approach has been put forward to prepare 2D Ni-based metal–organic framework microsheets (Ni-MOFms) with only metal precursor and the ligand. When applied in supercapacitors, the obtained composite displayed specific capacities of 91.4 and 60.0 C g−1 at 2 and 10 A g−1, respectively. Furthermore, they exhibited excellent cycling performance with about 70% of the specific capacity and almost 100% of the coulombic efficiency maintained after 5000 cycles. It is expected that this facile strategy could be helpful to design various 2D materials for diverse applications.
Conflicts of interest
There are no conflicts to declare.
Supplementary Material
Acknowledgments
This work has been partially supported by the National Key R&D Program of China (2018YFC0910600), the National Natural Science Foundation of China (61620106016/61835009/61775145/61525503/61935012/61961136005), Shenzhen Basic Research Project (GJHZ20190822095420249/JCYJ20180305124902165/JCYJ20190808123401666), and Guangdong Province Key Area R&D Program (2019B110233004).
Electronic supplementary information (ESI) available. See DOI: 10.1039/d1ra00259g
Notes and references
- Guo Y. G. Hu J. S. Wan L. J. Adv. Mater. 2008;20:2878–2887. doi: 10.1002/adma.200800627. [DOI] [Google Scholar]
- Liu C. Li F. Ma L. P. Cheng H. M. Adv. Mater. 2010;22:E28–E62. doi: 10.1002/adma.200903328. [DOI] [PubMed] [Google Scholar]
- Larcher D. Tarascon J. M. Nat. Chem. 2015;7:19–29. doi: 10.1038/nchem.2085. [DOI] [PubMed] [Google Scholar]
- Zhang L. L. Zhao X. S. Chem. Soc. Rev. 2009;38:2520–2531. doi: 10.1039/B813846J. [DOI] [PubMed] [Google Scholar]
- Yu Z. N. Tetard L. Zhai L. Thomas J. Energy Environ. Sci. 2015;8:702–730. doi: 10.1039/C4EE03229B. [DOI] [Google Scholar]
- Da Y. M. Liu J. X. Zhou L. Zhu X. H. Chen X. D. Fu L. Adv. Mater. 2019;31:1802793. doi: 10.1002/adma.201802793. [DOI] [PubMed] [Google Scholar]
- Zhang C. F. Nicolosi V. Energy Storage Mater. 2019;16:102–125. doi: 10.1016/j.ensm.2018.05.003. [DOI] [Google Scholar]
- Jost K. Stenger D. Perez C. R. McDonough J. K. Lian K. Gogotsi Y. Dion G. Energy Environ. Sci. 2013;6:2698–2705. doi: 10.1039/C3EE40515J. [DOI] [Google Scholar]
- Yu C. J. Masarapu C. Rong J. P. Wei B. Q. Jiang H. Q. Adv. Mater. 2009;21:4793–4797. doi: 10.1002/adma.200901775. [DOI] [PubMed] [Google Scholar]
- Han J. P. Xu G. Y. Ding B. Pan J. Dou H. MacFarlane D. R. J. Mater. Chem. A. 2014;2:5352–5357. doi: 10.1039/C3TA15271E. [DOI] [Google Scholar]
- Hao P. Zhao Z. H. Leng Y. H. Tian J. Sang Y. H. Boughton R. I. Wong C. P. Liu H. Yang B. Nano Energy. 2015;15:9–23. doi: 10.1016/j.nanoen.2015.02.035. [DOI] [Google Scholar]
- Zeng L. Lou X. C. Zhang J. H. Wu C. Liu J. Jia C. K. Surf. Coat. Technol. 2019;357:580–586. doi: 10.1016/j.surfcoat.2018.10.041. [DOI] [Google Scholar]
- Snook G. A. Kao P. Best A. S. J. Power Sources. 2011;196:1–12. doi: 10.1016/j.jpowsour.2010.06.084. [DOI] [Google Scholar]
- Mohd Abdah M. A. A. Azman N. H. N. Kulandaivalu S. Sulaiman Y. Mater. Des. 2020;186:108199. doi: 10.1016/j.matdes.2019.108199. [DOI] [Google Scholar]
- Faraji S. Ani F. N. J. Power Sources. 2014;263:338–360. doi: 10.1016/j.jpowsour.2014.03.144. [DOI] [Google Scholar]
- Xu B. Zhang H. B. Mei H. Sun D. F. Coord. Chem. Rev. 2020;420:213438. doi: 10.1016/j.ccr.2020.213438. [DOI] [Google Scholar]
- Li B. Wen H. M. Cui Y. J. Zhou W. Qian G. D. Chen B. L. Adv. Mater. 2016;28:8819–8860. doi: 10.1002/adma.201601133. [DOI] [PubMed] [Google Scholar]
- Yuan S. Feng L. Wang K. C. Pang J. D. Bosch M. Lollar C. Sun Y. J. Qin J. S. Yang X. Y. Zhang P. Wang Q. Zou L. F. Zhang Y. M. Zhang L. L. Fang Y. Li J. L. Zhou H. C. Adv. Mater. 2018;30:1704303. doi: 10.1002/adma.201704303. [DOI] [PubMed] [Google Scholar]
- Abednatanzi S. Gohari Derakhshandeh P. Depauw H. Coudert F. X. Vrielinck H. Van Der Voort P. Leus K. Chem. Soc. Rev. 2019;48:2535–2565. doi: 10.1039/C8CS00337H. [DOI] [PubMed] [Google Scholar]
- Yi F. Y. Chen D. Wu M. K. Han L. Jiang H. L. ChemPlusChem. 2016;81:675–690. doi: 10.1002/cplu.201600137. [DOI] [PubMed] [Google Scholar]
- Xu C. P. Fang R. Q. Luque R. Chen L. Y. Li Y. W. Coord. Chem. Rev. 2019;388:268–292. doi: 10.1016/j.ccr.2019.03.005. [DOI] [Google Scholar]
- Yang D. Gates B. C. ACS Catal. 2019;9:1779–1798. doi: 10.1021/acscatal.8b04515. [DOI] [Google Scholar]
- Lin R. B. Xiang S. C. Zhou W. Chen B. L. Chem. 2020;6:337–363. [Google Scholar]
- Zhang Q. Cui Y. J. Qian G. D. Coord. Chem. Rev. 2019;378:310–332. doi: 10.1016/j.ccr.2017.10.028. [DOI] [Google Scholar]
- Xia W. Mahmood A. Zou R. Q. Xu Q. Energy Environ. Sci. 2015;8:1837–1866. doi: 10.1039/C5EE00762C. [DOI] [Google Scholar]
- Zhao M. T. Huang Y. Peng Y. W. Huang Z. Q. Ma Q. L. Zhang H. Chem. Soc. Rev. 2018;47:6267–6295. doi: 10.1039/C8CS00268A. [DOI] [PubMed] [Google Scholar]
- Duan J. G. Li Y. S. Pan Y. C. Behera N. Jin W. Q. Coord. Chem. Rev. 2019;395:25–45. doi: 10.1016/j.ccr.2019.05.018. [DOI] [Google Scholar]
- Ashworth D. J. Foster J. A. J. Mater. Chem. A. 2018;6:16292–16307. doi: 10.1039/C8TA03159B. [DOI] [Google Scholar]
- Liu W. X. Yin R. L. Xu X. L. Zhang L. Shi W. H. Cao X. H. Adv. Sci. 2019;6:1802373. doi: 10.1002/advs.201802373. [DOI] [PMC free article] [PubMed] [Google Scholar]
- Dhakshinamoorthy A. Asiri A. M. Garcia H. Adv. Mater. 2019;31:1900617. doi: 10.1002/adma.201900617. [DOI] [PubMed] [Google Scholar]
- Zhu D. D. Qiao M. Liu J. L. Tao T. Guo C. X. J. Mater. Chem. A. 2020;8:8143–8170. doi: 10.1039/D0TA03138K. [DOI] [Google Scholar]
- Zhao S. L. Wang Y. Dong J. C. He C. T. Yin H. J. An P. F. Zhao K. Zhang X. F. Gao C. Zhang L. J. Lv J. W. Wang J. X. Zhang J. Q. Khattak A. M. Khan N. A. Wei Z. X. Zhang J. Liu S. Q. Zhao H. J. Tang Z. Y. Nat. Energy. 2016;1:16184. doi: 10.1038/nenergy.2016.184. [DOI] [Google Scholar]
- Zhao M. T. Lu Q. P. Ma Q. L. Zhang H. Small Methods. 2017;1:1600030. doi: 10.1002/smtd.201600030. [DOI] [Google Scholar]
- Zheng W. R. Tsang C. S. Lee L. Y. S. Wong K. Y. Mater. Today Chem. 2019;12:34–60. doi: 10.1016/j.mtchem.2018.12.002. [DOI] [Google Scholar]
- Jiang Q. Y. Zhou C. H. Meng H. B. Han Y. Shi X. F. Zhan C. H. Zhang R. F. J. Mater. Chem. A. 2020;8:15271–15301. doi: 10.1039/D0TA00468E. [DOI] [Google Scholar]
- Jin L. N. Zhao X. S. Qian X. Y. Dong M. D. J. Colloid Interface Sci. 2018;509:245–253. doi: 10.1016/j.jcis.2017.09.002. [DOI] [PubMed] [Google Scholar]
- Liu K. You H. P. Jia G. Zheng Y. H. Song Y. H. Yang M. Huang Y. J. Zhang H. J. Cryst. Growth Des. 2009;9:3519–3524. doi: 10.1021/cg900252r. [DOI] [Google Scholar]
- Liu K. You H. P. Zheng Y. H. Jia G. Zhang L. H. Huang Y. J. Yang M. Song Y. H. Zhang H. J. CrystEngComm. 2009;11:2622–2628. doi: 10.1039/B905924P. [DOI] [Google Scholar]
- Lu W. B. Wu X. F. New J. Chem. 2018;42:3180–3183. doi: 10.1039/C7NJ04754A. [DOI] [Google Scholar]
- Lin Y. F. Wan H. Wu D. Chen G. Zhang N. Liu X. H. Li J. H. Cao Y. J. Qiu G. Z. Ma R. Z. J. Am. Chem. Soc. 2020;142:7317–7321. doi: 10.1021/jacs.0c01916. [DOI] [PubMed] [Google Scholar]
- Raymundo-Pinero E. Cazorla-Amoros D. Linares-Solano A. Find J. Wild U. Schlogl R. Carbon. 2002;40:597–608. doi: 10.1016/S0008-6223(01)00155-5. [DOI] [Google Scholar]
- Huang P. P. Cao C. Y. Sun Y. B. Yang S. L. Wei F. Song W. G. J. Mater. Chem. A. 2015;3:10858–10863. doi: 10.1039/C5TA02427G. [DOI] [Google Scholar]
- Wang Y. Z. Liu Y. X. Wang H. Q. Liu W. Li Y. Zhang J. F. Hou H. Yang J. L. ACS Appl. Energy Mater. 2019;2:2063–2071. doi: 10.1021/acsaem.8b02128. [DOI] [Google Scholar]
- Mohamed S. G. Hussain I. Shim J. J. Nanoscale. 2018;10:6620–6628. doi: 10.1039/C7NR07338K. [DOI] [PubMed] [Google Scholar]
- Xia H. C. Zhang J. N. Yang Z. Guo S. Y. Guo S. H. Xu Q. Nano-Micro Lett. 2017;9:43. doi: 10.1007/s40820-017-0144-6. [DOI] [PMC free article] [PubMed] [Google Scholar]
- Brousse T. Bélanger D. Long J. W. J. Electrochem. Soc. 2015;162:A5185–A5189. doi: 10.1149/2.0201505jes. [DOI] [Google Scholar]
- Lee D. Y. Yoon S. J. Shrestha N. K. Lee S. H. Ahn H. Han S. H. Microporous Mesoporous Mater. 2012;153:163–165. doi: 10.1016/j.micromeso.2011.12.040. [DOI] [Google Scholar]
- Lee D. Y. Shinde D. V. Kim E. K. Lee W. Oh I. W. Shrestha N. K. Lee J. K. Han S. H. Microporous Mesoporous Mater. 2013;171:53–57. doi: 10.1016/j.micromeso.2012.12.039. [DOI] [Google Scholar]
- Campagnol N. Romero-Vara R. Deleu W. Stappers L. Binnemans K. De Vos D. E. Fransaer J. ChemElectroChem. 2014;1:1182–1188. doi: 10.1002/celc.201402022. [DOI] [Google Scholar]
- Diaz R. Orcajo M. G. Botas J. A. Calleja G. Palma J. Mater. Lett. 2012;68:126–128. doi: 10.1016/j.matlet.2011.10.046. [DOI] [Google Scholar]
- Chen H. Wang J. M. Zhao Y. L. Zhang J. Q. Cao C. N. J. Solid State Electrochem. 2004;9:421–428. doi: 10.1007/s10008-004-0578-x. [DOI] [Google Scholar]
- Zheng X. J. Song X. Y. Wang X. M. Zhang Z. H. Sun Z. M. Guo Y. S. New J. Chem. 2018;42:8346–8350. doi: 10.1039/C8NJ01035H. [DOI] [Google Scholar]
Associated Data
This section collects any data citations, data availability statements, or supplementary materials included in this article.


