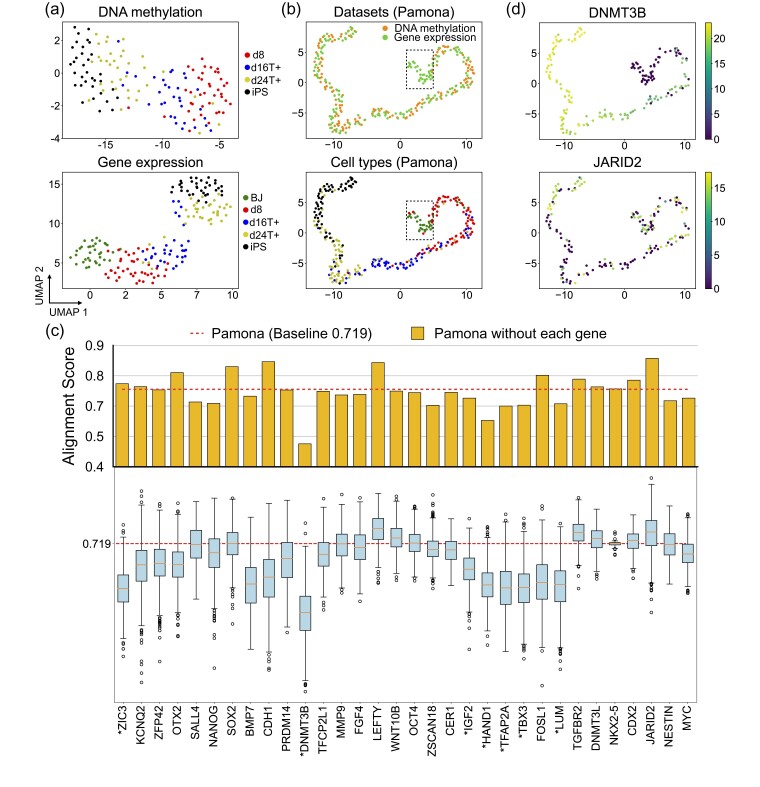
Fig. 3.
Pamona integrated the sc-GEM dataset and identified informative genes in delineating the shared and dataset-specific cellular structures. (a) Visualizations of the DNA methylation (upper panel) and gene expression (lower panel) datasets separately using UMAP before alignment. BJ cells (green points) comprise the gene expression dataset-specific cells. (b) Visualizations of the common space of the two aligned datasets by Pamona using UMAP: upper panel: cells are colored according to their corresponding datasets; lower panel: cells are colored according to their corresponding types. (c) Alignment score of Pamona using expression profile with all 32 genes (red dashed line, baseline 0.719) and without each of the 32 genes separately (upper panel, orange bars), or the permuted Alignment Scores by randomly shuffling the expression values of each of the 32 genes across cells 1000 times (lower panel, blue boxes). The genes with significant P-values less than 0.05 are denoted with ‘*’. (d) Gene expression of cells in the common space: upper panel: DNMT3B (informative gene); lower panel: JARID2 (non-informative gene)

