Abstract
We report a graphene oxide (GO) lamellar membrane with increased inter-layer spacing for efficient permeation of water molecules and heavy metal ions through nanoporous graphene oxide. The inter-layer spacing of the GO sheets in the lamellar structure was increased by introducing poly-aminophosphonic acid (APA) in between the GO sheets. We demonstrate experimentally, the use of a prepared membrane (GO–APA) by a SPE technique for the preconcentration and extraction of heavy metal ions by chelate formation and their determination by ICP-OES. We found that this sub-micrometer-thick membrane allows unimpeded permeation of water molecules through two-dimensional capillaries formed across the pores and by closely spaced graphene sheets. Compared to the bulk GO sorbent, GO–APA membrane offers enhanced sensitivity and permeability for heavy metal ions due to relatively large inter-layer spacing and high surface area (extraction phase) with a high number of active functional groups. The potential of this technique for the preconcentration and extraction of Pb(ii), Cd(ii) and Cu(ii) is illustrated with the contaminated ground water and industrial waste water analysis. The detection limit achieved for studied ions was 1.1 ng L−1, under optimized experimental conditions. The co-existing ions did not hinders the extraction of trace heavy metal ions. Accuracy of the developed method was assessed by analyzing Standard Reference Materials. The Student's t test values were found to less than the critical Student's t value of 4.303 at the 95% confidence level. The method shows good precision as coefficients of variation for five replicate measurements were found to be 4–5%.
A porous graphene oxide membrane with increased interlayer spacing of GO sheets was prepared by covalently introducing poly-aminophosphonic acid in between the GO sheets. The membrane was successfully employed for the extraction of heavy metal ions.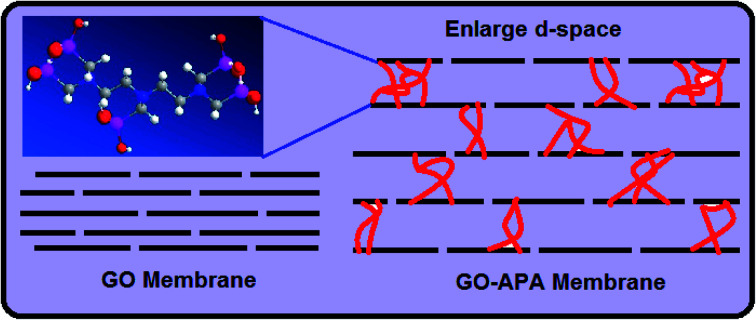
Introduction
Environmental pollution caused by diversified use of heavy metals has become one of the most significant issues worldwide.1,2 The accumulation of heavy metal ions such as Cu(ii), Pb(ii) and Cd(ii) in the human body led to unpredictable neurodegenerative diseases including metabolic disorders, antibiotic resistance, mental impairment and cancer.3–7 Heavy metal exposure usually occurs through contaminated air, food and water besides multiple industrial, agricultural and medicinal activities.8 To prevent potential health problems caused by heavy metal ions, methods to quantify them are highly required.9 Quantification of such emerging toxicants is the foremost step to check the level of contamination, monitor the efficiency of the action plan taken to control the pollution, and to assess the effects of exposure on biota.10 Several sophisticated instrumental techniques such as inductively coupled plasma optical emission spectrometry (ICP-OES), inductively coupled plasma mass spectrometry (ICP-MS), flame atomic absorption (FAAS) and electro-thermal atomic absorption spectrometry (ETAS) have been in practice for the determination of heavy metal ions. Although all these techniques have several advantages such as, low detection limit, multi-elemental analysis, large dynamic linear range, high sample throughput, however, direct determination of trace heavy metal ions with complex sample matrices, such as environmental water samples is still challenging due to matrix interferences.11–13 Therefore, a sample extraction and preconcentration techniques are the prerequisite step to eliminate any matrix components and consequently improving the detection limit are of significant importance.
Solid phase extraction (SPE) is a well-renowned technique, widely used for the pretreatment of environmental samples. It is simple to use, fast, inexpensive, gives high enrichment factor in short extraction time, and requires low consumption of material and solvents.14 Considerable research have been focused on the development of nanomaterials-based extraction methods for a great variety of analytes, including biomolecules, pesticide residues and heavy metal ions.15–18 Carbon based nanomaterials are of considerable interests in sample preparation techniques, including graphene, graphene oxide and carbon nanotubes.19–22 Graphene oxide (GO), a single or few-layer thick two-dimensional carbon material derived from the chemical oxidation of graphite, shows excellent mechanical strength with high chemical stability. The large specific surface area and the presence of surface functional groups like epoxy (–COC–), hydroxyl (–OH), carboxyl (–COOH) and carbonyl (–C O) at the edges and basal plane promotes the GO for its application in analytical science.23–25 These surface functional groups improves the hydrophilicity of GO and provides good accessibility for metal ions adsorption. Moreover, these groups provides reaction sites for the immobilization of organic ligands and/or decoration of nanoparticles. Several research groups have reported the adsorption properties of GO for heavy metal ions on its surface via surface complexation, π–π interaction or by electrostatic interactions.24,26–28 Therefore, GO seems to be an ideal adsorbent in the extraction of metal ions. However, direct use of GO in aqueous media is challenging because of strong van der Waals forces and π–π interaction, they tend to agglomerates and significantly limits its surface area and adsorption activity.24 Most importantly, GO cannot be directly implemented in flow-through columns experiments to develop analytical methodologies due to its inconvenient handling in SPE column.9 The inconvenience results from the tiny particle size of GO and its flexibility, which cause the release of GO from the column along with sample solution due to the high polydispersity of GO sheets. These escaped GO particles are undesirable, environmentally unfriendly and pose a serious health threat to the ecosystem.29–32 Our primary concern is how to efficiently use a single to few-layer GO sheets in a flow-through SPE column to preconcentrate/extract micro to nano grams of heavy metal ions from aqueous samples while preserving environmental consequences.
Herein, to address the above challenges, we engineered a lamellar GO membrane consist of inter-connected GO sheets. The single to few layered GO sheets were interconnected via poly-aminophosphonic acid. The functionalization of GO sheets with polyaminophosphonic acid not only increases the in between space of GO sheets but also enhances the metal ions adsorption usually by chelation rather than the physical interaction and provides necessary stability to overcome the inherent dispersibility in aqueous media. The poly-aminophosphonic acid incorporated GO membrane forms polynuclear complexes of the type M5L·xH2O (M = Pb(ii), Cd(ii) and Cu(ii)), and shows a high adsorption capacity towards heavy metal ions as compare to nascent GO membrane. This new material is highly hydrophilic due to incorporated surface groups and shows faster extraction of metal ions from aqueous media. The free space between the GO sheets results in the formation of capillary network and provides porosity within the adsorbent and allows water molecules to permeate smoothly. Experimental results demonstrated higher water flow through the prepared membrane with the increase in metal ion adsorption sites. The prepared membrane was characterized and examined for the enrichment of heavy metal ions presented at trace and ultra-trace level in a flow-through experiments. Selective extraction of heavy metal ion from alkali and alkaline earth metals can be achieved by controlling the sample pH and sample flow rate. The GO membrane exhibits excellent extraction efficiency for heavy metal ions with acceptable flow rate properties. This interconnected GO membrane is easy to handle, free from agglomeration and leaching from the column during the flow-through experiments, as compared to direct use of GO sheets.
Experimental
Chemicals
All chemicals and metal salts used were of analytical grade. Graphite powder, diethylenetriamine penta (methylene phosphonic acid), urea and dimethylformamide were purchased from Sigma-Aldrich. Cadmium nitrate, copper nitrate and lead nitrate were purchased from Thermo Fisher Scientific. Sulfuric acid, oxalic acid, hydrochloric acid, phosphoric acid, sodium hydroxide and potassium hydroxide pellets were procured from Merck. All working solutions (metal ion) were diluted from stock (1000 mg L−1) prior to their use. The Standard Reference Material SRM NIES-10c was received from the National Institute of Environmental Studies (Ibaraki, Japan). SRM 1572b was procured from the National Bureau of Standards, U.S. Department of Commerce (Washington, DC). All glassware were soaked overnight in 1% HNO3 and rinsed prior to use. The calibration standards for ICP-OES (inductively coupled plasma optical emission spectrophotometer) were prepared from stock metal ion solutions (1000 μg mL−1) (Agilent) in 1% nitric acid.
Preparation of GO–APA membrane
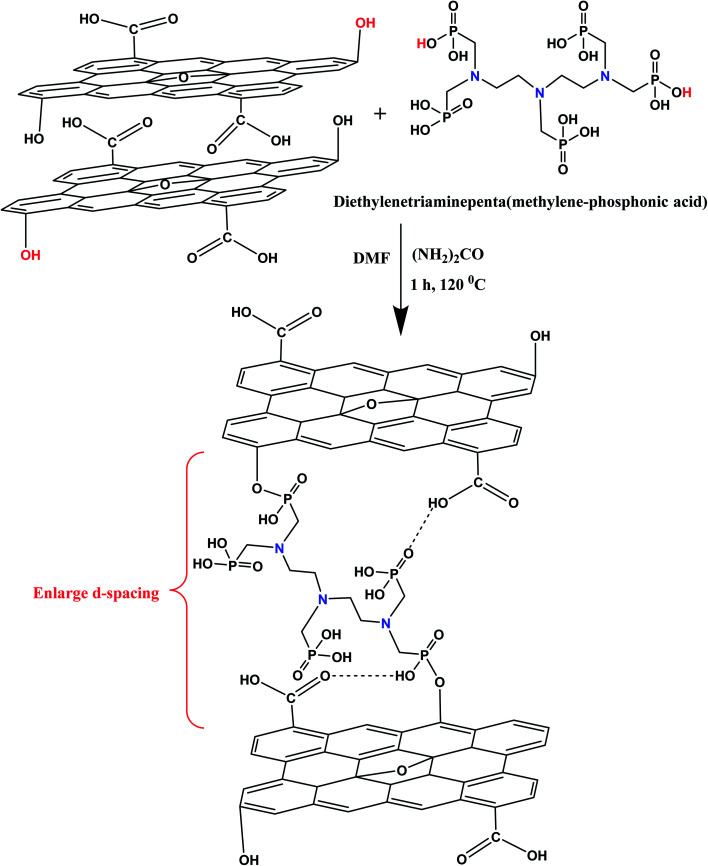
The GO sheets was synthesized from graphite flakes by a modified Hummer's method.33 The detailed synthesis procedure of GO has been given in ESI.† In a typical synthesis procedure, 250 mg of GO powder was added in 100 mL of dimethylformamide and sonicated for 30 minutes with the aid of probe sonicator. The whole GO suspension was stirred with 2 g of urea over a period of 1 h. Afterward, 5 g of diethylenetriamine penta(methylene phosphonic acid) (APA) was added drop wise into a GO suspension with vigorous stirring. The whole reaction mixture was sonicated for 1 h at 120 °C. After cooling, the whole suspension was filtered through a cellulose nitrate membrane (0.22 μm) under vacuum filtration to fabricate the lamellar membrane adsorbent. Afterward, the fabricated membrane was sequentially washed with the aqueous solution of propanol, 0.2 M HNO3 and deionized water (DI) and dried at 60 °C in an air oven for 12 h before further use. The product was abbreviated as GO–APA membrane. Fig. 1 shows the synthesis scheme of GO–APA membrane. To check the stability of membrane the obtained GO–APA membrane was shaken in DI water for 3 h.
Fig. 1. Schematic representation of GO–APA membrane.
Characterization
The surface morphology of GO–APA membrane was characterized by field emission scanning electron microscopy (FESEM, JSM-7800F, JEOL) and high resolution transmission electron microscopy (HRTEM, Technai G2 F30 S-TWIN 300 kv). Energy dispersive spectroscopy (EDS) (QUANTAX X129 eV, Bruker) was conducted to observe the elemental composition of GO–APA membrane. Dynamic force mode of atomic force microscopy (AFM) with semi-contact tip NSG01 having 132.8 kHz resonant frequency (Solver NEXT, NT-MDT) was used study surface topology. X-ray diffractometer (XRD, Rigaku Smart Lab) with Cu Kα radiation at 1.540 Å in the 2θ range of 5–30° is used to study phase determination. The nature of surface groups and chemical bonding was characterized by attenuated total reflectance infrared spectroscopy (FTIR, Bruker Spectrometer) in the wavenumber range of 4000 to 400 cm−1 and X-ray photoelectron spectroscopy (XPS, Thermo ESCALABA 250XI), using monochromatic Al Kα light at 1486.6 eV and an incident angle of 90°. The surface hydrophilicity of GO–APA membrane was tested by water contact angle measurement instrument (SDC-70 Shengding, China) equipped with a camera. For contact angle measurements 5 μL droplet of deionized water was placed onto the GO–APA membrane surface and the sessile drop method was applied to obtain water contact angle values. Images of the water droplets was captured using a camera. The concentration of adsorbed metal ions was determined using inductively coupled plasma optical emission spectroscopy (ICP-OES, Perkin Elmer Avio 200) operating at the axial mode of viewing plasma, using ultrasonic nebulizer and charge-coupled detector. The instrumental operating parameters used are as follows: power – 1.5 kW; injector-alumina injector 2.0; plasma gas – Ar, 8 L min−1; auxiliary gas – 0.2 L min−1; nebulizer gas – 0.7 L min−1; pressure – 3.2 bar; read time – 2 mL min−1; and wavelength (nm) – Cu(ii): 327.393; Pb(ii): 220.353 and Cd(ii): 228.802.
Optimized preconcentration procedure
A glass column (with the length of 10 cm and the diameter of 1 cm) fitted with the GO–APA membrane was used for all the column adsorption experiments. The column was preconditioned with 5 mL of pH 6.0 ± 0.2 buffer solution before use. Each 100 mL of sample solutions contained suitable amount of Cu(ii), Pb(ii) and Cd(ii), maintained at pH 6.0 ± 0.2 were passed through the column at a flow rate of 6 mL min−1 using a peristaltic pump. Afterward, the column was rinsed with deionized water and the adsorbed metal ion was then desorbed with 3 mL of 1 M hydrochloric acid. The concentration of the recovered metal ions in eluent was determined by ICP-OES.
Result and discussions
Characterization of GO–APA membrane
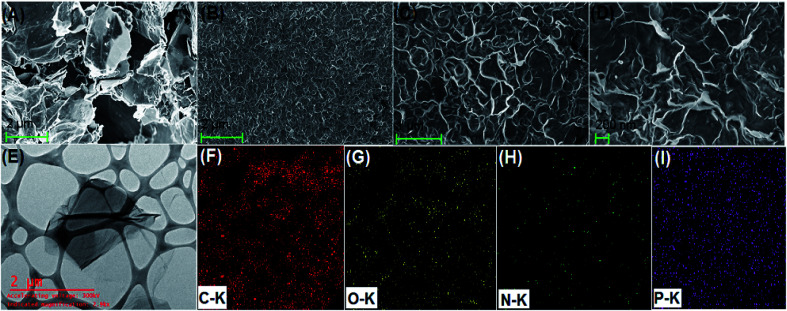
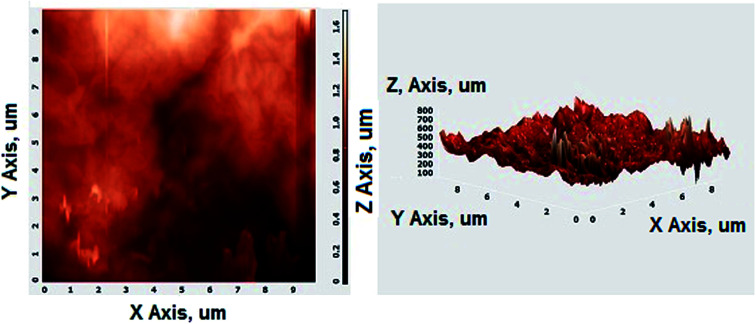
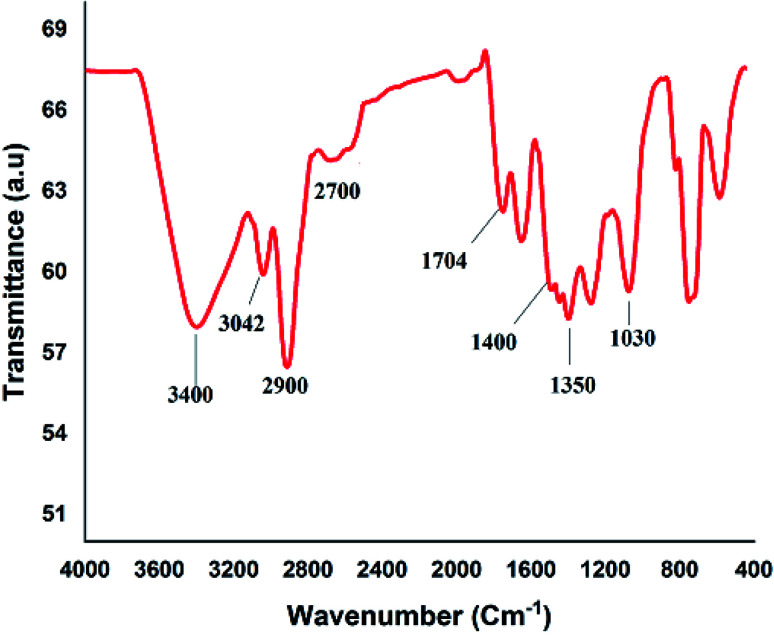
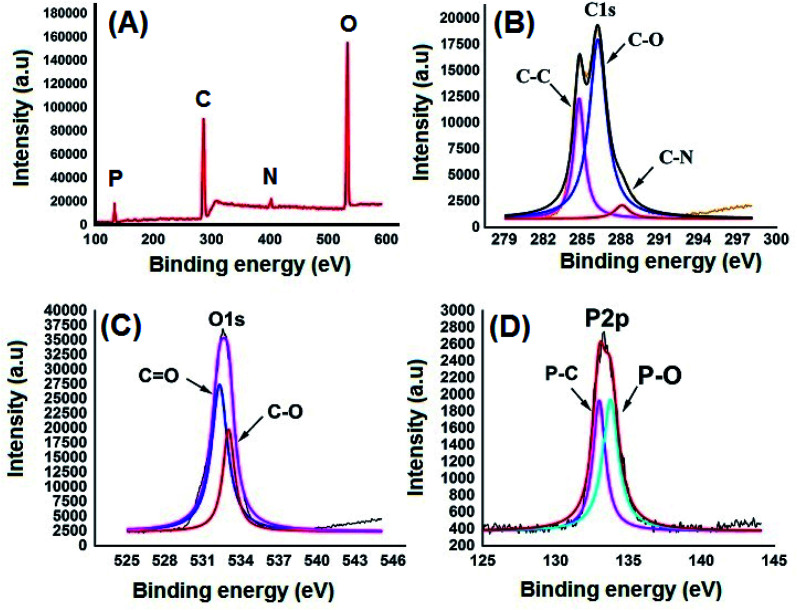
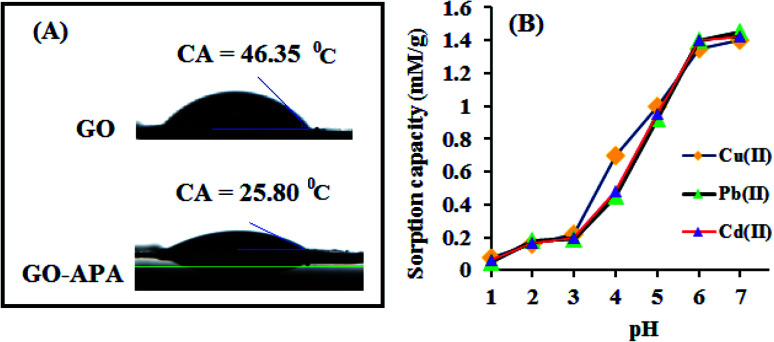
Fig. 2A shows the FESEM image of the bulk GO sheets prepared by Hummers method. The GO sheets are overlapped and shows the folding nature. Fig. 2B–D shows the FESEM images of highly porous GO–APA membrane at varying resolution. A uniformly curved GO sheets was emerged with uniform distribution within the membrane structure after the cross-linking reaction of GO and APA, as shown in high-magnification FESEM images (Fig. 2C and D). Fig. 2E shows the typical HRTEM images of GO, clearly exhibited the single to few layer morphology of GO with high transparency across the GO sheets. Fig. 2F–I shows the elemental mapping of SEM image, illustrates the homogeneous distribution of the constituent surface elements of GO–APA membrane, and the successful immobilization of poly(aminophosphonic acid) onto GO sheets. We further analyze the membrane topography using AFM (Fig. 3) at tapping mode. The porous surface of the membrane was observed from the topography of GO–APA membrane and the height differences of the membrane surface are about tens of nanometers illustrating lamellar architecture of membrane.34,35 From the XRD pattern presented in Fig. S1,† the characteristic diffraction peaks of GO membrane appears at 2θ = 10.41, corresponds to the inter-layer distance of ∼0.84 nm. While GO–APA shows a broad and weak diffraction peak observed at 2θ = 7.38, which corresponded to inter-layer spacing of ∼1.18 nm. It was concluded that after incorporation of amino-phosphonic acid into the GO membrane the inter-layer spacing was significantly increased from 0.84 nm to 1.18 nm. Fig. 4, illustrates the FTIR spectra of GO–APA membrane, the characteristic peaks observed at 3400 cm−1 was attributed to O–H stretching vibrations (–COOH and –OH).36 The peak at 1704 cm−1 is attributes to C O stretching vibration of carbonyl group.37 The peaks at 1400 is associated with C–O stretching vibration of epoxy group. Importantly, the peaks observed at 2700, 1350, and 1030 cm−1, are due to P O, P–O and P–O–C stretching vibrations, respectively, suggested the successful immobilization of poly(aminophosphonic acid) onto the GO sheets.38,39 In addition, the peaks at 3042 and 2900 are attributes to the sp3 C–H and sp2 C–H stretching vibrations, respectively which confirms the presence of both aliphatic and aromatic carbon atom.36,37 The wide scan XPS analyses was performed to further validate the surface elements of the GO–APA membrane40 and the individual elemental details of the XPS results for GO–APA membrane are given in Table 1. The XPS survey spectrum of GO–APA membrane was shown in Fig. 5A, indicates the peaks for C, O, N, and P, and provide direct evidence for the presence of constituent elements of the GO–APA membrane.41 From the deconvoluted C 1s spectra (Fig. 5B), three main peaks are observed at 286, 288 and 285 eV, correspond to C O, C–N and C–C groups of the GO–APA membrane.41 Furthermore, the O1s spectra of prepared membranes was resolved into two peaks observed at 533.5 eV and 532 eV, attributes to C–O and C O bonds, respectively (Fig. 5C).41,42 Similarly, the deconvoluted peaks of phosphorus (Fig. 5D) observed at the binding energy of 134.6 and 132.8 eV, were attributes to the P–O and P–C peaks, respectively,42,43 of the P atom of the APA in GO–APA membrane, indicates the immobilization of APA onto the GO sheets. Fig. 6A depicts the water contact angle measurement image of nascent GO and GO–APA membranes, which illustrates the high hydrophilicity of GO–APA membrane compare to nascent GO membrane due to the presence of higher number of oxygen containing surface functional groups (–COOH, –OH and HPO3). Moreover, no significant leaching of GO sheets was observed during shaking in DI water for 3 h at varying sample pH, suggesting the good stability of GO–APA membrane in water. The stability observed could be due to the formation of strong chemical bonds between GO sheets via amino-phosphonic acid, which was beneficial to prevent the GO sheets leaching from the GO–APA membrane. However, significant degradation of GO membrane was observed at pH 6 and 7.
Fig. 2. FESEM image of nascent GO (A); FESEM image of GO–APA membrane at different resolutions (B–D); HRTEM images of nascent GO (E); and EDS mapping images illustrates elemental composition of GO–APA membrane (F–I).
Fig. 3. AFM images of GO–APA membrane at tapping mode.
Fig. 4. FTIR spectra of GO–APA membrane.
XPS data of the GO–APA membrane.
| Element | Peak position (eV) | Height cps | FWHM | Area (P) cps | Atomic% |
|---|---|---|---|---|---|
| C1s | 286.45 | 1672.17 | 1.48 | 45 543.92 | 42.74 |
| O1s | 533.28 | 33 601.11 | 2.26 | 78 053.23 | 24.48 |
| N1s | 402.13 | 1498.15 | 1.52 | 4665.54 | 8.95 |
| P2p | 133.84 | 2245.38 | 1.65 | 5902.18 | 23.83 |
Fig. 5. XPS survey spectrum of GO–APA membrane (A); and core level high-resolution deconvoluted peaks for C 1s (B); O 1s (C) and P 2p (D) of GO–APA membrane.
Fig. 6. (A) Water contact angle measurement of nascent GO and GO–APA membranes; (B) effect of pH on the extraction of heavy metal ions (sample vol. 100 mL; sorbent amount 10.0 mg; M2+: 250 mg L−1).
Effect of solution pH on the adsorption of metal ions
The sample pH substantially affects the surface charge of GO–APA membrane and the ionic state of metal ions. Herein, the effect of sample pH on the extraction/preconcentration of metal ions was studied at pH 1 to 7, beyond this pH majority of heavy metal ions would form precipitates. The pH of the sample solutions were maintained using a suitable buffer solution. The buffer solutions used for the pH 1.0–2.8, 3.0–3.6, 4.0–6.0, and 7.0 were KCl–HCl, HCl–C2H5O2N, CH3COOH–CH3COONa, and Na2HPO4–C6H8O7, respectively. To observe the effect of sample pH on metal ions adsorption the optimized preconcentration procedure was followed. Briefly, a 100 mL of sample solution contained 250 mg L−1 of metal ions, was maintained to desired pH and passed through the GO–APA packed column. The sorbed metal ions get eluted using a 3 mL of 1 M hydrochloric acid and analysed by ICP-OES. The obtained results are shown in Fig. 6B. The bulk GO membrane was also studied for heavy metal ion extraction at different pH values and the obtained results are presented in ESI (Fig. S2†). The GO–APA membrane shows better results compared to bulk GO membrane packed column. It can be seen that the metal ion adsorption increases with the increase of sample pH. At very low pH values the metal chelating sites such as phosphonic, carboxyl and hydroxyl groups are protonated and restricts the metal ion chelation. At pH 4–7 the adsorption capacity increases significantly with the increase in sample pH, due to the increase in dissociation of functional groups cause decreased in level of competition between the H+ and the M2+ for the same chelating sites. The main mechanism of metal ions adsorption is the complex formation by phosphonic (–HPO3), carboxyl (–COOH), hydroxyl (–OH) and carbonyl (–CO) groups along with the electrostatic interactions.44 On the other hand, the metal ion adsorption efficiency of bulk GO was apparently lower than the GO–APA membrane. This may possibly due to the aggregation of bulk GO sheets in aqueous media and exposure/availability of higher number of chelating sites at GO–APA membrane. In the pH range of 6.0–7.0, complete extraction of heavy metal ions were observed (Fig. 6B), because deprotonation makes the oxygen-containing GO functional groups negatively charged, which facilitates complexation with M2+ owing to the strong electrostatic interactions. Thus, pH 6.0 is set for subsequent experiments.
Effect of sample flow rate
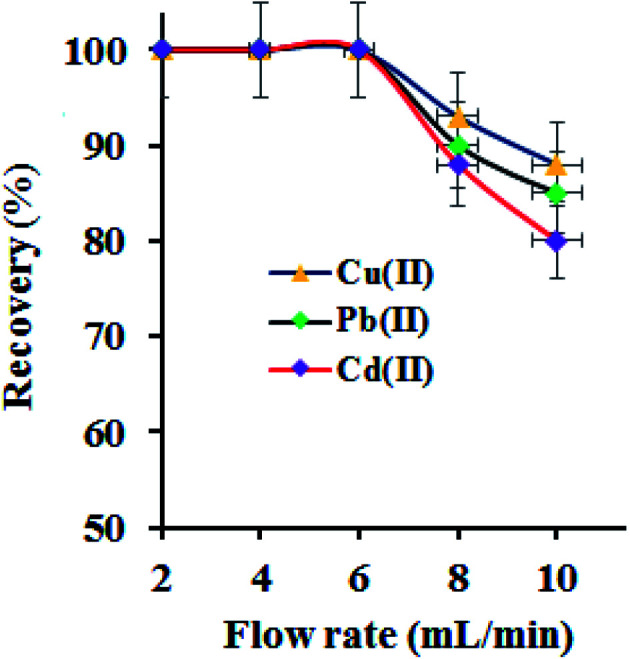
The metal ions extraction performance of GO–APA membrane at varying sample flow rate in a column procedure was examined by passing a series of sample solution (100 mL; M2+: 100 μg L−1), individually at optimized pH 6.0. The column flow rate was maintained at 2–10 mL min−1 using a peristaltic pump. The adsorbed metal ion was eluted and analysed for metal ion concentration. The results are shown in Fig. 7. It was observed that the quantitative extraction of studied metal ions onto GO–APA membrane in a flow through experiment was unaffected up to a flow rate of 6.0 mL min−1, suggested a fairly fast kinetics. On further increasing the sample flow, the adsorption percent of Cu(ii), Pb(ii) and Cd(ii) were gradually decrease up to 65–80% at 8 mL min−1, respectively. Hence, 6.0 mL min−1 of sample flow rate was optimized and selected for subsequent studies. Similarly, to elute the adsorbed metal ions, the flow rate of eluent (3 mL of 1 M hydrochloric acid) was studied and optimized accordingly. A 99.9% of recovery for all heavy metal ions was observed at an eluent flow rate of 3.0 mL min−1 and was applied henceforth.
Fig. 7. Effect of flow rate on the extraction of metal ions (sample pH 6; sample vol. 100 mL; sorbent amount 10.0 mg; M2+: 50 μg L−1).
Type of eluting agent and reusability
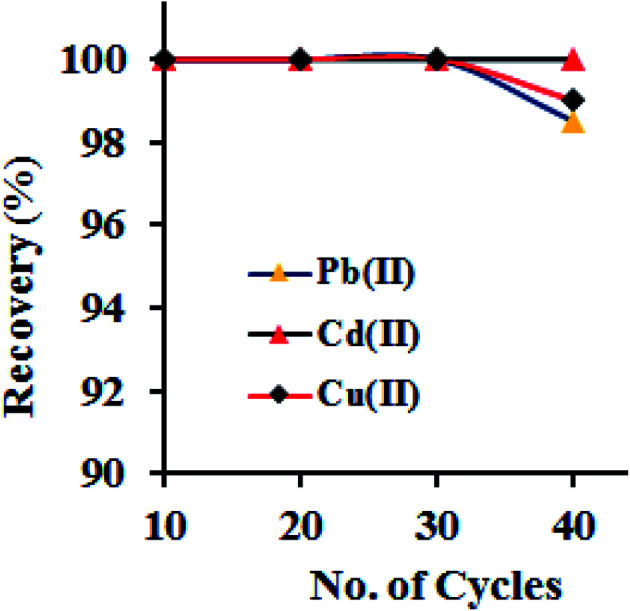
The good adsorption efficiency and the complete recovery of adsorbed metal ions from the adsorbent are the two key parameters for an ideal adsorbent. Briefly, a 100 mL of model solutions (with the concentration of 250 μg L−1), maintained at pH 6.0, were passed through the column at flow rate of 6.0 mL min−1, afterward the desorption of adsorbed metal ions from GO–APA membrane was conducted using different mineral acids such as acetic acid, hydrochloric and nitric acids with varying volumes (2–5 mL) and concentrations (0.5–1.5 M). The obtained results are presented in Table 2. It was concluded that the varying concentrations and volumes of acetic acid was unaffected for complete elution of sorbed metal ions. Similarly, 0.5 M of hydrochloric and nitric acid shows a maximum recovery of 87–96%. However, on further increasing the strength i.e. 3 mL of 1 M hydrochloric acid could elute the adsorbed metal ions completely (recovery > 99.9%). Conclusively, 3.0 mL of 1 M hydrochloric acid was optimized and used as an eluent in further experiments. As the reusability of GO–APA membrane is a crucial parameter in the extraction of metal ions, the GO–APA packed column was subjected to 40 consecutive adsorption–elution cycles following the optimized column procedure. Briefly, a 100 mL of model solutions (with the concentration of 100 μg L−1), maintained at pH 6.0, were passed through the column at flow rate of 6.0 mL min−1, afterward the adsorbed metal ion was eluted/recovered using 3.0 mL of 1 M hydrochloric acid and subsequently determined by ICP-OES. The results are shown in Fig. 8. From figure it can be noticed that the complete extraction of the heavy metal ions was successfully achieved in all consecutive cycles with the analyte recovery of >95.0%. We can concluded that the GO–APA packed column was successfully reused up to several cycles without loss of extraction performance. Therefore, multiple use of the GO–APA membrane in the extraction/preconcentration of trace heavy metal ions from environmental samples is feasible. Moreover, the FESEM observations was also carried out for GO–APA membrane after 40 consecutive cycles. No major changes in the morphology of GO–APA surface was observed after 40 times reusability (Fig. S3†).
Types of eluting agent used for the recovery of sorbed metal ions (experimental conditions: Mn+ = 250 μg L−1, sample volume = 100 mL, pH = 6.0, eluent flow = 1 mL min−1).
| Eluent | Concentration | Volume (mL) | Recovery percentage | ||
|---|---|---|---|---|---|
| Cu(ii) | Pb(ii) | Cd(ii) | |||
| Acetic acid | 0.5 M | 2 | 08 | 05 | 05 |
| 3 | 15 | 12 | 13 | ||
| 5 | 15 | 17 | 15 | ||
| 1 M | 2 | 18 | 12 | 10 | |
| 3 | 20 | 12 | 15 | ||
| 5 | 25 | 20 | 18 | ||
| 1.5 M | 2 | 26 | 28 | 25 | |
| 3 | 30 | 29 | 30 | ||
| 5 | 32 | 30 | 32 | ||
| Hydrochloric acid | 0.5 M | 2 | 48 | 42 | 40 |
| 3 | 75 | 75 | 73 | ||
| 5 | 92 | 90 | 87 | ||
| 1 M | 2 | 75 | 70 | 86 | |
| 3 | 100 | 100 | 100 | ||
| 5 | 100 | 100 | 100 | ||
| 1.5 M | 2 | 94 | 95 | 97 | |
| 3 | 99 | 100 | 100 | ||
| 5 | 100 | 100 | 100 | ||
| Nitric acid | 0.5 M | 2 | 75 | 78 | 74 |
| 3 | 88 | 88 | 87 | ||
| 5 | 95 | 96 | 96 | ||
| 1 M | 2 | 92 | 94 | 96 | |
| 3 | 97 | 98 | 96 | ||
| 5 | 100 | 100 | 98 | ||
| 1.5 M | 2 | 97 | 99 | 100 | |
| 3 | 100 | 100 | 100 | ||
| 5 | 100 | 100 | 100 | ||
Fig. 8. Reusability test for GO–APA membrane for the extraction of metal ions (sample pH 6.0; metal ion 10 mg L−1; column flow rate 6 mL min−1; sorbent amount 10.0 mg; eluent vol. 3 mL).
Effect of alkali and alkaline earth metals
The real water samples usually contain alkali and alkaline earth metals, which manifest interference in the preconcentration and determination of analytes. Generally, cationic matrices participate with the target ions for the same binding sites of the adsorbent resulting in a decrease of the adsorption capacity of the target ion. Moreover, these co-existing ions if present along with samples show spectral interference in the ICP-OES determination. Therefore, it is requisite to assess the adsorption performance of GO–APA in the competitive conditions. The ratio of the interferents to the analyte for various co-existing alkali and alkaline earth metal ions was systematically studied and the obtained results are presented in Table 3. The utmost level of co-ions was determined by passing 100 mL of model solution, each contained 100 μg L−1 of individual metal ion and varying concentration of studied interfering ions through the GO–APA packed column, under optimum conditions. The maximum concentration ratio of interferent to analyte ions resulting in deviation of less than ±5% in the adsorption of analyte ions was set as the tolerance level. It was observed that there was no significant interferences in the adsorption and determination of analyte ions for the whole added ions, with the analyte recovery of 98–100%. Above this tolerance concentration ratio (Table 3), the adsorption of metal ions successively decreases on increasing the interferent amount. In conclusion, under optimized experimental conditions successful quantitative extraction of feeded analyte ions can be achieved in presence of coexisting ions up to a certain limit.
Tolerance limit of co-existing ions on the extraction of metal ions in binary mixture (experimental conditions: pH 6, total volume 100 mL; flow rate 6 mL min−1, metal ions 100 μg L−1).
| Added ions | Tolerance ratio [added ions/metal ion] (μg L−1) | ||
|---|---|---|---|
| Cu(ii) | Pb(ii) | Cd(ii) | |
| Na+ (NaCl) | 1.82 × 10⁴ | 1.82 × 10⁵ | 2.33 × 10⁵ |
| K+ (KCl) | 3.51 × 10⁴ | 5.11 × 10⁴ | 4.52 × 10⁴ |
| NH4+ (NH4Cl) | 3.18 × 10⁴ | 5.25 × 10⁴ | 6.55 × 10⁴ |
| Ca2+ (CaCl2) | 5.82 × 10⁵ | 5.43 × 10⁴ | 5.84 × 10⁴ |
| Mg2+ (MgCl2) | 4.92 × 10⁵ | 5.18 × 10⁴ | 5.12 × 10⁴ |
| CH3COO− (CH3COONa) | 5.82 × 10⁴ | 4.12 × 10⁴ | 5.88 × 10⁴ |
| Cl− (NaCl) | 3.82 × 10⁶ | 3.66 × 10⁶ | 4.42 × 10⁶ |
| Br− (NaBr) | 5.85 × 10⁶ | 5.55 × 10⁶ | 4.96 × 10⁶ |
| SO42− (Na2SO4) | 5.82 × 10⁵ | 5.28 × 10⁵ | 5.88 × 10⁵ |
| CO32− (Na2CO3) | 6.16 × 10⁵ | 5.46 × 10⁵ | 6.34 × 10⁵ |
| NO32− (Na2NO3) | 5.25 × 10⁵ | 6.65 × 10⁵ | 5.12 × 10⁵ |
| Humic acid | 108 | 105 | 125 |
| Fulvic acid | 59.8 | 62 | 68 |
Preconcentration studies
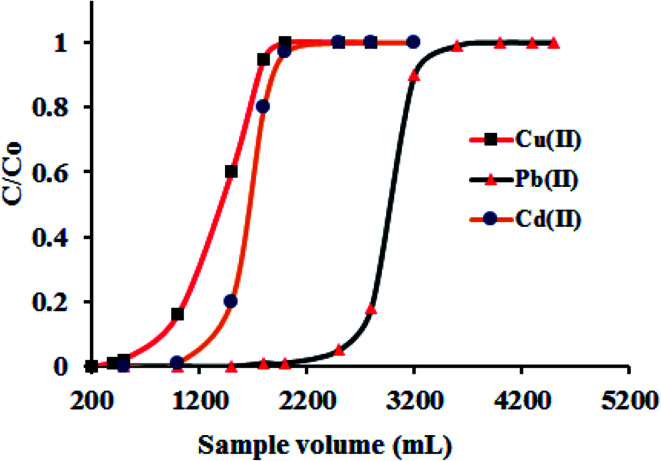
The complex sample matrix and the trace level concentration of metal ions in a sample solution are the two main challenges in quantitative determination of metal ions. In the direct instrumental determination of metal ions, the co-existing ions shows interferences in the analyte determination due to closeness of wavelengths. Also, the accurate determination of trace metal ions exist below the instrumental detection limit (for example FAAS) always remains challenging. Thus, it is customary to isolate the target metal ions from sample complexity and simultaneously bring up their concentration above the instrumental detection limit. The term preconcentration is defined as the analytical procedure by which the trace amount of metal ions can bring out from large sample volume into a smaller sample volume for their accurate determination. The ratio of these two volumes gives the value of preconcentration factor. To examine the lower limit of analyte concentration up to which the quantitative recovery can be attained, a bench of model solutions containing 1.0 μg of metal ions (fixed amount) with varying volume of 1500, 1800, 2000, 2200, 2500, 2700 and 3000 mL, respectively, were percolated through the column under the optimized conditions. After swill the column using deionized water, the adsorbed metal ions was eluted and subsequently determined by ICP-OES. The respective data were elucidated in Table 4. It was observed that up to a sample volume of 2500 mL, Cu(ii) was quantitatively recovered (99.8%), on further increasing the volume to 2700 mL the quantitative adsorption of Cu(ii) was lowers to 75%. Similarly, the recovery of Pb(ii) and Cd(ii) were achieved up to a sample volume of 2200 mL (98.9%) and decreases to 85% at sample volume of 2500 mL. The maximum preconcentration limit (PL = amount of metal ions (μg)/volume of sample solution (L)) achieved for Cu(ii), Pb(ii) and Cd(ii) were 0.40, 0.45 and 0.45 μg L−1 respectively, with the corresponding preconcentration factor (PF = volume of sample solution/volume of eluent) of 833, 733 and 733, respectively. Such a high preconcentration factor fashioned the adsorbent worthy for column use in the ascertainment of trace metal ions with high accuracy. The high number of hydrophilic groups in GO–APA membrane enhanced the preconcentration factor by facilitating the faster attainment of equilibrium between membrane and the metal ions in aqueous solutions. For breakthrough studies, following the optimized column procedure, a sample volume of 200–5000 mL contained 10 mg L−1 of Cu(ii), Pb(ii) and Cd(ii) were passed through the GO–APA packed column. The effluent fractions were collected at certain time intervals and analyzed for metal ion concentrations. The metal ion concentration corresponds to 3–5% of the loading concentration, is consider as a breakthrough volume. The breakthrough curve plotted from the obtained data was presented in Fig. 9. The breakthrough capacities obtained here were closed to the maximum metal ions sorption capacity calculated after the metal ions saturation of active adsorption sites (Table 4) and hence, advantageously favors the applicability of the GO–APA membrane in column technique.
Preconcentration and breakthrough profile for studied metal ions (column parameters: pH 6, flow rate 6 mL min−1, eluent vol. 3 mL).
| Metal ions | Preconcentration studies | Breakthrough studies | ||||
|---|---|---|---|---|---|---|
| Volume | PLa (μg L−1) | PFb | Equilibrium sorption capacity (mg g−1) | Breakthrough volume (mL) | Breakthrough capacity (mg g−1) | |
| Cu(ii) | 2500 | 0.40 | 833 | 88.9 | 1000 | 100.0 |
| Pb(ii) | 2200 | 0.45 | 733 | 294.2 | 2800 | 280.0 |
| Cd(ii) | 2200 | 0.45 | 733 | 159.6 | 1500 | 150.0 |
Preconcentration Limit.
Preconcentration Factor.
Fig. 9. Breakthrough studies for the separation of Cu(ii), Pb(ii) and Cd(ii) (sample pH 6.0; metal ion 10 mg L−1; column flow rate 6 mL min−1; sorbent amount 10.0 mg).
Analytical method validation
The developed method has been validated by assessing the foremost parameters such as linearity (calibration), precision, detection limit (LOD), robustness and accuracy. The calibration curve plotted by the method of least square after preconcentrating the series of standards (100 mL) for Cu(ii), Pb(ii) and Cd(ii), was found linear with the correlation coefficient (R2) value of 0.9999–0.9998 in the concentration range of 1–5000 μg L−1 as shown in Table 5. The precision of the method was characterized by analyzing five replicate synthetic samples (100 mL), containing 3 μg of each metal ion. The coefficients of variation for replicate measurements were found to be 4–5%, indicating the good precision of the method. According to IUPAC definition,45 the LOD evaluated as 3 S m−1 of the mean blank signal for 30 replicate measurements was found to be 1.1 ± 0.5 ng L−1 for Cu(ii), Pb(ii) and Cd(ii). Accuracy of the developed method was assessed by analyzing SRMs following the Student's t test values calculated for Cu(ii), Pb(ii) and Cd(ii) and were found less than the critical Student's t value of 4.303 at the 95% confidence level for N = 3. The results are illustrated in Table 6. No systematic method errors were found as the mean concentration values obtained by the developed method were statistically insignificant when compared with certified values, even in presence of other concomitants. Reliability is another important factor for the developed method which was studied by spiking the real water samples with a known amount of analytes (3 μg). The percentage recoveries were checked for the spiked amount of analytes and were found to be 98–100.6%, having RSD (relative standard deviation) < 5% in the maximum results (Table 7). The robustness of the method was examined by tuning the optimum pH of 6 to 6 ± 0.5 and the flow rate of 8 to 8 ± 0.5 mL min−1 in the solution, and no significant changes in the recovery were found (>95%) for all the analyte ions.
Regression equation for calibration plot with correlation coefficient (R2) (concentration range of 1–5000 μg L−1).
| Metal ion | Regression equation | R 2 |
|---|---|---|
| Cu(ii) | A = 18.9994XCu + 2.1325 | 0.9999 |
| Pb(ii) | A = 109.4504XPb + 4.1676 | 0.9989 |
| Cd(ii) | A = 9.5606XCd + 4.2435 | 0.9998 |
Method validation: analyses of standard reference materials for heavy metal ion content (column parameters: sample volume 100 mL, pH 6, sample flow rate 6 mL min−1, eluent volume 3 mL (HCl) and eluent flow rate 1 mL min−1).
| Samples | Certified values (μg g−1) | Values found by proposed methoda (μg g−1) | Value of t-testb |
|---|---|---|---|
| NIES 10C | Cd: 1.82, Cu: 4.1 | Cd: 1.81 ± 0.06, Cu: 3.9 ± 0.41 | 2.13, 1.44 |
| SRM 1572b | Pb: 13.3, Cu: 16.5 | Pb: 13.1 ± 0.12, Cu: 16.2 ± 0.27 | 1.32, 1.24 |
Mean value ± standard deviation, N = 3.
At 95% confidence level.
Preconcentration and determination of heavy metal ions in real samples using GO–APA membrane (column parameters: pH 6.0, sample flow rate 6 mL min−1, sample volume 1 L; eluent volume 3 mL (HCl) and eluent flow rate 1 mL min−1).
| Samples | Amount added (μg) | Metal ion found (μg L−1) ± standard deviationa (recovery percentage) | ||
|---|---|---|---|---|
| Cu(ii) | Pb(ii) | Cd(ii) | ||
| Electroplating wastewater | 0 | 13.26 ± 1.55 | 4.68 ± 0.84 | 5.29 ± 0.88 |
| 3 | 16.22 ± 0.98 (98.7) | 7.62 ± 0.98 (98.0) | 8.28 ± 0.57 (99.7) | |
| River water | 0 | 8.32 ± 1.24 | 4.22 ± 0.85 | 3.68 ± 0.68 |
| 3 | 11.33 ± 1.22 (100.3) | 7.21 ± 0.36 (99.6) | 6.70 ± 0.48 (100.6) | |
| Ground water | 0 | 2.53 ± 1.24 | 1.55 ± 0.94 | ndb |
| 3 | 5.52 ± 1.28 (99.7) | 4.55 ± 0.86 (100) | 3.02 ± 0.86 (100.6) | |
Replicates = 3.
Not detected.
Application: analysis of real samples
The developed method was successfully employed for the preconcentration and determination of the trace amount of Cu(ii), Pb(ii) and Cd(ii) from electroplating wastewater, river water and ground water samples (1 L). Results were illustrated in Table 7. The reliability of the method was examined by spiking the samples with known amounts of analytes (3 μg). Recoveries of the analyte ions were ascertained by measuring the recovery of the spiked amount from real samples. It was found that the absorbed metal ions were quantified with a 95% confidence level. The mean percentage recoveries of the studied metal ions were 98.0–100.6% with a RSD of less than 5% for the spiked amount of the metal ions.
Conclusion
A new SPE GO–APA membrane was synthesized for the extraction and preconcentration of trace metal ions from complex sample matrix. The increase in interlayer spacing advantageously enhanced water transport across the channels, although hydrophilicity of GO sheets may also need to be taken into account. The free space between the GO–APA membrane layers contained metal ions binding sites which led to higher sorption capacity. The proposed procedure was validated by analyzing standard reference materials and used to clean up the sample and simultaneously miniaturize the sample size to enrich the trace analyte concentration before instrumental analysis. The method detection limit obtained for the studied metal ions was found to be 1.1 ± 0.5 ng L−1. The proposed GO–APA membrane packed column can be therefore potentially applied for the routine analyses of trace metal ions in industrial and environmental water samples.
Conflicts of interest
There are no conflicts to declare.
Supplementary Material
Acknowledgments
The authors extend their appreciation to the Deanship of Scientific Research at the KSU for funding this work through research group project number RG-1440-059.
Electronic supplementary information (ESI) available. See DOI: 10.1039/d1ra01055g
References
- Crichton R. R., Metal Toxicity – An Introduction, in Metal Chelation in Medicine, The Royal Society of Chemistry, 2017, ch. 1, pp. 1–23 [Google Scholar]
- Metal Ion Toxicity, in Encyclopedia of Inorganic Chemistry
- Dabrowiak J. C. Metal Ion Imbalance in the Body. Metals in Medicine. 2017:329–356. doi: 10.1002/9781119191377.ch8. [DOI] [Google Scholar]
- Apostoli P. and Catalani S., Effects of Metallic Elements on Reproduction and Development, in Handbook on the Toxicology of Metals, ed. G. F. Nordberg, B. A. Fowler and M. Nordberg, Academic Press, San Diego, 4th edn, 2015, ch. 20, pp. 399–423 [Google Scholar]
- Hultman P. and Michael Pollard K., Immunotoxicology of Metals, in Handbook on the Toxicology of Metals, ed. G. F. Nordberg, B. A. Fowler and M. Nordberg, Academic Press, San Diego, 4th edn, 2015, ch. 19, pp. 379–398 [Google Scholar]
- Laulicht F., Brocato J., Ke Q. and Costa M., Carcinogenicity of Metal Compounds, in Handbook on the Toxicology of Metals, ed. G. F. Nordberg, B. A. Fowler and M. Nordberg, Academic Press, San Diego, 4th edn, 2015, ch. 18, pp. 351–378 [Google Scholar]
- Lucchini R. G., Aschner M., Bellinger D. C. and Caito S. W., Neurotoxicology of Metals, in Handbook on the Toxicology of Metals, ed. G. F. Nordberg, B. A. Fowler and M. Nordberg, Academic Press, San Diego, 4th edn, 2015, ch. 15, pp. 299–311 [Google Scholar]
- Tchounwou P. B. Yedjou C. G. Patlolla A. K. Sutton D. J. Heavy metal toxicity and the environment. Exper. Suppl. 2012;101:133–164. doi: 10.1007/978-3-7643-8340-4_6. [DOI] [PMC free article] [PubMed] [Google Scholar]
- Ahmad H. Huang Z. Kanagaraj P. Liu C. Separation and preconcentration of arsenite and other heavy metal ions using graphene oxide laminated with protein molecules. J. Hazard. Mater. 2020;384:121479. doi: 10.1016/j.jhazmat.2019.121479. [DOI] [PubMed] [Google Scholar]
- Quinn C. W. Cate D. M. Miller-Lionberg D. D. Reilly T. Volckens J. Henry C. S. Solid-Phase Extraction Coupled to a Paper-Based Technique for Trace Copper Detection in Drinking Water. Environ. Sci. Technol. 2018;52(6):3567–3573. doi: 10.1021/acs.est.7b05436. [DOI] [PubMed] [Google Scholar]
- Abd Ali L. I. Wan Ibrahim W. A. Sulaiman A. Kamboh M. A. Sanagi M. M. New chrysin-functionalized silica-core shell magnetic nanoparticles for the magnetic solid phase extraction of copper ions from water samples. Talanta. 2016;148:191–199. doi: 10.1016/j.talanta.2015.10.062. [DOI] [PubMed] [Google Scholar]
- Molaei K. Bagheri H. Asgharinezhad A. A. Ebrahimzadeh H. Shamsipur M. SiO2-coated magnetic graphene oxide modified with polypyrrole–polythiophene: A novel and efficient nanocomposite for solid phase extraction of trace amounts of heavy metals. Talanta. 2017;167:607–616. doi: 10.1016/j.talanta.2017.02.066. [DOI] [PubMed] [Google Scholar]
- Haseen U. Ahmad H. Preconcentration and Determination of Trace Hg(II) Using a Cellulose Nanofiber Mat Functionalized with MoS2 Nanosheets. Ind. Eng. Chem. Res. 2020;59(7):3198–3204. doi: 10.1021/acs.iecr.9b06067. [DOI] [Google Scholar]
- Yang P. Liu Q. Liu J. Zhang H. Li Z. Li R. Liu L. Wang J. Bovine Serum Albumin-Coated Graphene Oxide for Effective Adsorption of Uranium(VI) from Aqueous Solutions. Ind. Eng. Chem. Res. 2017;56(13):3588–3598. doi: 10.1021/acs.iecr.6b04532. [DOI] [Google Scholar]
- Rahman M. T. Kabir M. F. Gurung A. Reza K. M. Pathak R. Ghimire N. Baride A. Wang Z. Kumar M. Qiao Q. Graphene Oxide–Silver Nanowire Nanocomposites for Enhanced Sensing of Hg2+ ACS Appl. Nano Mater. 2019;2(8):4842–4851. doi: 10.1021/acsanm.9b00789. [DOI] [Google Scholar]
- Scida K. Stege P. W. Haby G. Messina G. A. Garcia C. D. Recent applications of carbon-based nanomaterials in analytical chemistry: critical review. Anal. Chim. Acta. 2011;691(1–2):6–17. doi: 10.1016/j.aca.2011.02.025. [DOI] [PMC free article] [PubMed] [Google Scholar]
- Corps Ricardo A. I. Sánchez-Cachero A. Jiménez-Moreno M. Guzmán Bernardo F. J. Rodríguez Martín-Doimeadios R. C. Ríos Á. Carbon nanotubes magnetic hybrid nanocomposites for a rapid and selective preconcentration and clean-up of mercury species in water samples. Talanta. 2018;179:442–447. doi: 10.1016/j.talanta.2017.11.024. [DOI] [PubMed] [Google Scholar]
- Li W.-k. Shi Y.-p. Recent advances and applications of carbon nanotubes based composites in magnetic solid-phase extraction. TrAC, Trends Anal. Chem. 2019;118:652–665. doi: 10.1016/j.trac.2019.06.039. [DOI] [Google Scholar]
- Zhao P. Jian M. Zhang Q. Xu R. Liu R. Zhang X. Liu H. A new paradigm of ultrathin 2D nanomaterial adsorbents in aqueous media: graphene and GO, MoS2, MXenes, and 2D MOFs. J. Mater. Chem. A. 2019;7(28):16598–16621. doi: 10.1039/C9TA02935D. [DOI] [Google Scholar]
- Liu P. Yan T. Zhang J. Shi L. Zhang D. Separation and recovery of heavy metal ions and salt ions from wastewater by 3D graphene-based asymmetric electrodes via capacitive deionization. J. Mater. Chem. A. 2017;5(28):14748–14757. doi: 10.1039/C7TA03515B. [DOI] [Google Scholar]
- Zawisza B. Skorek R. Stankiewicz G. Sitko R. Carbon nanotubes as a solid sorbent for the preconcentration of Cr, Mn, Fe, Co, Ni, Cu, Zn and Pb prior to wavelength-dispersive X-ray fluorescence spectrometry. Talanta. 2012;99:918–923. doi: 10.1016/j.talanta.2012.07.059. [DOI] [PubMed] [Google Scholar]
- Azzouz A. Kailasa S. K. Lee S. S. Rascón A. J. Ballesteros E. Zhang M. Kim K.-H. Review of nanomaterials as sorbents in solid-phase extraction for environmental samples. TrAC, Trends Anal. Chem. 2018;108:347–369. doi: 10.1016/j.trac.2018.08.009. [DOI] [Google Scholar]
- Liu Q. Shi J. Jiang G. Application of graphene in analytical sample preparation. TrAC, Trends Anal. Chem. 2012;37:1–11. doi: 10.1016/j.trac.2012.03.011. [DOI] [Google Scholar]
- Liu Q. Shi J. Sun J. Wang T. Zeng L. Jiang G. Graphene and Graphene Oxide Sheets Supported on Silica as Versatile and High-Performance Adsorbents for Solid-Phase Extraction. Angew. Chem. 2011;50(26):5913–5917. doi: 10.1002/anie.201007138. [DOI] [PubMed] [Google Scholar]
- Liao Y. Wang M. Chen D. Preparation of Polydopamine-Modified Graphene Oxide/Chitosan Aerogel for Uranium(VI) Adsorption. Ind. Eng. Chem. Res. 2018;57(25):8472–8483. doi: 10.1021/acs.iecr.8b01745. [DOI] [Google Scholar]
- Gu X. Yang Y. Hu Y. Hu M. Wang C. Fabrication of Graphene-Based Xerogels for Removal of Heavy Metal Ions and Capacitive Deionization. ACS Sustainable Chem. Eng. 2015;3(6):1056–1065. doi: 10.1021/acssuschemeng.5b00193. [DOI] [Google Scholar]
- Wu L. K. Wu H. Zhang H. B. Cao H. Z. Hou G. Y. Tang Y. P. Zheng G. Q. Graphene oxide/CuFe2O4 foam as an efficient absorbent for arsenic removal from water. Chem. Eng. J. 2018:1808–1819. doi: 10.1016/j.cej.2017.11.096. [DOI] [Google Scholar]
- Liu L. Ding L. Wu X. Deng F. Kang R. Luo X. Enhancing the Hg(II) Removal Efficiency from Real Wastewater by Novel Thymine-Grafted Reduced Graphene Oxide Complexes. Ind. Eng. Chem. Res. 2016;55(24):6845–6853. doi: 10.1021/acs.iecr.6b01359. [DOI] [Google Scholar]
- Guo X. Mei N. Assessment of the toxic potential of graphene family nanomaterials. J. Food Drug Anal. 2014;22(1):105–115. doi: 10.1016/j.jfda.2014.01.009. [DOI] [PMC free article] [PubMed] [Google Scholar]
- Malina T. Maršálková E. Holá K. Tuček J. Scheibe M. Zbořil R. Maršálek B. Toxicity of graphene oxide against algae and cyanobacteria: Nanoblade-morphology-induced mechanical injury and self-protection mechanism. Carbon. 2019;155:386–396. doi: 10.1016/j.carbon.2019.08.086. [DOI] [Google Scholar]
- Fadeel B. Bussy C. Merino S. Vázquez E. Flahaut E. Mouchet F. Evariste L. Gauthier L. Koivisto A. J. Vogel U. Martín C. Delogu L. G. Buerki-Thurnherr T. Wick P. Beloin-Saint-Pierre D. Hischier R. Pelin M. Candotto Carniel F. Tretiach M. Cesca F. Benfenati F. Scaini D. Ballerini L. Kostarelos K. Prato M. Bianco A. Safety Assessment of Graphene-Based Materials: Focus on Human Health and the Environment. ACS Nano. 2018;12(11):10582–10620. doi: 10.1021/acsnano.8b04758. [DOI] [PubMed] [Google Scholar]
- Gies V. Zou S. Systematic toxicity investigation of graphene oxide: evaluation of assay selection, cell type, exposure period and flake size. Toxicol. Res. 2018;7(1):93–101. doi: 10.1039/C7TX00278E. [DOI] [PMC free article] [PubMed] [Google Scholar]
- Hummers W. S. Offeman R. E. Preparation of Graphitic Oxide. J. Am. Chem. Soc. 1958;80(6):1339. doi: 10.1021/ja01539a017. [DOI] [Google Scholar]
- Hu M. Mi B. Enabling Graphene Oxide Nanosheets as Water Separation Membranes. Environ. Sci. Technol. 2013;47(8):3715–3723. doi: 10.1021/es400571g. [DOI] [PubMed] [Google Scholar]
- Xie Q. Zhang S. Xiao Z. Hu X. Hong Z. Yi R. Shao W. Wang Q. Preparation and characterization of novel alkali-resistant nanofiltration membranes with enhanced permeation and antifouling properties: the effects of functionalized graphene nanosheets. RSC Adv. 2017;7(30):18755–18764. doi: 10.1039/C7RA00928C. [DOI] [Google Scholar]
- Prusty K., Barik S. and Swain S. K., A Correlation Between the Graphene Surface Area, Functional Groups, Defects, and Porosity on the Performance of the Nanocomposites, in Functionalized Graphene Nanocomposites and their Derivatives, ed. M. Jawaid, R. Bouhfid, and A. e. Kacem Qaiss, Elsevier, 2019, ch. 13, pp. 265–283 [Google Scholar]
- Rattana Chaiyakun S. Witit-anun N. Nuntawong N. Chindaudom P. Oaew S. Kedkeaw C. Limsuwan P. Preparation and characterization of graphene oxide nanosheets. Procedia Eng. 2012;32:759–764. doi: 10.1016/j.proeng.2012.02.009. [DOI] [Google Scholar]
- Larkin P. J., Illustrated IR and Raman Spectra Demonstrating Important Functional Groups, in Infrared and Raman Spectroscopy, ed. P.J. Larkin, Elsevier, 2nd edn, 2018, ch. 8, pp. 153–210 [Google Scholar]
- Larkin P. J., IR and Raman Spectra–Structure Correlations: Characteristic Group Frequencies, in Infrared and Raman Spectroscopy, ed. P.J. Larkin, Elsevier, 2nd edn, 2018, ch. 6, pp. 85–134 [Google Scholar]
- Al-Gaashani R. Najjar A. Zakaria Y. Mansour S. Atieh M. A. XPS and structural studies of high quality graphene oxide and reduced graphene oxide prepared by different chemical oxidation methods. Ceram. Int. 2019;45(11):14439–14448. doi: 10.1016/j.ceramint.2019.04.165. [DOI] [Google Scholar]
- Sitko R. Turek E. Zawisza B. Malicka E. Talik E. Heimann J. Gagor A. Feist B. Wrzalik R. Adsorption of divalent metal ions from aqueous solutions using graphene oxide. Dalton Trans. 2013;42(16):5682–5689. doi: 10.1039/C3DT33097D. [DOI] [PubMed] [Google Scholar]
- Canepa P. Gonella G. Pinto G. Grachev V. Canepa M. Cavalleri O. Anchoring of Aminophosphonates on Titanium Oxide for Biomolecular Coupling. J. Phys. Chem. C. 2019;123(27):16843–16850. doi: 10.1021/acs.jpcc.9b04077. [DOI] [Google Scholar]
- Viornery C. Chevolot Y. Léonard D. Aronsson B.-O. Péchy P. Mathieu H. J. Descouts P. Grätzel M. Surface Modification of Titanium with Phosphonic Acid To Improve Bone Bonding: Characterization by XPS and ToF-SIMS. Langmuir. 2002;18(7):2582–2589. doi: 10.1021/la010908i. [DOI] [Google Scholar]
- Ghazaghi M. Mousavi H. Z. Rashidi A. M. Shirkhanloo H. Rahighi R. Graphene-silica hybrid in efficient preconcentration of heavy metal ions via novel single-step method of moderate centrifugation-assisted dispersive micro solid phase extraction. Talanta. 2016;150:476–484. doi: 10.1016/j.talanta.2015.12.074. [DOI] [PubMed] [Google Scholar]
- Long G. L. Winefordner J. D. Limit of Detection A Closer Look at the IUPAC Definition. Anal. Chem. 1983;55(07):712A–724A. [Google Scholar]
Associated Data
This section collects any data citations, data availability statements, or supplementary materials included in this article.


