

Abstract

Different scaffold biomaterials are being investigated as a solution for bone loss due to disease or trauma. The aim of this study is the fabrication, characterization, and in vitro biological evaluation of a novel polycaprolactone (PCL) nanoscaffold incorporating pomegranate peel extract (PG) for bone regeneration. Using electrospinning, three groups of scaffolds were prepared: the control group PCL and two groups of PCL with PG concentrations (11 and 18 weight %). The antioxidant activity and the total phenolic content (TPC) of the fabricated nanoscaffolds were evaluated, in addition to the porosity and degradation measurement. Cultured osteoblasts derived from rabbit bone marrow mesenchymal stem cells were used for the assessment of cell proliferation and attachment on the scaffold’s surface. Scaffolds’ characterization showed uniform nanofibers (NFs) with a fiber diameter range of 149–168 nm. Meanwhile, higher antioxidant activity and TPC of the PG groups were detected. Furthermore, total porosities of 59 and 62% were determined for the PCL–PG scaffolds. An increased degradation rate and significant improvement in cell proliferation and cell attachment were revealed for the PCL–PG fabricated scaffolds. Such incorporation of natural food waste, PG, in PCL NFs offered novel PCL–PG scaffolds as a promising candidate for bone regeneration applications.
1. Introduction
Bone loss in the human body is anticipated to follow numerous causes such as removal of a pathologic condition (tumor, cyst, etc.), trauma, infection, or extraction. Additionally, it results from congenital deformation, periodontal disease, or bone resorption. The use of a proper bone substitute material is inevitable for the correction of bone defects to allow the rehabilitation of the patient. Advances in tissue engineering and the integration of biological, physical, and engineering sciences create new solutions for bone regeneration that include growth factors, natural fillers, incorporation of mesenchymal stem cells, and biomimetic scaffolds.1
Different fabrication methods are used for scaffold preparation; among them, the electrospinning technique is widely used to produce micro- and nanofibers (NFs), highly recommended for cartilage and bone tissue engineering applications. Such NFs are characterized by their morphological resemblance to the natural extracellular matrix (ECM) of osseous tissues in addition to their large surface area to volume ratio.2−4
An electrospinning setup is composed of a capillary spinneret through which the electrospun polymer solution is injected by a pump. A high voltage source is responsible for the injection of charge into the liquid, and then, it will be collected on a collector. The high electric voltage causes the electrostatic forces to balance out the surface tension of the liquid, leading to the development of a Taylor cone. When this applied voltage is increased, a fiber jet is ejected from the apex of the cone and then accelerated toward the collector.5 The processing parameters that influence the electrospinning process are the applied voltage, the flow rate, and the capillary–collector distance. While the solution parameters are the polymer concentration (viscosity), solvent volatility, and solvent conductivity. Adjustment of the processing parameters and the solution parameters is mandatory as they affect the fiber diameter, fiber porosity, and beads that may be formed in fibers.6 Nowadays, materials used for scaffolds designed for bone tissue regeneration can be polymers, bioactive ceramics, or combinations between them. Also, natural materials were successfully loaded into scaffolds designed for bone regeneration like collagen, gelatin, fibronectin, and chitosan, in addition to some herbal extracts such as curcumin and aloe vera.7−13 Addition of such natural components to the scaffolds enhances the cells’ viability, their attachment to the scaffold, and an increased calcium deposition and collagen content in the newly formed tissues around the scaffolds. Jain et al. reported sustained release of curcumin from a fabricated electrospun nanofibrous PCL scaffold containing curcumin. This natural component allowed an elevated preosteoblast proliferation and better osteogenesis offering a promising scaffold for bone regeneration.12
Among the recent advances in bone scaffolds, hydrogels were introduced as scaffold materials for bone regeneration. Hydrogels are considered an interesting class of polymers; they have a 3D flexible network with great ability of retaining large amounts of water or biological fluid, making them injectable and able to conform to 3D defects upon gelation.14,15 They have some unique advantages such as their ability to respond to environmental changes, pH changes, temperature changes, and electric or magnetic changes, thus mimicking the ECM to a great extent. Bao et al. developed a novel acid-responsive composite hydrogel scaffold by incorporating nanocalcium carbonate in the composite hydrogel; hence, it can control the calcium supply and regulate the mechanical properties of the scaffold for enhanced bone regeneration. The incorporated nanocalcium carbonate could be released gently at the bone defect site, and thus, it improved the mineralization and allowed better osteogenesis.16
Polycaprolactone (PCL) has been known for a long time as one of the most commonly used synthetic polymers in the field of bone tissue engineering due to its biocompatibility and biodegradability,17 in addition to its excellent electrospinnablility.13 Koupaei and Karkhaneh fabricated a porous scaffold by combining PCL with hydroxyapatite (HA). They used the alkaline phosphatase (ALP) activity to confirm the osteoconductivity of the scaffold proving that the PCL/HA network is a potential scaffold for tissue engineering applications.18 Also, Li et al. used the electrospinning technique and developed a fibrous nanocomposite scaffold of PCL with pretreated HA with c-glycidoxypropyltrimethoxysilane (A-187). They found a great improvement in the mechanical properties and bioactivity of the fabricated scaffolds allowing successful bone regeneration.3 Moreover, Harikrishnan et al. produced a composite scaffold of PCL and nanohydroxyapatite. The fabricated electrospun scaffold revealed an increase in the osteogenesis with a considerable increase in bone regeneration compared to plain PCL scaffold.19
Among the herbal products used in tissue engineering, pomegranate, Punica granatum, a fruit widely distributed throughout the Mediterranean region of Northern Africa, has shown extreme benefits according to many researchers. It has many favorable medicinal advantages as it was proved to have potent antimicrobial,20 antimutagenic,21 anticancer, antidiarrheal, and antidiabetic effects.22 This herb with high phenolic content could enhance bone healing and prevents bone loss, in addition to the effect of its extract on the osteoblasts’ differentiation and proliferation. Moreover, pomegranate peel extract (PG) affects the inhibition of osteoclasts’ activity; thus, it plays an important role in bone remodeling.23−26
In this study, using PG rich in phenolic compounds, we hypothesized that the incorporation of such a natural component in the PCL electrospun scaffold may impart a beneficial effect on osteoblastic proliferation and attachment which pave the way for using it in bone regeneration.
2. Results
2.1. Characterization of NFs
2.1.1. Microstructural Analysis (Scanning Electron Microscopy)
Scanning electron microscopy (SEM) analysis and fiber diameter measurement of the control group, PCL NF samples, revealed a fiber diameter distribution between 120 and 200 nm with an average fiber diameter of 168.29 (±48) nm, Figure 1. While for the PCL–PG11 NF samples, SEM analysis and fiber diameter measurement revealed a fiber diameter distribution between 100 nm and 200 nm with an average fiber diameter of 149.46 (±38) nm, Figure 2. The SEM analysis and fiber diameter measurement of PCL–PG18 NF samples revealed a fiber diameter distribution between 100 and 220 nm with an average fiber diameter of 156.79 (±44) nm, Figure 3.
Figure 1.

PCL NF, SEM (A) 1000×, (B) 10,000×, and (C) fiber diameter distribution.
Figure 2.

PCL–PG11 NF, SEM (A) 1000×, (B) 10,000×, and (C) fiber diameter distribution.
Figure 3.

PCL–PG18 NF, SEM (A) 1000×, (B) 10,000×, and (C) fiber diameter distribution.
2.1.2. Fourier Transform Infrared Spectroscopy
The Fourier transform infrared (FTIR) spectroscopy of the PG, Figure 4, showed different sharp peaks, among such peaks (3927 to 3610.9 cm–1) revealing the presence of a N–H group and R-NH2 group (primary and secondary amines). Also, at 3650.9 cm–1 which is relevant to the presence of the O–H stretching denoting alcohol and 1741.4 cm–1 denoting C=O stretch which is characteristic of esters and saturated aliphatic compounds. While the FTIR spectroscopy of the three groups, PCL NF, PCL–PG11 NF, and PCL–PG18 NF, Figure 4, revealed common peaks present in the three groups of NFs, 3400, 2940, and 1108.2 cm–1 which are relevant to the OH group, C–H stretching, and C–O stretching, showing the presence of alcohol (or phenol), alkanes, and secondary alcohols, respectively. Some peaks were only present in the two groups of NFs containing the extract. 1365, 1294, and 961 cm–1 revealing O–H bending, C–O stretching, and C=C bending, indicating the presence of phenols (/alcohols), aromatic ester (/alcohol), and alkene, respectively. Meanwhile, peaks detected only for the PCL NF were 1724, 1635.9, and 1240 cm–1, relevant to C=O stretching, N–H bending, and asymmetric C–O–C stretching, revealing the presence of aldehyde, alkene, and ethers, respectively.27,28
Figure 4.

FTIR spectroscopy of different groups of NFs.
2.1.3. Antioxidant Activity and TPC of NFs
Means and standard deviations (SDs) of 2,2-diphenyl-1-picryl-hydrazyl-hydrate (DPPH) % scavenging activity (antioxidant activity) and total phenolic content (TPC) are presented in Table 1. The results showed that the highest antioxidant activity and the highest TPC were detected in PCL–PG18 NF followed by PCL–PG11 NF. However, the least antioxidant activity and TPC were recorded in the PCL NF group.
Table 1. Antioxidant Activity by the DPPH Test and TPC by the Folin–Ciocalteu Test of the Different Scaffold Groupsa.
| NF groups | antioxidant activity | TPC |
|---|---|---|
| PCL NF | 2.49 ± 1.99c | 0.12 ± 0.002c |
| PCL–PG11 NF | 73.306 ± 0.46b | 11.20 ± 2.02b |
| PCL–PG18 NF | 76.66 ± 1.54a | 15.95 ± 0.05a |
Data are represented as mean (±SD) and compared using Tukey’s post hoc test (n = 3). Different small superscript letters indicate a significant difference in the same column (P < 0.05).
2.2. Results of Release Kinetics of PG from PCL Composite NFs
The in vitro release profile of the PCL–PG11 NF and PCL–PG18 NF shows almost the same profile, as observed from the graph in Figure 5; the PCL–PG11 NF and PCL–PG18 NF released 10 and 20% of the extract, respectively, over the first 3 h. Then, the released extract increased gradually till reaching the burst effect at 24 h (approximately 32% for the PCL–PG11 NF and 50% for the PCL–PG18 NF). Thereafter, the release profile continued in a sustained manner for the next 48 h and up to 72 h (35% for the PCL–PG11 NF and 50% for the PCL–PG18 NF).
Figure 5.

Release pattern of PG from PCL–PG11 NF and PCL–PG18 NF.
According to release kinetics, the data of the two groups (PCL–PG11 NF and PCL–PG18 NF) were collected and are shown in Table 2. When the obtained release data of the two groups were fitted to the zero-order kinetic equation, the regression values (r2) were small for both groups (ranging between 0.87 and 0.67), demonstrating that the release kinetics did not follow the zero-order equation. Similarly, for the first-order, Hixson Crowell, and Higuchi models, all the (r2) values were small for both groups and below 0.96 and 0.82 for PCL–PG11 NF and PCL–PG18 NF, respectively. Conversely, the data of extract release profiles were further fitted to the Korsmeyer–Peppas equation (log cumulative percentage of PG released vs log time) and showed the highest regression values (r2) over the other kinetic models for both groups, showing 0.97 and 0.90 for PCL–PG11 NF and PCL–PG18 NF.
Table 2. Kinetics Data of Pomegranate Peel Extract Release from NFsa.
| zero-order |
first-order |
Hixson
Crowell |
Higuchi |
Korsmeyer–Peppas |
|||||||
|---|---|---|---|---|---|---|---|---|---|---|---|
| K | r2 | K | r2 | K | r2 | K | r2 | Kk | r2 | n | |
| PCL–PG11 NF | 0.56 | 0.87 | 0.02 | 0.76 | 0.02 | 0.80 | 5.22 | 0.96 | 9.53 | 0.97 | 0.14 |
| PCL–PG18 NF | 0.61 | 0.67 | 0.01 | 0.76 | 0.01 | 0.80 | 5.94 | 0.82 | 14.42 | 0.90 | 0.14 |
r2 is the regression coefficient, Kk is diffusion constant and n is the diffusion exponential.
According to the Korsmeyer–Peppas model, both groups, PCL–PG11 NF and PCL–PG18 NF, had a diffusion exponential (n) of 0.14, while the diffusion constant (k) was 9.53 min–1 for the PCL–PG11 NF group and 14.42 min–1 for the PCL–PG18 NF group.
2.3. Porosity Results
2.3.1. BET Results
For the three studied samples, PCL NF, PCL–PG11 NF, and PCL–PG18 NF, their thermal isotherm was described as a type II isotherm, which is a completely reversible isotherm; adsorption and desorption have the same path. This indicates a macroporous material, having pores with a pore size greater than 50 nm. The type II isotherm is accompanied by hysteresis of type H3, meaning nonrigid aggregates of plate-like particles, denoting that the pore shape is slit-like.29,30
For the pore distribution analysis, in both PCL NF and PCL–PG11 NF groups, the BJH adsorption dV/dlog(D) pore volume graph showed two highest peaks, indicating that most pore volume occurs with an average pore diameter of 229 and 125 nm. Besides, a small peak was detected, denoting little pore volume with an average pore diameter of 11.4 nm. For the PCL–PG18 NF sample, the two highest peaks detected denote that the most pore volume occurs with an average pore diameter of 260.9 and 132.1 nm. Also, two small peaks were detected, denoting little pore volume with an average pore diameter of 48.8 and 11.5 nm.
A Brunauer–Emmett–Teller (BET) test of the three tested groups (PCL NF, PCL–PG11 NF, and PCL–PG18 NF) revealed that the three groups have nearly the same total measured surface area of NFs with different pore volume distributions, as shown in Table 3.
Table 3. BET Results of the Three Groups of Scaffoldsa.
| sample | BET surface area (m2/g) | total pore volume of pores (cm3/g) | BJH adsorption cumulative volume of pores (cm3/g) |
|---|---|---|---|
| PCL NF | 10.7996 | 0.028783 | 0.032469 |
| PCL–PG11 NF | 8.1374 | 0.019156 | 0.021078 |
| PCL–PG18 NF | 9.5398 | 0.023693 | 0.027052 |
2.3.2. Mercury Intrusion Results
The results of a mercury intrusion porosimeter (MIP) revealed a total porosity % of 56.03, 59.42, and 62.54% for the PCL NF, PCL–PG11 NF, and PCL–PG18 NF, respectively, while the macropores % were 85.24, 90.62, and 93.73%, and the mesopores % were 14.66, 4.54, and 6.15% for the same groups, respectively.
2.4. Degradation Study Results
The results revealed that the highest water sorption % was recorded in both PCL–PG11 NF and PCL–PG18 NF at all tested time intervals, 7, 14, and 21 days. However, no significant difference in the sorption % was found at the different time periods (P > 0.05) (Table 4).
Table 4. Mean ± SD Values for the Sorption % in the Different Investigated NFs at Different Time Intervalsa.
| group/time | 7 days | 14 days | 21 days |
|---|---|---|---|
| PCL NF | 13.27 ± 11.87bB | 17.15 ± 8.17bB | 91.26 ± 51.16bA |
| PCL–PG11 NF | 215.32 ± 23.92aA | 202.84 ± 11.44aA | 209.68 ± 13.43aA |
| PCL–PG18 NF | 222.82 ± 15.67aA | 242.20 ± 46.01aA | 201.07 ± 12.017aA |
Different small letters indicate a significant difference within the same column for every time point. Different capital letters indicate a significant difference within the same row for every material type (P > 0.05).
The results also revealed that the highest mean weight loss % was recorded in PCL–PG11 NF and PCL–PG18 NF at all tested time intervals. However, no significant difference was found at the different time periods (P > 0.05) (Table 5).
Table 5. Mean ± SD Values for the Weight Loss % in the Different Investigated NFs at Different Time Intervalsa.
| group/time | 7 days | 14 days | 21 days |
|---|---|---|---|
| PCL NF | 4.79 ± 2.53bB | 6.58 ± 2.58bAB | 12.19 ± 2.45bA |
| PCL–PG11 NF | 12.25 ± 5.27abA | 17.05 ± 0.80aA | 18.82 ± 4.49abA |
| PCL–PG18 NF | 14.65 ± 3.18aA | 20.59 ± 4.81aA | 22.42 ± 2.3aA |
Different small letters indicate a significant difference within the same column for every time point. Different capital letters indicate a significant difference within the same row for every material type (P < 0.05).
2.5. Results of the In Vitro Biological Evaluation
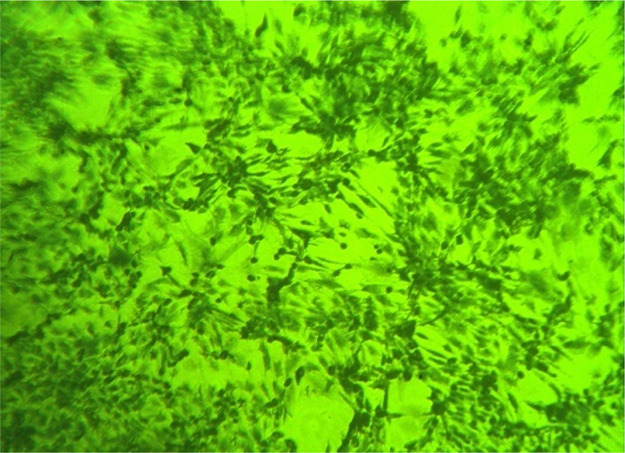
2.5.1. Osteogenic Differentiation
The different stages of bone marrow cell expansion and differentiation are presented in Figure 6, while the osteogenic phenotype of cultured cells after 2 weeks was confirmed by the Alizarin red stain that colors HA calcium complexes in the ECM red, Figure 7, denoting the osteogenic differentiation of MSCs.
Figure 6.

(A) First stage, plastic adherent fibroblast colony-forming unit (black arrows) showing central dividing cells, I.P.C.M. × 100, (B) second stage, increased number of thin adherent spindle-shaped fibroblasts, I.C.P.M. × 100, and (C) third stage, cuboidal confluent osteoblast-like cells postinduction of osteogenic differentiation, I.P.C.M. × 200.
Figure 7.

Alizarin red staining showing osteoblasts and red-colored bone nodules, I.P.C.M. 100×.
2.5.2. MTT Cytotoxicity Assay
Upon comparing the NF groups to the blank control in the 3-(4,5-dimethyl-2-thiazolyl)-2,5-diphenyl-2H-tetrazolium bromide (MTT) assay over 24 and 72 h, Figures 8 and 9, a significant increase in mean viability % was observed, Table 6. However, the mean viability % after 24 and 72 h was insignificantly different (p-value > 0.05) among all the three groups of NFs. Hence, the prepared NFs are biocompatible and have no cytotoxic effect on the osteoblasts. Moreover, the proliferation rate was improved with the nanofibrous groups, namely, PCL NF, PCL–PG11 NF, and PCL–PG18 NF.
Figure 8.

Bottom of the well plate showing confluent cells growing beside the scaffold (black arrows) at the second day of culture before the MTT assay, I.P.C.M. × 40.
Figure 9.
Bottom of the well plate of the MTT assay showing the confluent osteoblasts with the bluish precipitate of formazan salts, I.P.C.M. × 100.
Table 6. Mean Viability % of OB-BMMSCs on Nanoscaffolds Using the MTT Assay at 24 and 72 ha.
| mean viability (%) 24 h ± SD | mean viability (%) 72 h ± SD | |
|---|---|---|
| control | 100 ± 3.80b | 100 ± 2.77b |
| PCL NF | 123.7049 ± 3.93a | 111.81 ± 4.03a |
| PCL–PG11 | 121.3008 ± 4.11a | 110.8562 ± 2.13a |
| PCL–PG18 | 116.8575 ± 4.18a | 103.697 ± 2.24ab |
Data are represented as mean (±SD) and compared using Tukey’s post hoc test (n = 5). Different small superscript letters indicate a significant difference in the same column (P < 0.05).
2.5.3. Assessment of Cell Attachment on Scaffolds
SEM images of PCL NF seeded with cells for 7 days showed cells elliptical in shape and attached to the NFs. The cell surface was irregular, indicating their active secretion of the osteogenic matrix, Figure 10.
Figure 10.

SEM micrograph showing cells elliptical in shape attached to the PCL NF and actively secreting the osteogenic matrix (black arrows). 1500×.
The cells seeded on the PCL–PG11 NF and PCL–PG18 NF showed many osteoblasts attached and embedded with the NFs. Some osteoblasts had preosteogenic bright vesicles on their surface denoting an early osteogenic activity. The osteoblasts were elliptical, extending their processes, and attached to the scaffold material, with areas of the osteogenic matrix. Many parts of the PG-loaded scaffolds maintained their nanofibrous structure and porosity, Figure 11.
Figure 11.

SEM micrograph of the prepared NFs showing (A) osteoblasts embedded and attached to PCL–PG11 NF (black arrows showing osteoblasts), 1000×; (B) osteoblasts embedded in the PCL–PG18 NF with a preosteogenic bright vesicle on osteoblast surface (white arrow), 3500×; (C) osteoblasts (black arrows) attached to PCL–PG18 NF with an irregular surface and vesicle (white arrow) denoting their osteogenic activity and areas of the expected osteogenic matrix (dotted arrows), 2000×.
3. Discussion
In the current study, a novel polymeric scaffold containing Punica granatum was fabricated. This modification aimed to improve cell proliferation and scaffold porosity which may solve some of the problems of polymeric scaffolds used for bone tissue engineering.
PCL was the polymer of choice in this study as it is an FDA-approved biocompatible polymer with optimum mechanical properties suitable for bone tissue.31 Fabrication of our scaffold using PCL polymer by electrospinning necessitates its dissolution as a first step. Formic acid (FA) was used as proposed by Liverani and Boccaccini and Van der Schueren,32,33 as it evaporates completely in room atmosphere34 and it decreased the fiber diameter and bead formation during the electrospinning, compared with other solvents like the chloroform.35−38
For PG preparation, freeze-drying of pomegranate peels was performed, as described by Ambigaipalan et al., to ensure complete dryness without exposing the peels to any heating source. Al-Rawahi et al. found that the dryness of peels in the oven, by air drying, or even in sunlight affected the pomegranate phenolic compounds.39,40 After complete dryness, methanol was used for extraction as recommended by Elfalleh et al. and Negi and Jayaprakasha who obtained pomegranate extracts with richer phenolic contents when using methanol compared to water and ethanol.41,42 The importance of the antioxidant agents and the phenolic compounds in bone regeneration is explained by their ability to prevent the decrease in bone density and bone microarchitecture impairment. They can reduce osteoclast differentiation and bone resorption by the inhibition of the major osteoclast markers. In addition, they can stimulate the osteoblastic ALP activity and mineralization as proved in cell culture.26 The antioxidant activity could also prevent the oxidative damage occurring in the protein, lipid, and nucleic acid of the human body due to the increased reactive oxygen species favoring the proliferation of the osteoblasts, especially in cases of bone loss.25,43 Moreover, polyphenolic compounds have the ability to stimulate the proliferation of osteoblast and human bone marrow stem cells (osteoblast progenitor cells), improving their osteogenic potential.44
Regarding the electrospinning conditions, the voltage used for the electrospinning of the PCL solutions and the PCL solutions loaded with PG was 18.5 and 23.5 kV, respectively. These voltages allowed the collection of electrospun NFs without producing any electrical arcs inside the electrospinning chamber and without any beads in the NFs. This was in agreement with Gönen et al. who reported electric arcs in the electrospinning chamber with voltages higher than 25 KV.45 However, electrospinning of PCL–PG11 and PCL–PG18 needed a higher voltage (23.5 kV) compared to PCL due to the presence of the extract and hence a higher voltage was mandatory.
The collector–needle tip distance was adjusted at 15 cm. At a shorter distance, electrical arcs were observed in the chamber, especially with high voltages, in addition to bead formation. While increasing the distance above 15 cm, the whole electrospinning procedure failed. The flow rate was adjusted at 0.5 mL/h for all samples. A previous study reported that higher flow rates could increase the fiber diameter and the tendency toward bead formation in the electrospun fibers.46
The microstructure analysis of the obtained electrospun NFs was performed where the uniform and bead-free NFs were the criteria on which NFs were selected. Although the mechanism of bead formation is still unknown, as reported in the literature, their occurrence is not favorable as it indicates that a certain amount of solvent was entrapped inside these beads, and it was not completely evaporated. The presence of solvent remnants in the NFs affects their properties and their application massively.47
The measured mean fiber diameter in this study of PCL NF was 168.29 nm with a fiber diameter distribution ranging between 120 and 200 nm. These findings were consistent with the results obtained by Yari et al. who prepared PCL NF with a fiber diameter distribution that ranged from 101 and 150 nm and an average fiber diameter of 116.03 nm. They used the same polymer concentration and the same solvent with nearly the same electrospinning parameters.48 Also, Gounani et al. prepared PCL NF with a fiber diameter range between 156 and 179 nm, considered to be in the same range of the prepared fibers in this study.49
Meanwhile, the results showed that loading the PCL solution with different concentrations of PG (11 and 18%) produced NFs with smaller diameters (149 and 156 nm, respectively). This might be attributed to the higher voltage used for electrospinning PCL–PG11 and PCL–PG18 (23.5 kV). It was found that the addition of PG to PCL solution necessitates the use of higher voltage to allow electrospinning, and hence, the higher voltage used affected the conductivity and the degree of jet stretching. This was also reported by Pillay et al. who studied the different parameters that could influence the electrospinning of NFs.46
Regarding the FTIR spectroscopy analysis of the PG extract and the different investigated NFs, the results revealed diagnostic peaks of PCL as reported by previous work of Lobo et al. The main peaks attributed to PCL were indexed as follows: 1724 cm–1 (C=O stretching) and 1,240 cm–1 (asymmetric C–O–C stretching).50 These peaks were present in the three groups of NFs prepared. Other peaks, denoting phenols and alcohols, were present in the PCL–PG11 NF and PCL–PG18 NF confirming the incorporation of the PG rich in phenolic content into the PCL NF. Though these peaks were not typical of that detected in the phenolic extract itself, this could be explained by the change occurring to the PG when it was combined with the PCL polymer in a nanofibrous form.
The release study revealed that the PG followed the Korsmeyer–Peppas model. This confirms that both diffusion and erosion were involved in releasing the extract from the NFs, as explained by Stulzer et al.51 Moreover, the detected n-values were below 0.45 for both PCL–PG11 NF and PCL–PG18 NF. This implied that the release of PG followed Fickian behavior in which the release was mainly caused by a tiny swelling of NFs followed by diffusion of the extract. The recorded K-value was also higher for the PCL–PG18 NF (14.42 min–1) compared to that of PCL–PG11 NF (9.53 min–1), indicating a higher diffusion rate or release kinetics from PCL–PG18 NF than the other group. This could be attributed to the higher concentration of PG in this group (18%).
Using both the BET test and MIP for porosity measurement, were beneficial as the MIP ensured the interconnectivity of pores in the scaffolds, while the nanopores were determined precisely by the nitrogen sorption method. The presence of a certain amount of nanopores (5–50 nm) is useful for the crystallization of hydroxycarbonate apatite and cell adhesion, as reported by Almeida et al.52 Moreover, the results of the BET test followed that obtained by mercury intrusion, as they both revealed that the pores in the fabricated scaffolds were mainly macropores.
The mercury intrusion method confirmed that the pores of the scaffold were interconnected and not dead-end, which is mandatory in any scaffold designed for tissue regeneration. This allows cell infiltration, migration, vascularization, nutrient transport, and waste removal during scaffold degradation.52
Furthermore, the results revealed an increase in the total porosity % linked with increasing the amount of the PG in the NFs. Such an increase in porosity (within an acceptable range to avoid a negative effect on the mechanical properties) is favorable as it replicates the highly porous structure of cancellous bone. Velasco et al. reported that no definite optimal porosity or pore size could be described for scaffolds designed for bone regeneration. However, a porosity range between 50 and 90% is acceptable if the scaffolds are not subjected to mechanical loads.53
Also, it was observed from the pore distribution calculations that the % of macropores increased (larger than 50 nm) and the % of mesopores (2 to 50 nm) decreased in the PG-loaded scaffolds compared to that in the PCL NF scaffolds. This means that the surface area of pores increased, leading to a total increase in the surface area of NFs. This is very beneficial for proper bone cell ingrowth, vascularization, and nutrient delivery to the center of the regenerating tissues, as reported by Almeida et al.52 This explains the increase in the adhesion and attachment of cells on PG scaffolds. Also, SEM showed that the osteoblasts were attached with their processes, were completely embedded in the nanofibrous structure, and were actively secreting an osteogenic matrix preparing for bone ingrowth. These results are in accordance with Abbasi et al. who reported that bone regeneration into porous scaffolds depends greatly on scaffold pore size, as bone ingrowth was more prominent in their in vivo study in 100 μm pore-sized scaffolds. Moreover, Croisier et al., 2012, reported that a pore size of nearly 300 μm is required for osteoblast infiltration and bone formation.54,55
Previous studies reported a slow degradation rate of PCL, which might prolong up to 2 years, due to the presence of hydrolytically labile aliphatic ester bonds,53 though with the addition of PG to the PCL scaffolds significant improvement in the PCL degradation was noticed at all time intervals. This could be considered advantageous as it might allow better cellular infiltration of osteoblasts, more release of the active constituents of PG from the scaffold, benefiting from its medicinal properties and hence better bone regeneration.
The attachment and embedding of osteoblasts on the PG-loaded NFs were similar to the SEM description reported by Jain et al. who found nearly the same osteoblast morphology and attachment on their prepared PCL/curcumin NFs, verifying the positive effect of adding natural extracts on cell attachment and proliferation to polymeric scaffolds.12
We can clearly state from the results of this study that the addition of PG to PCL scaffolds enhanced the antioxidant activity of the polymeric scaffold by nearly 96%, in addition to an improved TPC. Additionally, proper porosity distribution and interconnectivity were reflected on the remarkable attachment and embedding of the osteoblasts on the PG-loaded scaffolds with an improvement in the degradation rate compared to the PCL scaffolds.
4. Conclusions
Within the limitations of this study, we concluded that the addition of PG to PCL NFs led to the formation of PCL–PG scaffolds with proper porosity, pore size diameter distribution, and an increased degradation rate compared to the PCL scaffold. The experimentally fabricated PCL–PG scaffolds showed a significant improvement in osteoblasts’ attachment and proliferation in comparison to the negative control group.
These conclusions demonstrate that the incorporation of natural food waste, PG, in the PCL scaffolds improved its properties, offering new environmentally friendly, economically reasonable nanoporous biocompatible scaffolds as candidates for better bone regeneration. To the best of our knowledge, this is the first report on combining PG with PCL in an electrospun nanofibrous scaffold with superior porosity, degradation, cell attachment, and proliferation.
5. Experimental Section
5.1. Materials
PCL in the form of pellets (molecular weight 80,000), methanol (≥99.8% (GC) purity), DPPH, and Folin–Ciocalteu reagent (Folin) were purchased from Sigma-Aldrich Co. (USA). FA of 98/100% purity was obtained from Thermo Fisher Scientific (USA). As for gallic acid, it was purchased from Merck Millipore Co. (Germany), while the phosphate-buffered saline (PBS) was purchased from Lonza, Belgium, and 3-(4,5-dimethyl-2-thiazolyl)-2,5-diphenyl-2H-tetrazolium bromide (MTT) was obtained from SERVA Electrophoresis GmbH (Germany). Sodium Carbonate was obtained from El-Nasr pharmaceutical chemicals (Egypt) and Alizarin Red S Monohydrate was purchased from MP Biomedicals, LLC (USA). The osteogenic media was prepared from Dulbecco’s modified Eagle’s medium with 4.5 g/L glucose and with l-glutamine and Ham’s F-12 with l-glutamine, purchased from BioWhittaker Lonza (USA), the fetal bovine serum was obtained from HiMedia (Brazil), and the antib-anti (100×) penicillin/streptomycin/amphotericin (antibiotic-antimycotic) was obtained from Gibco Life Technologies Co., (USA). Finally, the β-glycerophosphate disodium salt hydrate and dexamethasone (9α-fluoro-16α-methylprednisolone) were obtained from AppliChem GmbH (Germany) with l-ascorbic acid Na salt from SERVA Electrophoresis GmbH (Germany).
5.2. Methods
5.2.1. Preparation of PCL, the PG Extract, and PCL–PG Solutions
Dissolution of PCL in FA was performed using a magnetic stirrer overnight to obtain a homogenous PCL solution of 14% concentration (control group). For the PG solution, pomegranate was collected in its harvesting season. The peels were washed thoroughly, dried in a freeze-dryer (BIOBASE, China) for 24 h, and then ground using a mechanical mixer. The peel powder was soaked in methanol and kept in the dark at room temperature for 48 h, followed by centrifugation for 10 min at 8000 rpm. The obtained extract solution was freeze-dried for 72 h to get a dry solid powder ready to be mixed with PCL.
For the PCL–PG solutions, PCL pellets and the freeze-dried PG powder (wt/wt) were mixed and dissolved in FA overnight to obtain two homogenous clear solutions ready for electrospinning, 14% PCL with 11% PG concentration (PCL–PG11) and 14% PCL with 18% PG concentration (PCL–PG18). The two concentrations of the PG were selected based on a performed pilot study, where different random concentrations of PG were tried. Then, the selection was based on certain fiber criteria (absence of beads in the fibers, no intermingling of fibers, fibers’ uniformity, proper fiber diameter distribution, and presence of porosity), in addition to the antioxidant activity and TPC of the obtained fibers. The pilot study is present in detail in the Supporting Information section.
5.2.2. Electrospinning of PCL and PCL–PG NFs
The prepared PCL, PCL–PG11, and PCL–PG18 solutions were electrospun using an in-house electrospinning set-up (Sino MDT Syringe Pump SN-50 C6). The electrospinning of the different solutions was conducted at a flow rate of 0.5 mL/h for 12 h with a 15 cm distance between the needle tip and the collector, covered with aluminum foil for the deposition of NFs. The voltage used was set at 18.5 kV for the PCL control group and 23.5 kV for the PCL–PG solutions.
5.2.3. Characterization of NFs
5.2.3.1. SEM Analysis of NFs
The electrospun NFs were gold sputtered and analyzed with SEM, Zeiss-Supra 55 Leo, Germany, and the fiber diameter (100 fiber diameters for each sample) was measured using ImageJ software,56 followed by OriginLab Software (Origin(Pro), OriginLab Corporation, Northampton, MA, USA). A histogram was plotted, and the results of the fiber diameter were reported as mean ± SD for each group. Moreover, elemental energy dispersive X-ray (EDX) analysis was performed for the PG extract (study present in the Supporting Information section).
5.2.3.2. FTIR Spectroscopy
The molecular structures of PG and NFs of the three groups, PCL NFs (PCL NF), PCL NFs containing 11% PG (PCL–PG11 NF), and PCL NFs containing 18% PG (PCL–PG NF18), were studied with the aid of FTIR (Thermo Fisher Scientific Nicolet 380 Spectrophotometer, USA) at 4000–400 cm–1.
5.2.3.3. Antioxidant Analysis of NFs
A DPPH inhibition test was performed for the antioxidant analysis of the three NF groups. The same amount of NFs from each group was weighed, immersed in 2.5 mL of methanol and 1 mL of DPPH reagent (0.5 mmol concentration), and shaken for 24 h in tightly sealed dark containers. Then, centrifugation was performed for 5 min at 10,000 rpm. Examination of the supernatant with a spectrophotometer (CARY 500 SCAN Varian, Hi-tech, NJ, USA) at 517 nm was performed, and scavenging inhibition % of the NFs was calculated using the following equation57−59
5.2.3.4. TPC of NFs
To determine the TPC of the obtained NFs, the Folin–Ciocalteu test was performed, where the same amount of NFs from the different prepared solutions was weighed and placed in 2.5 mL of Folin solution (10% v/v aqueous). Then, 2 mL of an aqueous sodium carbonate solution was added to the fibers, and the samples were shaken for 24 h in tightly dark sealed containers and centrifuged for 5 min at 10,000 rpm. Examination of the supernatant by the spectrophotometer at 765 nm was performed, and the TPC of the NFs was calculated and expressed as gallic acid equivalents (mg/g) according to the obtained gallic acid standard calibration curve with an R2 of 0.9827.
5.2.4. Release Kinetics Study of PG from PCL–PG NFs
10 mg of each NF group was individually placed in a dialysis bag containing 2 mL of PBS and methanol. The bag was inserted in a falcon tube filled with 8 ml of the same media, and the tube was shaken gently at room temperature. After, 1 mL of the media was aspirated with a pipette for analysis from the falcon tube at different time intervals, 3, 6, 12, 24, 48, and 72 h. The media of the PCL NF was used as a blank during the measurement of the released extract in the media surrounding the NFs of the two other groups.
The total cumulative amount of PG (mg) released in the volume of the medium (mL) was estimated through UV–vis spectrophotometer at 270 nm, and the experiment was performed in triplicate, and average values were reported. The percentage of cumulative PG released was calculated using the following equation58,60
where Mt is the cumulative amount of PG released at each time interval and M0 is the initial amount of the PG present in the NFs (11 and 18%).
To study the kinetic profile of PG release from the NFs, data were treated according to zero-order (cumulative percentage of drug released vs time), first-order (log cumulative percentage of drug remaining vs time), Higuchi (cumulative percentage of drug released vs square root of time), Korsmeyer–Peppas (log cumulative percentage of drug released vs log time), and Hixson–Crowell (cube root of cumulative percentage of drug remaining vs time) equations.61
5.2.5. Porosity Measurement
Two different methods were used to measure the porosity of the different investigated PCL–PG extract composites.
5.2.5.1. BET Method
For nanoporosity measurement, the BET method was performed. 0.5 g of each NF group, PCL NF, PCL–PG11 NF, and PCL–PG18 NF, was weighed and cut into squares of 3 mm2. The surface area of nanofibrous sheets was calculated using the nitrogen gas physical adsorption method with a Micromeritics ASAP 2020 surface area analyzer.
5.2.5.2. MIP
The porosity of the fabricated nanofibrous scaffold was measured using a MIP (pore sizer; model 9320, Micrometrics USA). The total percent porosity and the pore diameter distribution, macro-, meso-, and micropores, in the NFs were recorded.
5.2.6. Degradation Analysis
For measurement of degradation using the weight loss method, water sorption of the different investigated groups was initially evaluated at different time intervals (7, 14, and 21 days). Three sets of NF samples were prepared. Each sample was prepared in the form of a square of 1 cm2, and their weights were recorded as Wo. Then, samples were immersed in 10 mL of PBS, (pH = 7.5) for 21 days, and the mean of five samples in each group was recorded. After each time interval, the sample was removed carefully from PBS, wiped gently with filter paper, and then weighed (Ww). For dryness, samples were kept for 2 h in an incubator at 40 °C and then at room temperature for another 24 h. The dried samples were weighed (Wr). Samples were kept in a shaker at a controlled temperature of 37 °C for the different time intervals.
The following equations were used to calculate water sorption % and weight loss percentage (WL %), respectively62
where Ww is the weight of the sample after removal from PBS and before drying and Wr is the weight of the dried sample.
where Wo is the original weight of the sample and Wr is the weight of the dried sample.
5.2.7. In Vitro Biological Evaluation
5.2.7.1. Isolation of Mesenchymal Stem Cells and Osteoblast Culture
With the approval of the Research Ethics Committee, bone marrow-derived mesenchymal stem cells (BM-MSCs) were obtained from a young male albino rabbit (age = 12 weeks and weight = 1.25 kg). Primary isolation and culture of BM-MSCs were performed, followed by osteogenic differentiation carried out according to the Hofmann et al. protocol.63 Osteogenic differentiation was confirmed by the histochemical stain, Alizarin Red S, and examined with an inverted phase contrast microscope (Olympus America Inc., USA).23
5.2.7.2. Cytotoxicity Test
Cytotoxicity was measured by the MTT assay, following the Shokrzadeh and Modanloo protocol64 using the third passage of differentiated cells. The nanofibrous scaffolds (5 samples/group) were cut in squares of 0.4 cm2 and sterilized using ultraviolet radiation for 45 min for each side.50
Cultured osteoblasts derived from rabbit bone marrow mesenchymal stem cells (OB-BMMSCs) were lifted from the culture vessel by trypsinization, counted by a hemocytometer, and seeded at a density of 4000 cells/cm2 in multiwell plates overnight. Scaffolds were incubated with cells for two time intervals (24 and 72 h). Optical density (OD) was measured at an absorbance of 492 nm using an ELISA microplate reader (Bio-Rad, USA). Growth media containing OB-BMMSCs without any scaffolds were used as the negative control.
To calculate % cell viability, the following equation was used, and the results were represented as mean ± SD.65,66
5.2.7.3. Assessment of Cell Attachment on Scaffolds
For assessment of cell attachment on scaffolds, three samples of each group of NFs were prepared, sterilized, and placed in 24-well plate as previously mentioned for the MTT assay. The well plate was then incubated for 1 week, and media were changed twice during the incubation period. Protocol of cell fixation was performed according to Thompson et al.67 Samples were then gold sputtered and examined under SEM.
5.2.8. Statistical Analysis
All statistical analyses for numerical data were analyzed by Tukey’s post hoc test one-way ANOVA., using GraphPad Prism version 7.00 for Windows, GraphPad Software, La Jolla, California, USA. The results were expressed as mean ± SD with a significance level of P < 0.05.
Acknowledgments
The authors are grateful for the financial support received from The American University in Cairo (AUC) through the Faculty Research Support Grant.
Supporting Information Available
The Supporting Information is available free of charge at https://pubs.acs.org/doi/10.1021/acsomega.1c04608.
Pilot study for the selection of the two PG extract concentrations in addition to an EDX analysis of the PG extract (PDF)
The authors declare no competing financial interest.
Supplementary Material
References
- Bose S.; Roy M.; Bandyopadhyay A. Recent Advances in Bone Tissue Engineering Scaffolds. Trends Biotechnol. 2012, 30, 546–554. 10.1016/j.tibtech.2012.07.005. [DOI] [PMC free article] [PubMed] [Google Scholar]
- Mallick S.; Tripathi S.; Srivastava P. Advancement in Scaffolds for Bone Tissue Engineering: A Review. IOSR J. Pharm. Biol. Sci. 2015, 10, 37–54. 10.9790/3008-10143754. [DOI] [Google Scholar]
- Li L.; Li G.; Jiang J.; Liu X.; Luo L.; Nan K. Electrospun fibrous scaffold of hydroxyapatite/poly (ε-caprolactone) for bone regeneration. J. Mater. Sci.: Mater. Med. 2012, 23, 547–554. 10.1007/s10856-011-4495-0. [DOI] [PubMed] [Google Scholar]
- Yang W.; Both S. K.; Van Osch G. J.; Wang Y.; Jansen J. A.; Yang F. Performance of Different Three-Dimensional Scaffolds for in Vivo Endochondral Bone Generation. Eur. Cells Mater. 2014, 27, 350–364. 10.22203/ecm.v027a25. [DOI] [PubMed] [Google Scholar]
- Sill T. J.; von Recum H. A. Electrospinning: Applications in Drug Delivery and Tissue Engineering. Biomaterials 2008, 29, 1989–2006. 10.1016/j.biomaterials.2008.01.011. [DOI] [PubMed] [Google Scholar]
- Huang Z.-M.; Zhang Y.-Z.; Kotaki M.; Ramakrishna S. A Review on Polymer Nanofibers by Electrospinning and Their Applications in Nanocomposites. Compos. Sci. Technol. 2003, 63, 2223–2253. 10.1016/S0266-3538(03)00178-7. [DOI] [Google Scholar]
- Weszl M.; Skaliczki G.; Cselenyák A.; Kiss L.; Major T.; Schandl K.; Bognár E.; Stadler G.; Peterbauer A.; Csönge L.; Lacza Z. Freeze-dried human serum albumin improves the adherence and proliferation of mesenchymal stem cells on mineralized human bone allografts. J. Orthop. Res. 2012, 30, 489–496. 10.1002/jor.21527. [DOI] [PubMed] [Google Scholar]
- Martins A.; Chung S.; Pedro A. J.; Sousa R. A.; Marques A. P.; Reis R. L.; Neves N. M. Hierarchical Starch-Based Fibrous Scaffold for Bone Tissue Engineering Applications. J. Tissue Eng. Regener. Med. 2009, 3, 37–42. 10.1002/term.132. [DOI] [PubMed] [Google Scholar]
- Bhumiratana S.; Grayson W. L.; Castaneda A.; Rockwood D. N.; Gil E. S.; Kaplan D. L.; Vunjak-Novakovic G. Nucleation and Growth of Mineralized Bone Matrix on Silk-Hydroxyapatite Composite Scaffolds. Biomaterials 2011, 32, 2812–2820. 10.1016/j.biomaterials.2010.12.058. [DOI] [PMC free article] [PubMed] [Google Scholar]
- Barbani N.; Guerra G. D.; Cristallini C.; Urciuoli P.; Avvisati R.; Sala A.; Rosellini E. Hydroxyapatite/Gelatin/Gellan Sponges as Nanocomposite Scaffolds for Bone Reconstruction. J. Mater. Sci.: Mater. Med. 2012, 23, 51–61. 10.1007/s10856-011-4505-2. [DOI] [PubMed] [Google Scholar]
- Mohammadi Y.; Soleimani M.; Fallahi-Sichani M.; Gazme A.; Haddadi-Asl V.; Arefian E.; Kiani J.; Moradi R.; Atashi A.; Ahmadbeigi N. Nanofibrous Poly(ε-Caprolactone)/Poly(Vinyl Alcohol)/Chitosan Hybrid Scaffolds for Bone Tissue Engineering using Mesenchymal Stem Cells. Int. J. Artif. Organs 2007, 30 (2), 204–211. 10.1177/039139880703000305. [DOI] [PubMed] [Google Scholar]
- Jain S.; Krishna Meka S. R.; Chatterjee K. Curcumin Eluting Nanofibers Augment Osteogenesis toward Phytochemical Based Bone Tissue Engineering. Biomed. Mater. 2016, 11, 055007. 10.1088/1748-6041/11/5/055007. [DOI] [PubMed] [Google Scholar]
- Shanmugavel S.; Reddy V. J.; Ramakrishna S.; Lakshmi B.; Dev V. G. Precipitation of Hydroxyapatite on Electrospun Polycaprolactone/Aloe Vera/Silk Fibroin Nanofibrous Scaffolds for Bone Tissue Engineering. J. Biomater. Appl. 2014, 29, 46–58. 10.1177/0885328213513934. [DOI] [PubMed] [Google Scholar]
- Ullah F.; Othman M. B. H.; Javed F.; Ahmad Z.; Akil H. M. Classification, processing and application of hydrogels: A review. Mater. Sci. Eng. C 2015, 57, 414–433. 10.1016/j.msec.2015.07.053. [DOI] [PubMed] [Google Scholar]
- Abbass M. M. S.; El-Rashidy A. A.; Sadek K. M.; Moshy S. E.; Radwan I. A.; Rady D.; Dörfer C. E.; Fawzy El-Sayed K. M. Hydrogels and Dentin-Pulp Complex Regeneration: From the Benchtop to Clinical Translation. Polymers (Basel) 2020, 12, 2935. 10.3390/polym12122935. [DOI] [PMC free article] [PubMed] [Google Scholar]
- Bao Z.; Gu Z.; Xu J.; Zhao M.; Liu G.; Wu J. Acid-Responsive Composite Hydrogel Platform with Space-Controllable Stiffness and Calcium Supply for Enhanced Bone Regeneration. Chem. Eng. J. 2020, 396, 125353. 10.1016/j.cej.2020.125353. [DOI] [Google Scholar]
- Chuenjitkuntaworn B.; Inrung W.; Damrongsri D.; Mekaapiruk K.; Supaphol P.; Pavasant P. Polycaprolactone/Hydroxyapatite Composite Scaffolds: Preparation, Characterization, and in Vitro and in Vivo Biological Responses of Human Primary Bone Cells. J. Biomed. Mater. Res., Part A 2010, 94, 241–251. 10.1002/jbm.a.32657. [DOI] [PubMed] [Google Scholar]
- Koupaei N.; Karkhaneh A. Porous Crosslinked Polycaprolactone Hydroxyapatite Networks for Bone Tissue Engineering. Tissue Eng. Regener. Med. 2016, 13, 251–260. 10.1007/s13770-016-9061-x. [DOI] [PMC free article] [PubMed] [Google Scholar]
- Harikrishnan P.; Islam H.; Sivasamy A. Biocompatibility Studies of Nanoengineered Polycaprolactone and Nanohydroxyapatite Scaffold for Craniomaxillofacial Bone Regeneration. J. Craniofac. Surg. 2019, 30, 265–269. 10.1097/SCS.0000000000004857. [DOI] [PubMed] [Google Scholar]
- Abou Zekry S. S.; Abdellatif A.; Azzazy H. M. E. Fabrication of Pomegranate/Honey Nanofibers for Use as Antibacterial Wound Dressings. Wound Med. 2020, 28, 100181. 10.1016/j.wndm.2020.100181. [DOI] [Google Scholar]
- Akhtar S.; Ismail T.; Fraternale D.; Sestili P. Pomegranate Peel and Peel Extracts: Chemistry and Food Features. Food Chem. 2015, 174, 417–425. 10.1016/j.foodchem.2014.11.035. [DOI] [PubMed] [Google Scholar]
- Lansky E. P.; Newman R. A. Punica Granatum (Pomegranate) and Its Potential for Prevention and Treatment of Inflammation and Cancer. J. Ethnopharmacol. 2007, 109, 177–206. 10.1016/j.jep.2006.09.006. [DOI] [PubMed] [Google Scholar]
- Siddiqui S.; Arshad M. Osteogenic potential of punica granatum through matrix mineralization, cell cycle progression and runx2 gene expression in primary rat osteoblasts. Daru, J. Pharm. Sci. 2014, 22, 72. 10.1186/s40199-014-0072-7. [DOI] [PMC free article] [PubMed] [Google Scholar]
- Kim Y. H.; Choi E. M. Stimulation of Osteoblastic Differentiation and Inhibition of Interleukin-6 and Nitric Oxide in MC3T3-E1 Cells by Pomegranate Ethanol Extract. Phyther. Res. Phytother. Res. 2009, 23, 737–739. 10.1002/ptr.2587. [DOI] [PubMed] [Google Scholar]
- Bahtiar A.; Arifin S.; Razalifha A.; Qomariah N.; Puspita E.; Arsianti A. Polar Fraction of Punica Granatum L . Peel Extract Increased Osteoblast Number on Ovariectomized Rat Bone. Int. J. Tradit. Herb. Med. 2014, 2, 65–70. [Google Scholar]
- Spilmont M.; Léotoing L.; Davicco M.-J.; Lebecque P.; Miot-Noirault E.; Pilet P.; Rios L.; Wittrant Y.; Coxam V. Pomegranate Peel Extract Prevents Bone Loss in a Preclinical Model of Osteoporosis and Stimulates Osteoblastic Differentiation in Vitro. Nutrients 2015, 7, 9265–9284. 10.3390/nu7115465. [DOI] [PMC free article] [PubMed] [Google Scholar]
- Coates J.Interpretation of Infrared Spectra, A Practical Approach. Encyclopedia of Analytical Chemistry; Wiley, 2006; pp 10815–10837. [Google Scholar]
- Mohammed G. J.; Al-Jassani M. J.; Hameed I. H. Anti-Bacterial, Antifungal Activity and Chemical Analysis of Punica Grantanum (Pomegranate Peel) Using GC-MS and FTIR Spectroscopy. Int. J. Pharmacogn. Phytochem. Res. 2016, 8, 480–494. [Google Scholar]
- Thommes M.; Kaneko K.; Neimark A. V.; Olivier J. P.; Rodriguez-Reinoso F.; Rouquerol J.; Sing K. S. W. Physisorption of Gases, with Special Reference to the Evaluation of Surface Area and Pore Size Distribution (IUPAC Technical Report). Pure Appl. Chem. 2015, 87, 1051–1069. 10.1515/pac-2014-1117. [DOI] [Google Scholar]
- Kuila U.; Prasad M. Specific Surface Area and Pore-Size Distribution in Clays and Shales. Geophys. Prospect. 2013, 61, 341–362. 10.1111/1365-2478.12028. [DOI] [Google Scholar]
- Baylan N.; Bhat S.; Ditto M.; Lawrence J. G.; Lecka-Czernik B.; Yildirim-Ayan E. Polycaprolactone Nanofiber Interspersed Collagen Type-I Scaffold for Bone Regeneration: A Unique Injectable Osteogenic Scaffold. Biomed. Mater. 2013, 8, 045011. 10.1088/1748-6041/8/4/045011. [DOI] [PubMed] [Google Scholar]
- Liverani L.; Boccaccini A. Versatile Production of Poly(Epsilon-Caprolactone) Fibers by Electrospinning Using Benign Solvents. Nanomaterials 2016, 6, 75. 10.3390/nano6040075. [DOI] [PMC free article] [PubMed] [Google Scholar]
- Van der Schueren L.; De Schoenmaker B.; Kalaoglu Ö. I.; De Clerck K. An Alternative Solvent System for the Steady State Electrospinning of Polycaprolactone. Eur. Polym. J. 2011, 47, 1256–1263. 10.1016/j.eurpolymj.2011.02.025. [DOI] [Google Scholar]
- Ghanaati S.; Orth C.; Unger R. E.; Barbeck M.; Webber M. J.; Motta A.; Migliaresi C.; Kirkpatrick C. J. Fine-Tuning Scaffolds for Tissue Regeneration: Effects of Formic Acid Processing on Tissue Reaction to Silk Fibroin. J. Tissue Eng. Regener. Med. 2010, 4, 464–472. 10.1002/term.257. [DOI] [PubMed] [Google Scholar]
- Enis I. Y.; Vojtech J.; Sadikoglu T. G. Alternative Solvent Systems for Polycaprolactone Nanowebs via Electrospinning. J. Ind. Text. 2017, 47, 57–70. 10.1177/1528083716634032. [DOI] [Google Scholar]
- Sadeghi A.; Moztarzadeh F.; Aghazadeh Mohandesi J.; Grothe C.; Talini K. H.; Zalli A. R.; Jalili Khoshnoud R. In Vitro Assessment of Synthetic Nano Engineered Graft Designed for Further Clinical Study in Nerve Regeneration. Int. Clin. Neurosci. J. 2018, 5, 86–91. 10.15171/icnj.2018.17. [DOI] [Google Scholar]
- Mim L. M.; Sultana N. Comparison on in Vitro Degradation of Polycaprolactone and Polycaprolactone/Gelatin Nanofibrous Scaffold. Malaysian J. Anal. Sci. 2017, 21, 627–632. 10.17576/mjas-2017-2103-12. [DOI] [Google Scholar]
- Lim M. M.; Sun T.; Sultana N. In VitroBiological Evaluation of Electrospun Polycaprolactone/Gelatine Nanofibrous Scaffold for Tissue Engineering. J. Nanomater. 2015, 2015, 303426. 10.1155/2015/303426. [DOI] [Google Scholar]
- Al-Rawahi A. S.; Rahman M. S.; Guizani N.; Essa M. M. Chemical Composition, Water Sorption Isotherm, and Phenolic Contents in Fresh and Dried Pomegranate Peels. Drying Technol. 2013, 31, 257–263. 10.1080/07373937.2012.710695. [DOI] [Google Scholar]
- Ambigaipalan P.; De Camargo A. C.; Shahidi F. Phenolic Compounds of Pomegranate Byproducts (Outer Skin, Mesocarp, Divider Membrane) and Their Antioxidant Activities. J. Agric. Food Chem. 2016, 64, 6584–6604. 10.1021/acs.jafc.6b02950. [DOI] [PubMed] [Google Scholar]
- Elfalleh W.; Hannachi H.; Tlili N.; Yahia Y.; Nasri N.; Ferchichi A. Total Phenolic Contents and Antioxidant Activities of Pomegranate Peel, Seed, Leaf and Flower. J. Med. Plants Res. 2012, 6, 4724–4730. 10.5897/JMPR11.995. [DOI] [Google Scholar]
- Negi P. S.; Jayaprakasha G. K. Antioxidant and Antibacterial Activities of Punica Granatum Peel Extracts. Food Microbiol. Saf. 2003, 68, 1473–1477. 10.1111/j.1365-2621.2003.tb09669.x. [DOI] [Google Scholar]
- Kalaycıoğlu Z.; Erim F. B. Total Phenolic Contents, Antioxidant Activities, and Bioactive Ingredients of Juices from Pomegranate Cultivars Worldwide. Food Chem. 2017, 221, 496–507. 10.1016/j.foodchem.2016.10.084. [DOI] [PubMed] [Google Scholar]
- Al-Obaidi M. M. J.; Al-Bayaty F. H.; Al Batran R.; Hassandarvish P.; Rouhollahi E. Protective effect of ellagic acid on healing alveolar bone after tooth extraction in rat-A histological and immunohistochemical study. Arch. Oral Biol. 2014, 59, 987–999. 10.1016/j.archoralbio.2014.06.001. [DOI] [PubMed] [Google Scholar]
- Gönen S. Ö.; Erol Taygun M.; Aktürk A.; Küçükbayrak S. Fabrication of nanocomposite mat through incorporating bioactive glass particles into gelatin/poly(ε-caprolactone) nanofibers by using Box-Behnken design. Mater. Sci. Eng. C 2016, 67, 684–693. 10.1016/j.msec.2016.05.065. [DOI] [PubMed] [Google Scholar]
- Pillay V.; Dott C.; Choonara Y. E.; Tyagi C.; Tomar L.; Kumar P.; Du Toit L. C.; Ndesendo V. M. K. A Review of the Effect of Processing Variables on the Fabrication of Electrospun Nanofibers for Drug Delivery Applications. J. Nanomater. 2013, 2013, 789289. 10.1155/2013/789289. [DOI] [Google Scholar]
- Zhao H.; Chi H.. Electrospun Bead-on-String Fibers: Useless or Something of Value?. Novel Aspects of Nanofibers; IntechOpen, 2018. [Google Scholar]
- Nobakht M.; Yari A.; Teimourian S.; Amidi F.; Bakhtiyari M.; Heidari F.; Sajedi N.; Veijouye S.; Dodel M. The Role of Biodegradable Engineered Random Polycaprolactone Nanofiber Scaffolds Seeded with Nestin-Positive Hair Follicle Stem Cells for Tissue Engineering. Adv. Biomed. Res. 2016, 5, 22. 10.4103/2277-9175.175911. [DOI] [PMC free article] [PubMed] [Google Scholar]
- Gounani Z.; Pourianejad S.; Asadollahi M. A.; Meyer R. L.; Rosenholm J. M.; Arpanaei A. Polycaprolactone-Gelatin Nanofibers Incorporated with Dual Antibiotic-Loaded Carboxyl-Modified Silica Nanoparticles. J. Mater. Sci. 2020, 55, 17134. 10.1007/s10853-020-05253-7. [DOI] [Google Scholar]
- Lobo A. O.; Afewerki S.; de Paula M. M. M.; Ghannadian P.; Marciano F. R.; Zhang Y. S.; Webster T. J.; Khademhosseini A. Electrospun Nanofiber Blend with Improved Mechanical and Biological Performance. Int. J. Nanomed. 2018, 13, 7891–7903. 10.2147/IJN.S175619. [DOI] [PMC free article] [PubMed] [Google Scholar]
- Stulzer H. K.; Tagliari M. P.; Parize A. L.; Silva M. A. S.; Laranjeira M. C. M. Evaluation of Cross-Linked Chitosan Microparticles Containing Acyclovir Obtained by Spray-Drying. Mater. Sci. Eng. C 2009, 29, 387–392. 10.1016/j.msec.2008.07.030. [DOI] [Google Scholar]
- Almeida R. M.; Gama A.; Vueva Y. Bioactive sol-gel scaffolds with dual porosity for tissue engineering. J. Sol-Gel Sci. Technol. 2011, 57, 336–342. 10.1007/s10971-009-2134-8. [DOI] [Google Scholar]
- Velasco M. A.; Narváez-Tovar C. A.; Garzón-Alvarado D. A. Design, Materials, and Mechanobiology of Biodegradable Scaffolds for Bone Tissue Engineering. BioMed Res. Int. 2015, 2015, 729076. 10.1155/2015/729076. [DOI] [PMC free article] [PubMed] [Google Scholar]
- Croisier F.; Duwez A.-S.; Jérôme C.; Léonard A. F.; Van Der Werf K. O.; Dijkstra P. J.; Bennink M. L. Mechanical Testing of Electrospun PCL Fibers. Acta Biomater. 2012, 8, 218–224. 10.1016/j.actbio.2011.08.015. [DOI] [PubMed] [Google Scholar]
- Abbasi N.; Hamlet S.; Love R. M.; Nguyen N.-T. Porous Scaffolds for Bone Regeneration. J. Sci.: Adv. Mater. Devices 2020, 5, 1–9. 10.1016/j.jsamd.2020.01.007. [DOI] [Google Scholar]
- Schneider C. A.; Rasband W. S.; Eliceiri K. W. NIH Image to ImageJ: 25 Years of Image Analysis. Nat. Methods 2012, 9, 671–675. 10.1038/nmeth.2089. [DOI] [PMC free article] [PubMed] [Google Scholar]
- Selvaraj S.; Fathima N. N. Fenugreek Incorporated Silk Fibroin Nanofibers-A Potential Antioxidant Scaffold for Enhanced Wound Healing. ACS Appl. Mater. Interfaces 2017, 9, 5916–5926. 10.1021/acsami.6b16306. [DOI] [PubMed] [Google Scholar]
- Shetta A.; Kegere J.; Mamdouh W. Comparative Study of Encapsulated Peppermint and Green Tea Essential Oils in Chitosan Nanoparticles: Encapsulation, Thermal Stability, in-Vitro Release, Antioxidant and Antibacterial Activities. Int. J. Biol. Macromol. 2019, 126, 731–742. 10.1016/j.ijbiomac.2018.12.161. [DOI] [PubMed] [Google Scholar]
- Hmid I.; Elothmani D.; Hanine H.; Oukabli A.; Mehinagic E. Comparative Study of Phenolic Compounds and Their Antioxidant Attributes of Eighteen Pomegranate (Punica Granatum L.) Cultivars Grown in Morocco. Arabian J. Chem. 2017, 10, S2675–S2684. 10.1016/j.arabjc.2013.10.011. [DOI] [Google Scholar]
- Hosseini S. F.; Zandi M.; Rezaei M.; Farahmandghavi F. Two-Step Method for Encapsulation of Oregano Essential Oil in Chitosan Nanoparticles: Preparation, Characterization and in Vitro Release Study. Carbohydr. Polym. 2013, 95, 50. 10.1016/j.carbpol.2013.02.031. [DOI] [PubMed] [Google Scholar]
- Dash S.; Murthy P. N.; Nath L.; Chowdhury P. Kinetic Modeling on Drug Release from Controlled Drug Delivery Systems. Acta Pol. Pharm.-Drug Res. 2010, 67, 217–223. [PubMed] [Google Scholar]
- Díaz E.; Sandonis I.; Valle M. B. In Vitro Degradation of Poly ( Caprolactone )/NHA Composites. J. Nanomater. 2014, 2014, 802435. 10.1155/2014/802435. [DOI] [Google Scholar]
- Vunjak-Novakovic G.; Freshney R. I.. Culture of Cells for Tissue Engineering; John Wiley & Sons, Inc., 2006. [Google Scholar]
- Shokrzadeh M.; Modanloo M. An Overview of the Most Common Methods for Assessing Cell Viability. J. Res. Med. Dent. Sci. 2017, 5, 33. 10.5455/jrmds.2017526. [DOI] [Google Scholar]
- Fu S.; Yang L.; Fan J.; Wen Q.; Lin S.; Wang B.; Chen L.; Meng X.; Chen Y.; Wu J. In vitro mineralization of hydroxyapatite on electrospun poly(ε-caprolactone)-poly(ethylene glycol)-poly(ε-caprolactone) fibrous scaffolds for tissue engineering application. Colloids Surf., B 2013, 107, 167–173. 10.1016/j.colsurfb.2013.01.068. [DOI] [PubMed] [Google Scholar]
- Siddiqui S.; Arshad M. Osteogenic Potential of Punica Granatum through Matrix Mineralization, Cell Cycle Progression and Runx2 Gene Expression in Primary Rat Osteoblasts. Daru, J. Pharm. Sci. 2014, 22, 72. 10.1186/s40199-014-0072-7. [DOI] [PMC free article] [PubMed] [Google Scholar]
- Thompson Z.; Rahman S.; Yarmolenko S.; Sankar J.; Kumar D.; Bhattarai N. Fabrication and Characterization of Magnesium Ferrite-Based PCL/Aloe Vera Nanofibers. Materials 2017, 10, 937. 10.3390/ma10080937. [DOI] [PMC free article] [PubMed] [Google Scholar]
Associated Data
This section collects any data citations, data availability statements, or supplementary materials included in this article.