Abstract
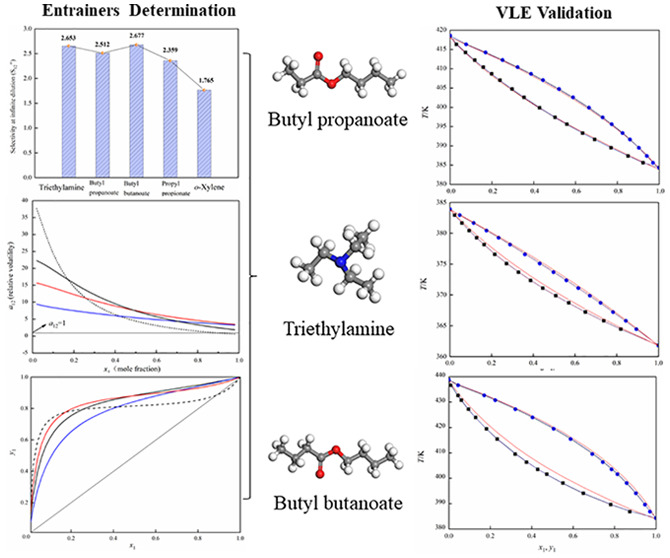
For separating the azeotropic mixture methanol and toluene, an extractive distillation is applied with butyl propanoate, triethylamine, and butyl butanoate as the extractive solvents, which were screened by relative volatility, selectivity, and the x–y curve. The vapor–liquid equilibrium data of the binary and ternary systems for (toluene + butyl propanoate), (toluene + triethylamine), (toluene + butyl butanoate), and (methanol + toluene + butyl butanoate) were determined. The reliability for the experimental vapor–liquid equilibrium (VLE) data was assessed with the van Ness method. The measured data was fitted by the UNIQUAC, Wilson, and NRTL models, and the correlated results were consistent with the determined VLE data. In addition, the COSMO-UNIFAC model was used to predict the VLE data for comparison.
1. Introduction
Methanol and toluene are extensively applied raw materials,1,2 such as in the manufacture of styrene, which is prepared by side-chain alkylation with methanol and toluene as raw materials, and p-xylene, which can also be prepared with methanol and toluene.1,3,4 From such production processes, a liquid mixture containing methanol and toluene can be produced. To maintain sustainable production, it is necessary to separate the mixture. However, methanol and toluene can form an azeotrope with the azeotropic composition (toluene/methanol = 0.113:0.887, mole fraction) at 337.02 K under 101.3 kPa.1 In general, special distillation technologies are utilized in the chemical industry for separating azeotropic mixtures, including azeotropic distillation,5 salt distillation,6 extractive distillation,7−9 and pressure-swing distillation.10 Here, extractive distillation is considered for separating the azeotropic mixture methanol and toluene.
To develop the extractive distillation to separate the mixture methanol and toluene, the vapor–liquid equilibrium (VLE) data including methanol, toluene, and the entrainers are required. In a previous work, Burke et al.11 investigated the VLE behavior of the system (toluene + methanol) under 101.3 kPa. Wang et al.12 studied the VLE behavior of the mixture (triethylamine + methanol) at 99.3 kPa. The VLE data for the systems (methanol + butyl propanoate) and (methanol + butyl butanoate) were determined by Espiau et al.13 So far, the isobaric VLE data of the binary systems (toluene + butyl propanoate), (toluene + triethylamine), and (toluene + butyl butanoate) has not been found in the literature.
In this paper, the index selectivity at infinite dilution (S12∞), the relative volatility (α12), and the x–y diagram were adopted to select entrainers for separating the azeotropic mixture methanol and toluene. The isobaric VLE data of the mixtures (toluene + butyl butanoate), (triethylamine + toluene), and (toluene + butyl propanoate) were determined under 101.3 kPa. In the meantime, the determined VLE data were correlated by UNIQUAC,14 NRTL,15 and Wilson.16 Besides, the COSMO-UNIFAC17 model was used to generate the VLE values for the systems for comparison.
2. Entrainer Determination
2.1. Selectivity
The index selectivity at infinite dilution S12∞ was applied to assess the capacity of entrainers, which is defined as follows18
| 1 |
where γ1∞ and γ2 stand for the infinite dilution activity coefficients, which were determined using the UNIFAC model.18 The infinite dilution activity coefficient is expressed as follows19
| 2 |
where
| 3 |
and
| 4 |
where θi and Φi are the area fraction and segment fraction, respectively, xi is the mole fraction of component i, ri and qi are the pure component parameters, and τij and τji are the adjustable parameters.
Figure 1 shows the calculated results of S12∞ with the entrainers. From Figure 1, it can be seen that for the system methanol (1) + toluene (2), the capacity of the different entrainers follows the order butyl butanoate > triethylamine > butyl propanoate > propyl propionate > o-xylene. The calculated selectivity values of butyl butanoate, butyl propanoate, and triethylamine are higher than those of o-xylene and propyl propionate. Therefore, the three entrainers were chosen for further analysis.
Figure 1.
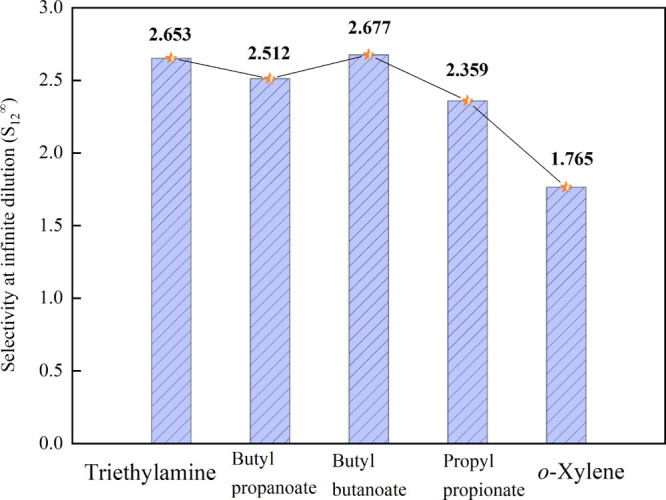
S12∞ by the UNIFAC model at T = 298.15 K.
2.2. Relative Volatility
For selection of entrainers, the relative volatility (α12) of methanol and toluene with different entrainers was calculated by the UNIFAC model, which is expressed as follows7
| 5 |
where xi stands for liquid mole fraction and yi stands for vapor mole fraction.
Figure 2 illustrates the relative volatility for the system methanol (1) + toluene (2) with the entrainers. As displayed in Figure 2, the α12 values of butyl butanoate, triethylamine, and butyl propanoate reveal apparent deviations from unity, indicating that the three entrainers have the potential to break the azeotropic point of the mixture methanol and toluene.
Figure 2.
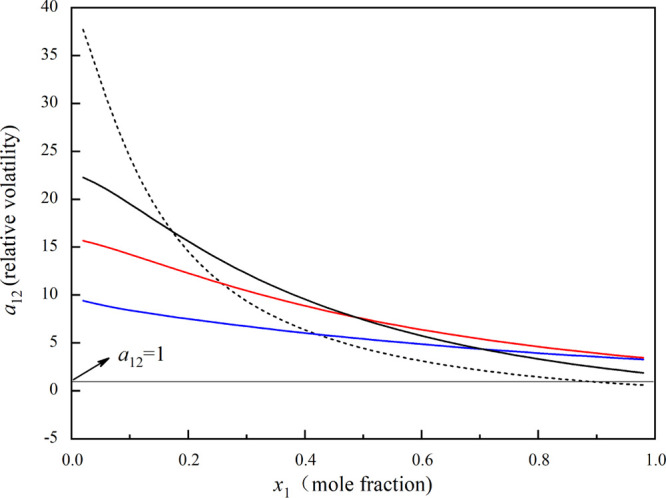
α12 vs x1 for methanol (1) + toluene (2) with the three entrainers calculated using the UNIFAC model: —, triethylamine; red —, butyl butanoate; blue —, butyl propanoate; and ---, without entrainer.
2.3. Effect of Entrainers on VLE
Figure 3 shows the x–y diagram calculated by the UNIFAC model for the mixture methanol and toluene with the selected entrainers. As can be seen from Figure 3, the x–y curves for the mixture are deviated from the diagonal line, indicating that the azeotropic point of the mixture can be broken by the entrainers.
Figure 3.
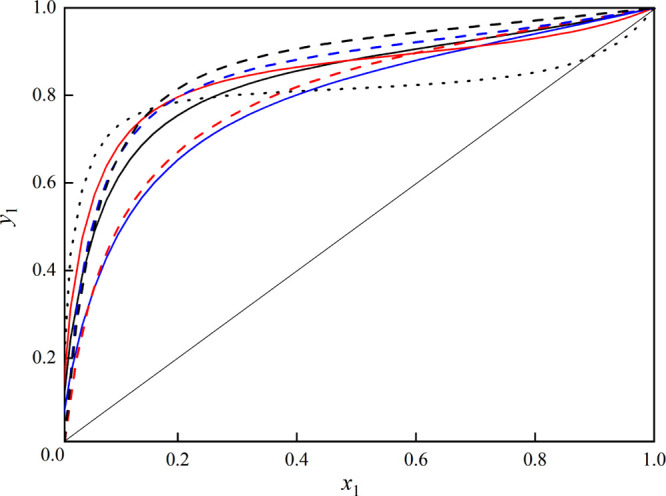
Effect of the different entrainers on VLE for methanol (1) + toluene (2) calculated with the UNIFAC model, red —, triethylamine; —, butyl butanoate; and blue —, butyl propanoate, and using the NRTL activity coefficient model with the regressed parameters: red ---, triethylamine; ---, butyl butanoate; blue ---, butyl propanoate; and ···, without the entrainer.
Consequently, depending on the analysis of S12∞, α12, and the x–y curve, butyl butanoate, triethylamine, and butyl propanoate can be the potential alternatives to separate the azeotropic mixture methanol and toluene using extractive distillation.
3. Results and Discussion
3.1. VLE Data
The measured VLE data of the systems (toluene + butyl propanoate), (triethylamine + toluene), and (toluene + butyl butanoate) under 101.3 kPa is summarized in Tables 1–3 and illustrated in Figures 4–6, where x1 stands for liquid mole fraction and y1 stands for vapor mole fraction. Besides, the x–y curves for the three mixtures are displayed in Figure 7. As shown in Figure 7, all the x–y curves deviate from the diagonal line, indicating that the solvents can be recovered by a common distillation technology.
Table 1. Isobaric VLE Data of the Mixture Toluene (1) + Butyl Propanoate (2) under 101.3 kPaa.
| T/K | x1 | y1 | γ1 | γ2 |
|---|---|---|---|---|
| 383.55 | 1.0000 | 1.0000 | ||
| 385.58 | 0.9228 | 0.9708 | 1.0012 | 1.0424 |
| 387.34 | 0.8516 | 0.9413 | 1.0013 | 1.0262 |
| 389.47 | 0.7701 | 0.9029 | 1.0015 | 1.0198 |
| 391.64 | 0.6916 | 0.8606 | 1.0017 | 1.0151 |
| 393.31 | 0.6338 | 0.8253 | 1.0020 | 1.0140 |
| 395.60 | 0.5585 | 0.7732 | 1.0021 | 1.0134 |
| 397.38 | 0.5021 | 0.7299 | 1.0038 | 1.0105 |
| 399.88 | 0.4280 | 0.6647 | 1.0048 | 1.0086 |
| 402.56 | 0.3534 | 0.5882 | 1.0052 | 1.0078 |
| 404.72 | 0.2964 | 0.5215 | 1.0061 | 1.0070 |
| 407.04 | 0.2382 | 0.4447 | 1.0075 | 1.0061 |
| 408.68 | 0.1990 | 0.3872 | 1.0082 | 1.0051 |
| 410.42 | 0.1589 | 0.3229 | 1.0091 | 1.0044 |
| 412.26 | 0.1179 | 0.2509 | 1.0106 | 1.0037 |
| 414.22 | 0.0737 | 0.1698 | 1.0438 | 1.0007 |
| 416.31 | 0.0299 | 0.0770 | 1.1103 | 1.0005 |
| 418.37 | 0.0000 | 0.0000 |
The standard uncertainties of u are u(P) = 0.35 kPa, u(T) = 0.35 K, u(x) = 0.0069, and u(y) = 0.0082.
Table 3. Isobaric VLE Data of the Mixture Toluene (1) + Butyl Butanoate (2) under 101.3 kPaa.
| T/K | x1 | y1 | γ1 | γ2 |
|---|---|---|---|---|
| 438.29 | 0.0000 | 0.0000 | ||
| 436.65 | 0.0091 | 0.0446 | 1.3413 | 1.0014 |
| 432.64 | 0.0439 | 0.1706 | 1.1589 | 1.0021 |
| 430.75 | 0.0601 | 0.2238 | 1.1566 | 1.0039 |
| 427.21 | 0.0948 | 0.3208 | 1.1362 | 1.0050 |
| 423.94 | 0.1295 | 0.4037 | 1.1262 | 1.0053 |
| 419.47 | 0.1814 | 0.5056 | 1.1152 | 1.0071 |
| 415.44 | 0.2332 | 0.5878 | 1.1083 | 1.0087 |
| 409.54 | 0.3199 | 0.6920 | 1.0964 | 1.0152 |
| 406.37 | 0.3747 | 0.7432 | 1.0871 | 1.0156 |
| 403.50 | 0.4289 | 0.7857 | 1.0789 | 1.0159 |
| 401.59 | 0.4725 | 0.8138 | 1.0636 | 1.0183 |
| 398.11 | 0.5505 | 0.8582 | 1.0535 | 1.0180 |
| 394.08 | 0.6488 | 0.9029 | 1.0463 | 1.0206 |
| 389.61 | 0.7814 | 0.9466 | 1.0281 | 1.0501 |
| 386.85 | 0.8736 | 0.9705 | 1.0164 | 1.1140 |
| 383.55 | 1.0000 | 1.0000 |
The standard uncertainties of u are u(P) = 0.35 kPa, u(T) = 0.35 K, and u(x) = u(y) = 0.0062.
Figure 4.
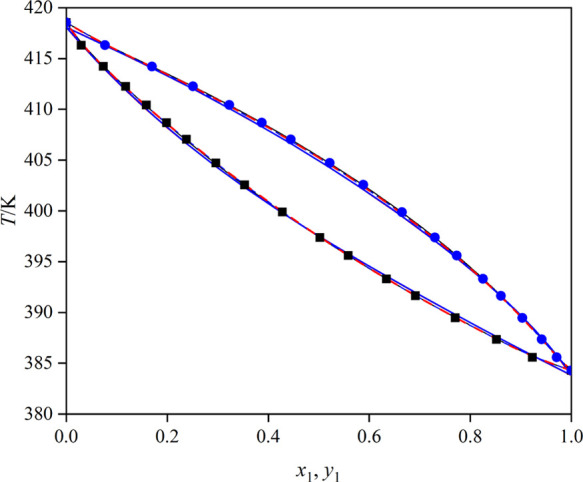
T–x–y curves for the mixture toluene (1) + butyl propanoate (2): blue ●, T–y (experimental); ■, T–x (experimental); red ---, UNIQUAC model; —, NRTL model; blue ---, Wilson model; red —, COSMO-UNIFAC model; and blue —, UNIFAC model.
Figure 6.
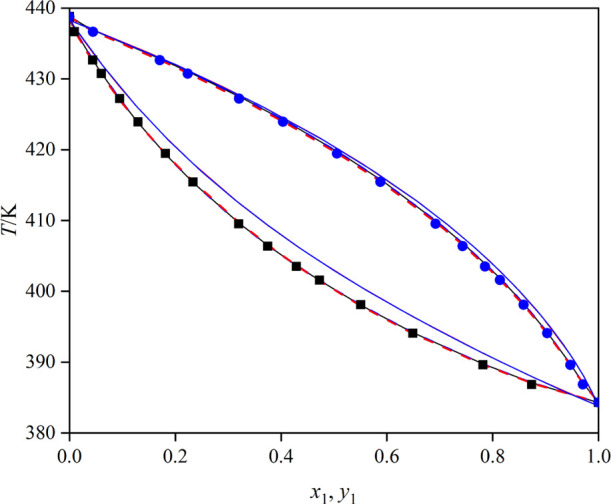
T–x–y curves for the mixture toluene (1) + butyl butanoate (2): blue ●, T–y (experimental); ■, T–x (experimental); red ---, UNIQUAC model; —, NRTL model; blue ---, Wilson model; red —, COSMO-UNIFAC model; and blue —, UNIFAC model.
Figure 7.
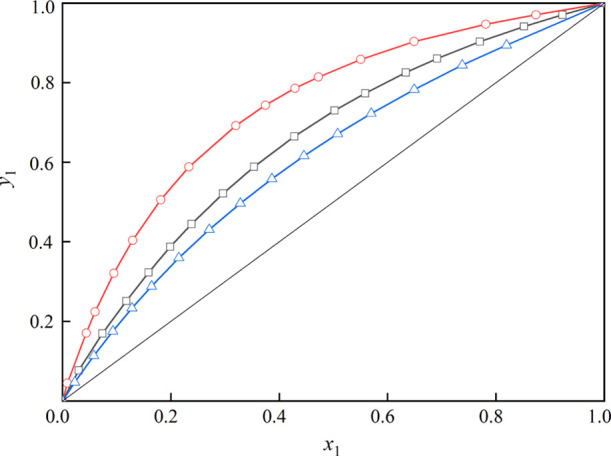
x–y curves of the mixtures: red -○-, toluene (1) + butyl butanoate (2); blue -△-, toluene (1) + triethylamine (2); and -□-, toluene (1) + butyl propanoate (2).
Figure 5.
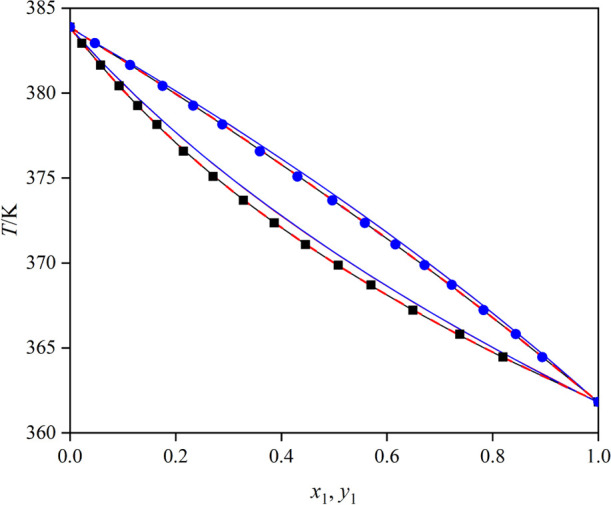
T–x–y curves for the mixture triethylamine (1) + toluene (2): blue ●, T–y (experimental); ■, T–x (experimental); red ---, UNIQUAC model; —, NRTL model; blue ---, Wilson model; red —, COSMO-UNIFAC model; and blue —, UNIFAC model.
Table 2. Isobaric VLE Data of the Mixture Triethylamine (1) + Toluene (2) under 101.3 kPaa.
| T/K | x1 | y1 | γ1 | γ2 |
|---|---|---|---|---|
| 383.55 | 0.0000 | 0.0000 | ||
| 382.93 | 0.0226 | 0.0471 | 1.1486 | 1.0002 |
| 381.64 | 0.0579 | 0.1140 | 1.1228 | 1.0012 |
| 380.42 | 0.0929 | 0.1753 | 1.1117 | 1.0027 |
| 379.26 | 0.1283 | 0.2334 | 1.1057 | 1.0033 |
| 378.15 | 0.1644 | 0.2882 | 1.0980 | 1.0041 |
| 376.57 | 0.2148 | 0.3595 | 1.0944 | 1.0074 |
| 375.09 | 0.2709 | 0.4307 | 1.0829 | 1.0080 |
| 373.69 | 0.3284 | 0.4966 | 1.0709 | 1.0094 |
| 372.35 | 0.3866 | 0.5583 | 1.0616 | 1.0098 |
| 371.09 | 0.4457 | 0.6158 | 1.0527 | 1.0105 |
| 369.87 | 0.5079 | 0.6711 | 1.0421 | 1.0116 |
| 368.71 | 0.5698 | 0.7224 | 1.0339 | 1.0127 |
| 367.23 | 0.6491 | 0.7826 | 1.0263 | 1.0186 |
| 365.81 | 0.7379 | 0.8439 | 1.0145 | 1.0240 |
| 364.46 | 0.8195 | 0.8940 | 1.0071 | 1.0544 |
| 361.96 | 1.0000 | 1.0000 |
The standard uncertainties of u are u(P) = 0.35 kPa, u(T) = 0.35 K, and u(x) = u(y) = 0.0061.
3.2. VLE Calculation
For the investigated mixtures, the liquid phase is a non-ideal solution, and the vapor phase can be assumed as an ideal gas at 101.3 kPa for VLE calculation. The VLE relation is defined as20,21
| 6 |
where γi refers to the activity coefficient, xi stands for the mole fraction in the liquid phase, yi stands for the mole fraction in the vapor phase, and Pis stands for saturation vapor pressure of the pure component and was determined using the extended Antoine equation, which is defined as22
| 7 |
where C1i to C9i are the coefficients of the equation, and the values are presented in Table 4. The results of activity coefficient (γi) of the mixtures are presented in Tables 1–3
Table 4. Coefficients of the Extended Antoine Modela.
| component | C1i | C2i | C3i | C4i | C5i | C6i | C7i | C8i/K | C9i/K |
|---|---|---|---|---|---|---|---|---|---|
| triethylamine | 49.64 | –5681.90 | 0 | 0 | –4.98 | 1.24 × 10⁻¹⁷ | 6 | 158.45 | 535.15 |
| toluene | 70.04 | –6729.80 | 0 | 0 | –8.18 | 5.30 × 10⁻⁶ | 2 | 178.18 | 591.75 |
| butyl butanoate | 102.27 | –9384.00 | 0 | 0 | –12.77 | 7.47 × 10⁻⁶ | 2 | 181.15 | 616.00 |
| butyl propanoate | 64.32 | –7709.80 | 0 | 0 | –6.84 | 6.36 × 10⁻¹⁸ | 6 | 183.63 | 594.60 |
Collected from the Aspen databank.23
3.3. Thermodynamic Consistency Test
The consistency test of van Ness24 was utilized to verify the reliability of the determined VLE data. The van Ness test is represented as
| 8 |
| 9 |
where cal and exp refer to the values of calculation and experiments and N indicates the data point number. If all the values of ΔP and Δy do not exceed unity, it signifies that the VLE data are thermodynamically consistent.
Table 5 lists the values of ΔP and Δy. As given in Table 5, all the values of ΔP, Δy do not exceed unity, indicating that the obtained VLE data for the systems is thermodynamically consistent.
Table 5. Validated Values of the van Ness Test.
| system | ΔP | Δy |
|---|---|---|
| toluene + butyl propanoate | 0.03 | 0.19 |
| triethylamine + toluene | 0.02 | 0.08 |
| toluene + butyl butanoate | 0.06 | 0.18 |
3.4. VLE Data Correlation
The activity coefficient models of NRTL, UNIQUAC, and Wilson were adopted to correlate the isobaric VLE data for (toluene + butyl propanoate), (triethylamine + toluene), and (toluene + butyl butanoate) using Aspen Plus. The correlated results of the three systems using the activity coefficient models are shown in Figures 4–7. The parameters r and q of the components for the UNIQUAC model are provided in Table 6. To fit the measured VLE data, the following expression is adopted26
 |
10 |
where σ, T, and P denote the standard deviation, temperature, and pressure. The values of standard deviation23 are σP, 0.35 kPa; σT, 0.35 K; σx, 0.008; and σy, 0.006, respectively.
Table 6. Parameters r and q of the Components for the UNIQUAC Modela.
| component | r | q |
|---|---|---|
| toluene | 3.9229 | 2.9680 |
| butyl propanoate | 5.5017 | 4.7360 |
| triethylamine | 5.0119 | 4.2560 |
| butyl butanoate | 6.1892 | 5.2760 |
Taken from the Aspen property databank.25
The RMSDs (root-mean-square deviations) and the correlated interaction parameter values are presented in Table 7. As displayed in Table 7, the largest values of RMSDs(T) and RMSDs(y1) are 0.23 K and 0.0054, indicating that the three models can fit the determined VLE data well. Furthermore, the experimental vapor pressures of the system (toluene + triethylamine) at T = 298.14–333.13 K were predicted using the regressed parameters of the Wilson model and compared with the data reported in ref (27). The results are provided in Figure S1 in the Supporting Information. From Figure S1, it can be seen that the predicted results agree with the experimental data in the literature, indicating the reliability of the regressed model parameters. The UNIFAC and COSMO-UNIFAC28,29 models were used to generate the isobaric VLE values of the three binary mixtures for comparison. As can be seen from Figures 4–6, for the mixture toluene and butyl propanoate, the prediction results from the UNIFAC and COSMO-UNIFAC model agree with the VLE data of the mixtures. For the mixtures (toluene + butyl butanoate) and (toluene + triethylamine), the predicted values of the vapor phase are in agreement with the measured values, while the predicted values of the liquid phase show little deviations compared to the measured values.
Table 7. Binary Parameters for the Mixtures under 101.3 kPa.
| parameters |
RMSD |
|||||
|---|---|---|---|---|---|---|
| model | a12 | a21 | b12/K | b21/K | y1a | T/Kb |
| toluene + butyl propanoate | ||||||
| NRTLc | 0.1941 | 0.1581 | –32.14 | –112.16 | 0.0026 | 0.16 |
| UNIQUACd | 22.45 | –6.2300 | –2285.03 | 2185.63 | 0.0023 | 0.15 |
| Wilsone | 7.9342 | 5.3700 | 2880.91 | –1892.58 | 0.0025 | 0.15 |
| triethylamine + toluene | ||||||
| NRTL | –15.77 | 11.76 | 6211.83 | –4602.33 | 0.0024 | 0.18 |
| UNIQUAC | –3.0611 | –4.4827 | –2421.73 | 1850.92 | 0.0025 | 0.12 |
| Wilson | 9.8052 | 12.65 | 2453.72 | –4973.45 | 0.0016 | 0.17 |
| toluene + butyl butanoate | ||||||
| NRTL | 5.9800 | 2.3171 | –2160.88 | –926.69 | 0.0028 | 0.23 |
| UNIQUAC | 19.41 | –0.5803 | –1538.96 | 407.64 | 0.0054 | 0.19 |
| Wilson | 17.06 | 2.3345 | –97.81 | –1438.50 | 0.0053 | 0.20 |


NRTL, τij = aij + bij/T, the αij value was fixed at 0.3.
UNIQUAC, τij = exp(aij + bij/T).
Wilson, ln Aij = aij + bij/T.
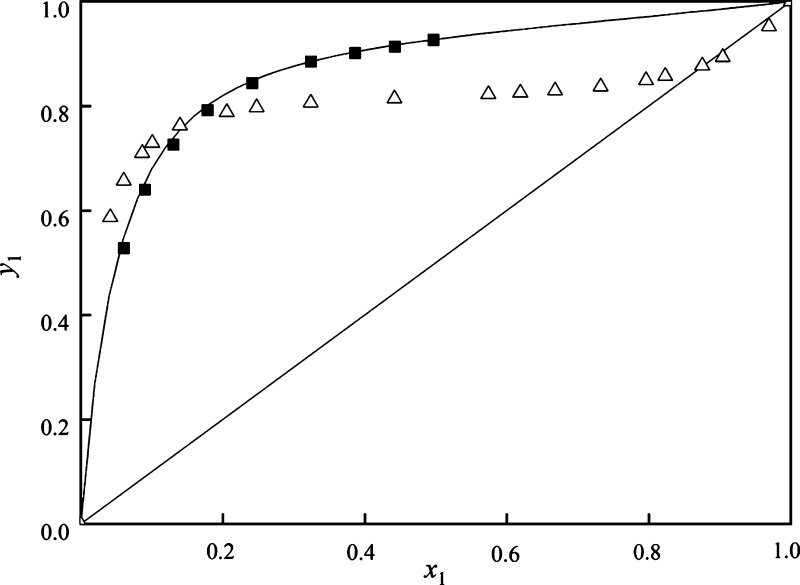
To validate the UNIFAC prediction of the effect of these entertainers on VLE of methanol and toluene, the NRTL activity coefficient model with the regressed parameter was used to generate the VLE data of the mixture methanol and toluene with the three entrainers, which is added in Figure 3. Also, the experimental ternary VLE data of the system (methanol + toluene + butyl butanoate) with the best entrainer (butyl butanoate) was determined at 101.3 kPa with the feed ratio (mole fraction) of methanol/toluene/butyl butanoate = 0.25:0.25:0.5 and calculated by the NRTL and UNIFAC models, which are provided in Tables S1 and S2 in the Supporting Information. The pseudo-binary x–y diagram of methanol + toluene with butyl butanoate is plotted with the feed ratio (mole fraction) of methanol/toluene/butyl butanoate = 0.25:0.25:0.5 in Figure 8. The values of relative volatility were calculated and are presented in Table S1 in the Supporting Information.
Figure 8.
x–y curves for the mixture methanol (1) + toluene (2): ■, experimental data with butyl butanoate; —, by the NRTL model with the regressed parameters; and △, from ref (30).
As displayed in Figure 8, with the help of the entrainer butyl butanoate, the x–y curve shows a large deviation from the diagonal line with the feed ratio (mole fraction) of methanol/toluene/butyl butanoate = 0.25:0.25:0.5, which indicates that the entrainer butyl butanoate can enlarge the relative volatility of the system methanol and toluene compared to the VLE data for the system at 101.3 kPa reported in ref (30). Also, from Table S1, the values of relative volatility are greater than unity, suggesting that butyl butanoate can effectively break the azeotropic point of the mixture methanol and toluene.
4. Conclusions
For separating the azeotropic mixture methanol and toluene through extractive distillation, the extractive solvents butyl butanoate, triethylamine, and butyl propanoate were chosen according to selectivity, relative volatility, and the x–y curve. With the selected extractive solvents, the isobaric VLE data for the mixtures (toluene + butyl propanoate), (triethylamine + toluene) (butyl butanoate + toluene), and (methanol + toluene + butyl butanoate) were determined under 101.3 kPa. The validated results by the van Ness test show that the VLE data measured in this work are of thermodynamic consistency. Besides, the UNIQUAC, NRTL, and Wilson equations were applied in fitting the isobaric VLE data. The largest values of RMSD(T) and RMSD(y1) are 0.23 K and 0.0054, respectively. Furthermore, the predictive model COSMO-UNIFAC was used to generate the isobaric VLE data of the three mixtures, and the predicted results show less deviation from the measured values. Compared to butyl propanoate and triethylamine, butyl butanoate displays the best effect on the separation of methanol and toluene. In addition, the ternary VLE data for (methanol + toluene + butyl butanoate) was determined under 101.3 kPa with the feed ratio (mole fraction) of methanol/toluene/butyl butanoate = 0.25:0.25:0.5. The values of relative volatility are larger than unity, showing that butyl butanoate can effectively eliminate the azeotropic point of the system. The determined VLE data and the optimized model parameters are helpful for designing the separation process.
5. Experimental Section
5.1. Materials
The materials butyl butanoate, toluene, triethylamine, and butyl propanoate were commercially obtained. The purity of the chemicals was verified using GC and utilized directly. Table 8 lists the specific descriptions of the materials.
Table 8. Specifications of the Chemicals.
| T/K | ||||||
|---|---|---|---|---|---|---|
| component | CAS | suppliers | mass fraction | expa | lit | analysis methodb |
| toluene | 108-88-3 | Tianjin Yuanli Chemical Co., Ltd. | 0.998 | 383.55 | 383.6036 | GC |
| 382.9537 | ||||||
| methanol | 67-56-1 | Aladdin reagent Shanghai Co., Ltd. | 0.998 | 337.67 | 337.7511 | GC |
| 337.4213 | ||||||
| butyl propanoate | 590-01-2 | Aladdin reagent Shanghai Co., Ltd. | 0.990 | 418.37 | 418.2638 | GC |
| 418.6939 | ||||||
| butyl butanoate | 109-21-7 | Shanghai Macklin Biochemical Co., Ltd. | 0.990 | 438.29 | 438.3238 | GC |
| 438.1539 | ||||||
| triethylamine | 121-44-8 | Aladdin reagent Shanghai Co., Ltd. | 0.998 | 361.96 | 361.9240 | GC |
| 361.9741 |
The standard uncertainties of u are u(P) = 0.35 kPa and u(T) = 0.35 K, and the boiling temperature for the chemicals was determined to be under 101.3 kPa.
Gas chromatograph.
5.2. Apparatus and Procedures
Measurements of the binary VLE data of the mixtures (toluene + butyl propanoate), (toluene + triethylamine), and (toluene + butyl butanoate) were conducted in a Rose-Williams still under 101.3 kPa. When the temperature of the prepared system in the still was maintained stable over 50 min,31,32 the mixture reached the equilibrium state. Afterward, the samples from the vapor and liquid phases were gathered for analysis by GC. The more specific experimental procedures can be referred to the literature.33−35
5.3. Sample Analysis
To determine the sample composition, GC (SP-6890) was used, and the information of the column type, carrier gas, and the temperatures of the injector, detector, and column is given in Table 9.
Table 9. Analysis Conditions of GC.
| name | characteristic | description |
|---|---|---|
| column | type | packing column |
| specification | Porapak Q (3 mm × 2 m) | |
| carrier gas | type | hydrogen (22 mL/min) |
| pressure | 0.18 MPa | |
| injection port | temperature | 463.15 K |
| volume | 0.3 μL | |
| column | temperature | 403.15 K |
| detector | type | thermal conductivity detector (TCD) |
| temperature | 473.15 K |
Acknowledgments
The authors are grateful to the support of the National Natural Science Foundation of China (no. 21978155).
Supporting Information Available
The Supporting Information is available free of charge at https://pubs.acs.org/doi/10.1021/acsomega.1c05164.
Comparison of the isothermal VLE data for the mixture (toluene + triethylamine), experimental isobaric VLE data, and predicted values by the NRTL and UNIFAC models for the mixture (methanol + toluene + butyl butanoate) (PDF)
The authors declare no competing financial interest.
Supplementary Material
References
- Ma J.; Li W.; Ni C.; Li Y.; Huang S.; Shen C.; Xu C. Investigation of distillation systems using heavy or intermediate entrainers for separating toluene-methanol: process economics and control. J. Chem. Technol. Biotechnol. 2016, 91, 2111–2124. 10.1002/jctb.4809. [DOI] [Google Scholar]
- Wang C.; Zhuang Y.; Liu L.; Zhang L.; Du J.; Zhang Z. Design and control of a novel side-stream extractive distillation column for separating methanol-toluene binary azeotrope with intermediate boiling entrainer. Sep. Purif. Technol. 2020, 239, 116581. 10.1016/j.seppur.2020.116581. [DOI] [Google Scholar]
- Wang C.; Zhuang Y.; Liu L.; Zhang L.; Du J. Control of energy-efficient extractive distillation configurations for separating the methanol/toluene azeotrope with intermediate-boiling entrainer. Chem. Eng. Process. 2020, 149, 107862. 10.1016/j.cep.2020.107862. [DOI] [Google Scholar]
- Hao C.; Wen Y.; Wang B.; Faraz A.; Huang W. Synthesis of HTLcs modified by K3PO4 for side chain alkylation of toluene with methanol. Green Energy Environ. 2021, 6, 961–967. 10.1016/j.gee.2020.06.007. [DOI] [Google Scholar]
- Shi P.; Gao Y.; Wu J.; Xu D.; Gao J.; Ma X.; Wang Y. Separation of azeotrope (2,2,3,3-tetrafluoro-1-propanol + water): Isobaric vapour-liquid phase equilibrium measurements and azeotropic distillation. J. Chem. Thermodyn. 2017, 115, 19–26. 10.1016/j.jct.2017.07.019. [DOI] [Google Scholar]
- Xu L.; Xu D.; Shi P.; Zhang K.; Ma X.; Gao J.; Wang Y. Salts effect on isobaric vapor-liquid equilibrium for separation of the azeotropic mixture allyl alcohol + water. Sep. Purif. Technol. 2018, 457, 11–17. 10.1016/j.fluid.2017.10.025. [DOI] [Google Scholar]
- Dong Y.; Dai C.; Lei Z. Extractive distillation of methylal/methanol mixture using the mixture of dimethylformamide (DMF) and ionic liquid as entrainers. Fuel 2018, 216, 503–512. 10.1016/j.fuel.2017.12.043. [DOI] [Google Scholar]
- Sapei E.; Petri U.; Kari I K.; Juha-Pekka P.; Ville A. Vapor–liquid equilibrium for the binary systems tetrahydrothiophene + toluene and tetrahydrothiophene + o-xylene at 368.15 K and 383.15 K. Fluid Phase Equilib. 2010, 296, 4–8. 10.1016/j.fluid.2009.11.017. [DOI] [Google Scholar]
- Shen W.; Dong L.; Wei S. a.; Li J.; Benyounes H.; You X.; Gerbaud V. Systematic design of an extractive distillation for maximum-boiling azeotropes with heavy entrainers. AIChE J. 2015, 61, 3898–3910. 10.1002/aic.14908. [DOI] [Google Scholar]
- Yang S.; Zhang Q.; Ma Y.; Yuan X.; Zeng A. Novel eco-efficient vapor recompression-assisted arrangement for minimum-boiling side-stream pressure-swing distillation system: Preheating feed stream to dew or bubble point. Sep. Purif. Technol. 2021, 257, 117920. 10.1016/j.seppur.2020.117920. [DOI] [Google Scholar]
- Burke D. E.; Williams G. C.; Plank C. A. Vapor-Liquid Equilibria for the Methanol-Toluene System. J. Chem. Eng. Data 1964, 9, 212–214. 10.1021/je60021a018. [DOI] [Google Scholar]
- Yi-Xuan W.; Zhao J.; Dai M. Vapor-liquid equilibrium for some polar aprotic solvents with methanol or 1,2-dichloroethane. Acta Phys.-Chim. Sin. 1992, 8, 636–641. 10.3866/pku.whxb19920512. [DOI] [Google Scholar]
- Espiau F.; Ortega J.; Penco E.; Wisniak J. Advances in the correlation of thermodynamic properties of binary systems applied to methanol mixtures with butyl esters. Ind. Eng. Chem. Res. 2010, 49, 9548–9558. 10.1021/ie101165r. [DOI] [Google Scholar]
- Abrams D. S.; Prausnitz J. M. Statistical thermodynamics of liquid mixtures: A new expression for the excess Gibbs energy of partly or completely miscible systems. AIChE J. 1975, 21, 116–128. 10.1002/aic.690210115. [DOI] [Google Scholar]
- Renon H.; Prausnitz J. M. Local compositions in thermodynamic excess functions for liquid mixtures. AIChE J. 1968, 14, 135–144. 10.1002/aic.690140124. [DOI] [Google Scholar]
- Wilson G. M. Vapor-Liquid Equilibrium. XI. A New Expression for the Excess Free Energy of Mixing. J. Am. Chem. Soc. 1964, 86, 127–130. 10.1021/ja01056a002. [DOI] [Google Scholar]
- Zhu R.; Taheri M.; Zhang J.; Lei Z. Extension of the COSMO-UNIFAC Thermodynamic Model. Ind. Eng. Chem. Res. 2020, 59, 1693–1701. 10.1021/acs.iecr.9b05963. [DOI] [Google Scholar]
- Wang C.; Wang C.; Guang C.; Zhang Z. Comparison of extractive distillation separation sequences for acetonitrile/methanol/benzene multi-azeotropic mixtures. J. Chem. Technol. Biotechnol. 2018, 93, 3302–3316. 10.1002/jctb.5693. [DOI] [Google Scholar]
- Fredenslund A.; Russell L.; John M. Group-contribution estimation of activity coefficients in nonideal liquid mixtures. AIChE J. 1975, 21, 1086–1099. 10.1002/aic.690210607. [DOI] [Google Scholar]
- Smith J.; Van Ness H.; Abbott M.. Introduction to Chemical Engineering Thermodynamics, 6th ed.; McGraw-Hill: New York, 2001. [Google Scholar]
- Wang S.; Dai Y.; Qi H.; Hou Y.; Zhang W.; Zhu Z.; Wang Y.; Gao J. Flash/distillation for separating 2-pentanone/4-heptanone/water azeotropic mixture based equilibrium data and process design. Sep. Purif. Technol. 2020, 242, 116790. 10.1016/j.seppur.2020.116790. [DOI] [Google Scholar]
- Gao J.; Li H.; Xu D.; Zhang L.; Zhao L.; Li C. Isobaric Vapor-Liquid Equilibrium for Binary Systems of Thioglycolic Acid with Water, Butyl Acetate, Butyl Formate, and Isobutyl Acetate at 101.3 kPa. J. Chem. Eng. Data 2017, 62, 355–361. 10.1021/acs.jced.6b00686. [DOI] [Google Scholar]
- Aspen Plus Software, version 7.3; Aspen Technology, Inc.: Burlington, MA, 2001. [Google Scholar]
- van Ness H. C.; Byer S. M.; Gibbs R. E. Vapor-Liquid equilibrium: Part I. An appraisal of data reduction methods. AIChE J. 1973, 19, 238–244. 10.1002/aic.690190206. [DOI] [Google Scholar]
- Zhang Y.; Liu K.; Wang Z.; Gao J.; Zhang L.; Xu D.; Wang Y. Vapour-liquid equilibrium and extractive distillation for separation of azeotrope isopropyl alcohol and diisopropyl ether. J. Chem. Thermodyn. 2019, 131, 294–302. 10.1016/j.jct.2018.11.013. [DOI] [Google Scholar]
- Li J.; Hua C.; Xiong S.; Bai F.; Lu P.; Ye J. Vapor-liquid equilibrium for binary systems of allyl alcohol + water and allyl alcohol + benzene at 101.3 kPa. J. Chem. Eng. Data 2017, 62, 3004–3008. 10.1021/acs.jced.6b00893. [DOI] [Google Scholar]
- Kokkonen P.; Hannu A. Thermodynamic properties of binary and ternary systems. Vapour-liquid equilibrium data in the trethylamine + toluene system. Thermochim. Acta 1984, 77, 333–339. 10.1016/0040-6031(84)87072-0. [DOI] [Google Scholar]
- Dong Y.; Zhu R.; Guo Y.; Lei Z. A united chemical thermodynamic model: COSMO-UNIFAC. Ind. Eng. Chem. Res. 2018, 57, 15954–15958. 10.1021/acs.iecr.8b04870. [DOI] [Google Scholar]
- Dong Y.; Huang S.; Guo Y.; Lei Z. COSMO-UNIFAC model for ionic liquids. AIChE J. 2020, 66, e16787 10.1002/aic.16787. [DOI] [Google Scholar]
- Li W.; Guan T.; Cao Y.; Zhang Y.; Zhang T. Isobaric vapor-liquid equilibrium for toluene-methanol system including three ionic liquids with acetate anion at 101.3 kPa. Fluid Phase Equilib. 2020, 506, 112412. 10.1016/j.fluid.2019.112412. [DOI] [Google Scholar]
- Yang J.; Pan X.; Yu M.; Cui P.; Ma Y.; Wang Y.; Gao J. Vapor-liquid equilibrium for binary and ternary systems of tetrahydrofuran, ethyl acetate and N-methyl pyrrolidone at pressure 101.3 kPa. J. Mol. Liq. 2018, 268, 19–25. 10.1016/j.molliq.2018.07.038. [DOI] [Google Scholar]
- Pla-Franco J.; Lladosa E.; Loras S.; Montón J. B. Azeotropic distillation for 1-propanol dehydration with diisopropyl ether as entrainer: equilibrium data and process simulation. Sep. Purif. Technol. 2019, 212, 692–698. 10.1016/j.seppur.2018.11.082. [DOI] [Google Scholar]
- Zhang Y.; Diao B.; Xu D.; Jiang H.; Zhang L.; Gao J.; Wang Y. Separation of the mixture (isopropyl alcohol + diisopropyl ether + n-propanol): Entrainer selection, interaction exploration and vapour-liquid equilibrium measurements. J. Chem. Thermodyn. 2019, 135, 27–34. 10.1016/j.jct.2019.03.018. [DOI] [Google Scholar]
- Zhu Z.; Ma Y.; Gao J. Isobaric Vapor–Liquid Equilibria for Binary Systems of Acetic Acid + Benzene, Chloroacetic Acid + Benzene, and Dichloroacetic Acid + Benzene at 101.33 kPa. J. Chem. Eng. Data 2010, 55, 3387–3390. 10.1021/je100144t. [DOI] [Google Scholar]
- Gao J.; Zhao L.; Zhang L.; Xu D.; Zhang Z. Isobaric Vapor-Liquid Equilibrium for Binary Systems of 2,2,3,3-Tetrafluoro-1-propanol + 2,2,3,3,4,4,5,5-Octafluoro-1-pentanol at 53.3, 66.7, 80.0 kPa. J. Chem. Eng. Data 2016, 61, 3371–3376. 10.1021/acs.jced.6b00429. [DOI] [Google Scholar]
- Parsana V. M.; Parekh U.; Dabke S. P.; Ziniya K.; Joshi K.; Vlugt T. J. H.; Ramdin M. Isobaric vapor-liquid equilibrium data of binary systems containing 2-ethoxyethanol, 2-ethoxyethyl acetate, and toluene. J. Chem. Eng. Data 2020, 65, 4798–4804. 10.1021/acs.jced.0c00291. [DOI] [Google Scholar]
- Luyben W. L. Comparison of extractive distillation and pressure-swing distillation for acetone/chloroform separation. Comput. Chem. Eng. 2013, 50, 1–7. 10.1016/j.compchemeng.2012.10.014. [DOI] [Google Scholar]
- Ortega J.; Hernández P. Thermodynamic Study of Binary Mixtures Containing an Isobutylalkanol and an Alkyl (Ethyl to Butyl) Alkanoate (Methanoate to Butanoate), Contributing with Experimental Values of Excess Molar Enthalpies and Volumes, and Isobaric Vapor–Liquid Equilibria. J. Chem. Eng. Data 1999, 44, 757–771. 10.1021/je990004n. [DOI] [Google Scholar]
- González E.; Ortega J. Densities and isobaric vapor-liquid equilibria of butyl esters (methanoateto butanoate) with ethanol at 101.32 kPa. J. Chem. Eng. Data 1995, 40, 1178–1183. 10.1021/je00022a004. [DOI] [Google Scholar]
- Yin X.; Du C.; Du Z.; Jiang W.; Ding Y.; Du H.; Yan Z.; Zhang L. Measurement, modelling and molecular dynamics analysis for isobaric vapour-liquid equilibria of binary or ternary system (diethylamine, ethyl acetate, triethylamine). J. Chem. Thermodyn. 2020, 151, 106251. 10.1016/j.jct.2020.106251. [DOI] [Google Scholar]
- Teske V.; Vogel E. The viscosity of the binary vapor mixture methanol-triethylamine at low densities and in the saturated vapor phase of the vapor-liquid equilibrium. Fluid Phase Equilib. 2011, 303, 126–133. 10.1016/j.fluid.2011.01.013. [DOI] [Google Scholar]
Associated Data
This section collects any data citations, data availability statements, or supplementary materials included in this article.


