Abstract
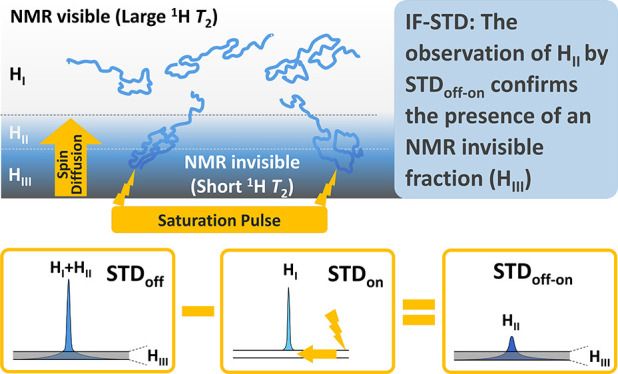
The observation of signals in solution NMR requires nuclei with sufficiently large transverse relaxation times (T2). Otherwise, broad signals embedded in the baseline afford an invisible fraction of nuclei (IF). Based on the STD (saturation transfer difference) sequence, IF-STD is presented as a quick tool to unveil IF in the 1H NMR spectra of polymers. The saturation of a polymer in a region of the NMR spectrum with IF (very short 1H T2) results in an efficient propagation of the magnetization by spin diffusion through the network of protons to a visible–invisible interphase with larger 1H T2 (STDon). Subtracting this spectrum from one recorded without saturation (STDoff) produces a difference spectrum (STDoff-on), with the nuclei at the visible–invisible interphase, that confirms the presence of an IF. Analysis of a wide collection of polymers by IF-STD reveals IF more common than previously thought, with relevant IF figures when STD > 0.4% at 750 MHz. A fundamental property of the IF-STD experiment is that the signal is generated within a single state comprising polymer domains with different dynamics, as opposed to several states in exchange with different degrees of aggregation. Contrary to a reductionist visible–invisible dichotomy, our results confirm a continuous distribution of nuclei with diverse dynamics. Since nuclei observed (edited) by IF-STD at the visible–invisible interphase are in close spatial proximity to the IF (tunable with the saturation time), they emerge as a privileged platform from which gaining an insight into the IF itself.
In nuclear magnetic resonance (NMR), series of scans are implemented to improve the signal-to-noise ratio. Each scan is followed by a delay, where the spin systems return to equilibrium by longitudinal (z-axis) and transverse (xy-plane) relaxation. The transverse component of the magnetization decays to zero according to eq 1,
| 1 |
where I0 is the intensity of the magnetization at time t = 0, and T2 is the transverse relaxation time of each nucleus.1
The observation of signals in solution NMR requires nuclei with sufficiently large T2. Otherwise, the inverse proportionality between T2 and the spectral line width results in signals so broad they remain embedded in the baseline (NMR-invisible or silent).2 This is the case for macromolecular systems like vesicles,3 polyelectrolyte complexes,4 and gels.5 Conversely, NMR-invisible fractions (IF) are seldom observed in polymers, with few reports restricted to charged polysaccharides.6−9 The widespread belief that IF are uncommon in solution NMR, along with the counterintuitive nature of detecting anything invisible, have sunk the IF of polymers into oblivion.
Our laboratory has unveiled an IF in the 1H NMR of chitosan (CS, Figure 1A)10 with IF% (percentage of signal not detected) as high as 50% in the semidilute regime, depending on structural [molecular weight (MW), degree of acetylation (DA)] and experimental (concentration, temperature, pH, magnetic field) parameters.10 Although overlapped/aggregated CS chains display short 1H T2 values (10–25 ms at 500 MHz),11,12 the existence of an IF at concentrations as low as 1 mg/mL (close to the overlap concentration) was completely unexpected.13
Figure 1.
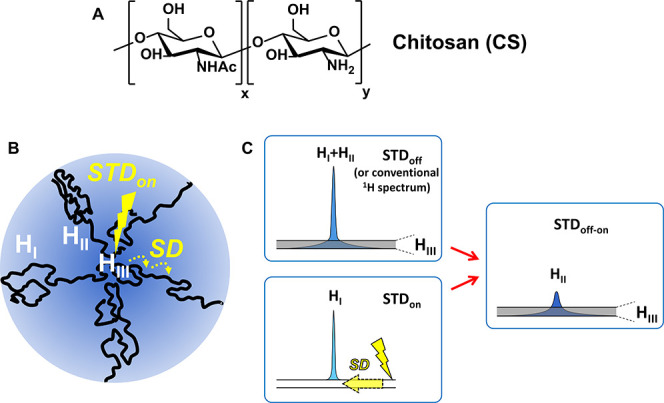
(A) Structure of chitosan. (B) Schematic representation of regions with different mobility in a polymer in solution: the line width of proton signals in the most flexible HI region (large 1H T2) is much narrower than in the more rigid HII (visible–invisible interphase) and HIII (invisible fraction, IF; very short 1H T2). (C) IF-STD experiment: although the intensity of protons in region HIII (IF) is below the limit of detection, their saturation in a STDon spectrum is transferred through spin diffusion to protons in the HII region (visible–invisible interphase observed in the STDoff-on), but does not reach region HI. Note that nuclei observed in the STDoff and conventional NMR experiments correspond to HI + HII.
Since NMR data acquired for polymers in solution in the presence of an IF unlikely describe the overall sample, the necessity of a straightforward tool for the identification of IF was evident. Saturation transfer difference (STD)14,15 lays among the most potent NMR experiments to study the interaction between small ligands and proteins16/receptors.17,18 It relies on an extremely efficient propagation of the magnetization across the entire network of protons in large complexes by spin diffusion.19 The selective irradiation of a receptor with a saturation radiofrequency on a region of the spectrum free of ligand protons, but with broad signals of the receptor embedded in the baseline, results in saturation efficiently transferred through the receptor to the nuclei of the complexed ligands. Since ligands with a relatively weak-affinity for the receptor will be released in the NMR time scale to allow recording of the spectrum while still saturated (on-resonance experiment; STDon), subtracting this spectrum from one recorded without saturation (off-resonance, STDoff) produces a difference spectrum (STDoff-on) in which only the signals of the binding ligands remain. The intensity of nonbinding ligands is identical in the on- and off-spectra so, they cancel out in the STDoff-on. The STD factor is expressed by eq 2.
| 2 |
Herein, we propose STD for unveiling the IF of polymers (IF-STD, Figure 1B,C). The selective saturation of a polymer in a region of the NMR spectrum free of signals should afford a nil STDoff-on unless broad signals embedded in the baseline (IF with very short 1H T2, region HIII in Figure 1B,C) transfer saturation to a visible–invisible interphase (region HII) with larger 1H T2 and faster dynamics. Spin diffusion is a time-dependent phenomenon with a length scale (L) that correlates to the longitudinal relaxation time (T1) as follows (eq 3):20
| 3 |
D is the spin diffusion coefficient (typically 0.1 nm2/ms)21 and tsat is the saturation time of the IF-STD experiment (constrained to a maximum length for tsat = T1). As for IF-STD experiments carried out with a tsat of 1–3 s (assuming tsat ≤ T1), the spin diffusion is expected to propagate within the polymer up to a length of ∼25–42 nm; the appearance of HII signals in the STDoff-on spectrum would not only confirm the presence of an IF, but also turn the visible–invisible interphase into a privileged viewing platform to gain an insight into the IF itself.
IF-STD resembles the dark state exchange saturation transfer (DEST) described by Clore to visualize proteins and peptides in exchange with much larger macromolecular assemblies.21−23 A major difference between IF-STD and DEST is that the latter relies on a chemical exchange mechanism between at least two states in solution with different degree of aggregation (i.e.; molecular tumbling), interconverting on an intermediate-to-slow time scale. Conversely, the transfer of magnetization in IF-STD starts from the saturated nuclei at the IF of a polymer and reaches the visible signals by spin diffusion,19 with the whole process occurring within a single state populated by nuclei with different dynamics (Figure 1B). IF-STD also differs from the chemical exchange saturation transfer (CEST),24 a DEST-related experiment focused on the chemical exchange on a slow time scale between visible and dark state species with significantly different chemical shifts. Another subtle distinction is that application of IF-STD does not require the prior knowledge of an IF.
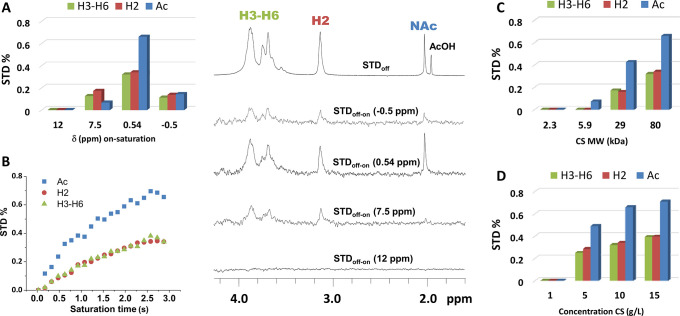
IF-STD was first assessed with CS (MW 80 kDa, DA 14%). An 8% IF was determined for this sample (10 g/L, 750 MHz) by analyzing the relative integral between the acetyl signal and that of an external reference in a series of spectra recorded at increasing temperatures (Figure S3 and SI). The effect of saturating at different regions of the spectrum is shown in Figure 2. As expected, when the on-saturation was placed at 12 ppm, far away from any polymer resonance, the resulting STDoff-on spectrum showed no signals, confirming the absence of an IF in this region of the spectrum (Figure 2A). Conversely, if the on-saturation was applied closer to the polymer resonances (7.5, 0.54, −0.5 ppm), STDoff-on signals revealed an IF in these regions. Higher STD factors were observed the closer the on-saturation to the polymer signals. When various tsat were tested, higher STD factors were obtained for the longer times (Figures 2B, S4, and S5). For experiments recorded at different magnetic fields and temperatures, higher STD factors were seen for the lower fields and lower temperatures (Figures S4 and S5), consistent with the proposed spin diffusion mechanism. Having confirmed the existence of an IF by STD, we proceeded to evaluate the effect of the MW and concentration on the intensity of IF-STD. Indeed, both parameters were identified in our previous report as key elements governing the appearance of an IF for CS.10 As expected (Figure 2C,D; spectra in Figures S6 and S7), increasing the MW and concentration resulted in higher STD factors associated with the appearance of an IF due to overlapping/entangled CS chains with slower dynamics and lower 1H T2.12,13 Lastly, the influence of the saturation pulse bandwidth (BW, see the SI) on the intensity of IF-STD was analyzed between 110 and 300 Hz (Figure S8). It was confirmed that the shorter the BW, the more selective the on-saturation pulse and so, the smaller the STD factors. A BW of 130 Hz (equivalent to 0.17 ppm at 750 MHz) was selected as a balance between pulse selectivity and IF-STD sensitivity (only 96–128 scans needed).
Figure 2.
Central panel: IF-STD spectra (750 MHz, 298 K, tsat 3 s, BW 130 Hz) of CS (80 kDa, DA 14, 10 g/L in pD 4.5 acetate buffer). STDoff-on (×100) with on-saturation at −0.5, 0.54, 7.5, and 12 ppm. Left panel: STD factor as a function of the on-saturation ppm (A) and tsat (on-saturation at 0.54 ppm, B). Right panel: STD factor (on-saturation at 0.54 ppm) as a function of the MW (C) and concentration of CS (D). Note that “H3–H6” includes all H3–H6 plus H2 of N-acetyl glucosamine, while “H2” refers to H2 of glucosamine. Interestingly, IF-STD spectra lack the residual nondeuterated signal of the acetate buffer as it does not interact with the IF.
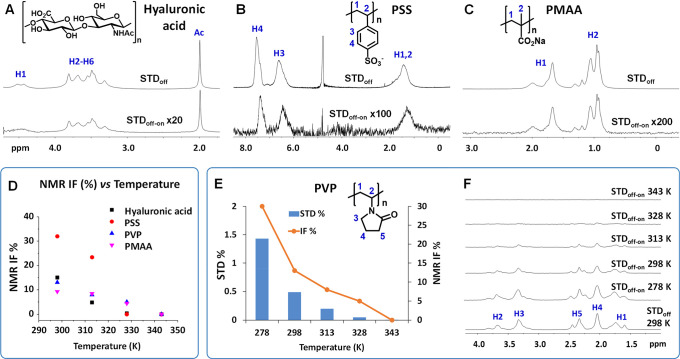
To explore the scope of IF-STD as technology to ascertain the presence of an IF in the 1H NMR spectra of polymers, a collection of natural and synthetic polymers [polysaccharides, polypeptides, acrylates and other vinyl polymers, polyethylenimine (PEI), polyethylene glycol (PEG), and a globular poly(propyleneimine) (PPI) dendrimer] was studied by IF-STD in D2O (10 g/L, 750 MHz; Figure 3 and Table 1). Samples were saturated for 3 s in a region of the spectra devoid of protons at −1.5 ppm from the lowest ppm visible signal, selected as region of interest [the 130 Hz BW affords a 1.41 ppm gap (1.5–0.17/2) between the on saturation upper limit and the starting point of the visible signal]. Table 1 includes STD factors (integration ranges in Table S1), 1H T2 values, and IF% (Figures 3D and S3 and Supporting Information) for the signals analyzed. IF-STD spectra are given in Figure 3 and the SI.
Figure 3.
IF-STD spectra (750 MHz, 298 K, 10 g/L in D2O, on-saturation at −1.5 ppm from the lowest ppm visible signal) of hyaluronic acid 160 kDa (A), PSS 1000 kDa (B), PMAA 30 kDa (C), and PVP 360 kDa (F). Effect of the temperature on the IF of polymers (D). Effect of the temperature on the STD factor and IF of PVP. STDoff-on (×20) (E, F).
Table 1. STD Factors and IF of Polymers (750 MHz, 298 K, 10 g/L in D2O)a.
| polymer | MW (kDa) | 1H T2 (ms)b | STD%c | NMR IF%d |
|---|---|---|---|---|
| hyaluronic acid | 160 | 31 | 3.4 | 15 |
| carrageenan | 647 | 20 | 1.6 | 43 |
| PSS | 1000 | 8 | 1.1 | 32 |
| chitosan (CS) | 80 | 26 | 0.66 | 8 |
| PVP | 360 | 19 | 0.49(1.4)e | ≥13 |
| PMAA | 30 | 21 | 0.43 | ≥9 |
| ulvan | 524 | 25 | 0.42 | 15 |
| PAA (pD 7.0) | 450 | 16 | 0.52 | 11 |
| PAA (pD 3.0) | 450 | 67 | 0.10(0.60)e | 0 |
| polyacrylamide | 5000 | 80 | 0.12 | nd |
| pullulan | 788 | 100 | 0.10(0.16)e | 0 |
| pullulan | 112 | 100 | 0 | nd |
| pullulan | 12 | 100 | 0 | nd |
| PVA | 306 | 98 | 0.06 | nd |
| PGA | 35 | 92 | 0.05(0.10)e | 0 |
| PGA | 14 | 92 | 0 | 0 |
| PLL | 45 | 69 | 0.05(0.10)e | nd |
| PEG | 10 | 400 | 0 | 0 |
| PEI-branched | 25 | 145 | 0 | nd |
| PPI-G4 | 3.5 | 29–242 | 0.02–1.49e | nd |
STD factors, IF, and 1H T2 for the lowest ppm visible signal in the NMR spectrum of each polymer. CS dissolved in pD 4.5 buffer. PSS [poly(styrenesulfonate)], PVP [polyvinylpyrrolidone], PMAA [sodium poly(methacrylate)], PAA [poly(acrylic acid)], PVA [poly(vinyl alcohol)], PLL [poly-l-lysine], PGA [poly-l-glutamic acid], PEG [poly(ethylene glycol)], PEI [polyethyleneimine], PPI-G4 [poly(propylene imine) dendrimer of G4].
Determined at 500 MHz; 1H T2 for CS and hyaluronic acid are mean values of all resonances.
BW 130 Hz, tsat 3 s, on-saturation at −1.5 ppm from the signal analyzed.
Determined by integration relative to an external reference in a series of NMR spectra recorded at increasing temperatures (298–343 K).
STD factor at 278 K.
We started analyzing by IF-STD the negatively charged, rigid polysaccharides, hyaluronic acid and carrageenan, both with a sizable IF previously described.7,9 In our hands, IF in the 15–43% range were revealed, accompanied by strong STD factors (STD > 1%, Table 1). Besides CS (8% IF, 0.66% STD), relatively high STD (>0.4%) were also obtained for polyelectrolytes with previously unknown IF, like PSS, ulvan, and the sodium salts of PMAA and PAA. Gratifyingly, an IF determination of these samples afforded figures higher than 9%, confirming the potential of IF-STD for the quick identification of IF in solution. Indeed, the stiffness of polyelectrolytes favors the appearance of an IF and strong IF-STD as demonstrated when comparing the 0.52% STD and 11% IF of PAA at pD 7 (anionic polyelectrolyte) with a negligible STD and no IF at pD 3.0 (protonated carboxylic acids, no electrostatic repulsion). Still, the presence of an IF is not restricted to polyelectrolytes. While the highly flexible PEG and PEI resulted in neither IF-STD nor IF, the more rigid PVP afforded a 0.49% STD and ≥13% IF. The high sensitivity of IF-STD is also demonstrated by examples without IF but weak STD factors (<0.15%), such as PGA and pullulan. Structurally related polymers like PVA, polyacrylamide, and PLL also displayed STD < 0.15%.
As seen for CS, IF-STD factors in Table 1 responded to the temperature and MW as the IF%. Either reducing the temperature (PVP, PAA, pullulan, PLL, PGA) or increasing the MW (pullulan, PGA) resulted in larger STD factors and growing IF (Table 1 and SI). Figure 3E,F shows a series of STDoff-on spectra for PVP at different temperatures that illustrate this trend. While null STDoff-on and IF were observed at 343 K, these steadily increased up to 1.4% STD and 30% IF on reducing the temperature down to 278 K (same effect for CS in Figure S5). Certainly, any variation of structural or recording parameters (MW, concentration, temperature, pH, magnetic field) leading to reduced polymer dynamics (lower 1H T2) will favor the appearance of an IF and intense IF-STD. Ultimately, despite the lack of a direct proportionality, STD% reveals as a good indicator of the presence of an IF (Table 1) with STD > 0.4% (associated to 1H T2 ≤ 30 ms) pointing to substantial IF figures, while STD < 0.15% (1H T2 > 50 ms) to negligible IF.
With the aim of broadening the scope of IF-STD, a polypropylene imine dendrimer of generation 4 (PPI-G4) was also analyzed (Figure 4). Despite its very low MW (3514 Da), STDoff-on signals were observed at 298 K that increased at 278 K. A topological analysis25 revealed that, independently of the on-saturation site, 0.06 ppm (close to the core H1 protons) or 4.16 ppm (close to peripheral H14), more intense STD signals were observed on going from the periphery to the core, in agreement with the known slower dynamics and lower T2 values at the dendritic core.26,27 Also, for the internal protons, larger STD factors were seen when saturating at 0.06 ppm. This experiment illustrates a fundamental property of IF-STD: the signal is generated within a single state as opposed to several states with different degrees of aggregation. According to the mechanism depicted in Figure 4A, magnetization in PPI-G4 transfers by spin diffusion intramolecularly from the saturated less mobile nuclei at the core (characterized by very short T2) to the more flexible domains at the periphery (larger T2).
Figure 4.
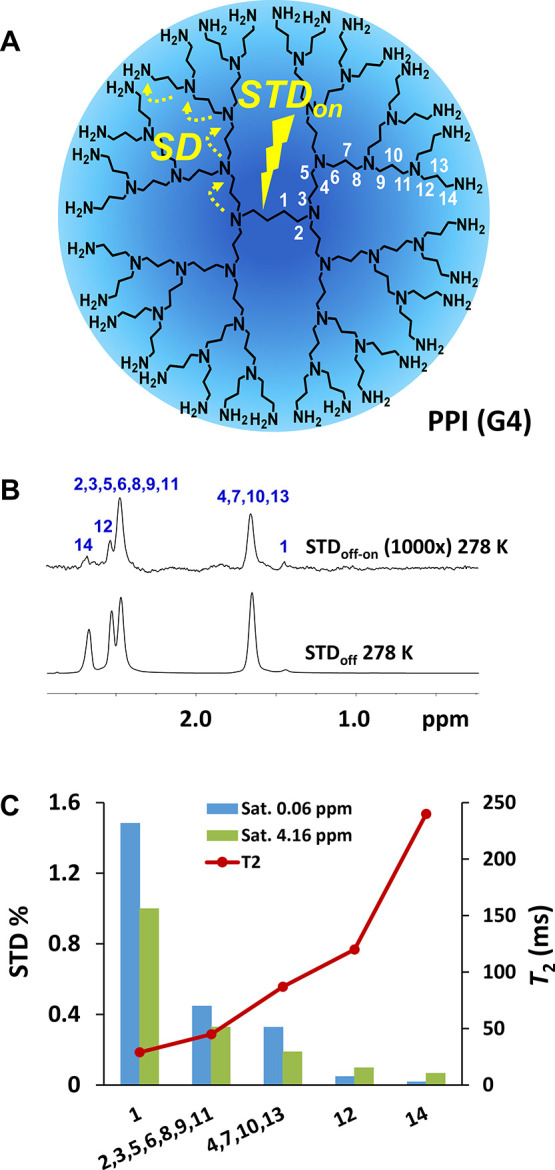
Structure of PPI-G4 and schematic representation of the IF-STD experiment (A). IF-STD spectrum of PPI-G4 (750 MHz, 278 K, 10 g/L in D2O, on-saturation 0.06 ppm) (B). STD factors saturating at 0.06 and 4.16 ppm (750 MHz, 278 K) and 1H T2 (500 MHz, 298 K) (C).
Contrary to a reductionist visible–invisible dichotomy, a continuous distribution of nuclei with diverse dynamics is envisioned in polymers (single state) so that T2, recorded in conventional NMR experiments, would stand for mean values of all nuclei in the NMR-visible fraction (regions HI and HII in Figure 1), while nuclei with lower T2 would constitute the IF (region HIII in Figure 1). To evaluate IF-STD for selectively tunning nuclei at the visible–invisible interphase, we compared 1H T2 values obtained via conventional Carr–Purcell–Meiboom–Gill (CPMG)28,29 pulse sequence (detection of all NMR-visible nuclei) and a modified IF-STD-CPMG selected to probe nuclei at the visible–invisible interphase. Figures 5 and S20 show, for the H2 of CS, superimposable signal decays with the CPMG time in the conventional CPMG and hybrid IF-STDoff-CPMG spectra (tsat 0.5–3 s), accounting for a 1H T2 of 25 ms. This result rules out potential heating artifacts in the experiment introduced by the saturation pulse. By contrast, the IF-STDoff-on-CPMG experiment showed a steeper decay, in agreement with the expected slower dynamics of nuclei at the visible–invisible interphase (Figure 5). More pronounced decays were observed when reducing the tsat from 3.0 to 0.5 s, affording 1H T2 values of 12 and 6 ms, respectively (same trend for H3–H6 in Figure S21). This result is consistent with the spin diffusion mechanism and the single state model depicted in Figure 1. The shorter the tsat, the shorter the distance for the propagation of the saturation from the invisible (HIII) to the visible domain (eq 3), leading to STDoff-on spectra with a greater contribution of the HII protons in closer proximity to the IF. So, IF-STD emerges as a tool for the signal-edition of nuclei at the visible–invisible interphase, a platform for gaining an insight into the IF.
Figure 5.
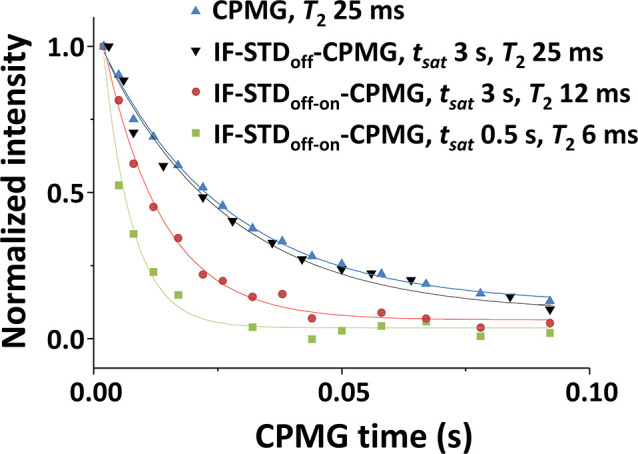
Effect of tsat during IF-STD-CPMG on the 1H T2 of the visible–invisible interphase. Normalized 1H intensities (I/I0) for the H2 of CS (80 kDa, DA 14, 10 g/L in pD 4.5 acetate buffer) as a function of the CPMG time in conventional CPMG and hybrid IF-STD-CPMG (750 MHz, 298 K).
A similar strategy combining IF-STD and a diffusion encoding step based on the BPPSTE experiment (Bipolar Pulse Field Gradient-STimulated Echo)30 added further evidence for the single state model. The apparent translational diffusion coefficient of the CS fraction edited by the hybrid IF-STD-BPPSTE was compared with that obtained by the conventional BPPSTE. No difference among their Stejskal–Tanner plots was observed (several tsat tested; Figure S22) in agreement with a single diffusion coefficient for all NMR-visible nuclei (regions HI and HII in Figure 1), independent of their spatial proximity to the IF.
In conclusion, IF-STD is described as a fast and reliable tool to unveil the IF of polymers in solution. The saturation of a polymer in a region of the NMR spectrum with IF (very short 1H T2) results in an efficient propagation of the magnetization by spin diffusion to a visible–invisible interphase with larger 1H T2 and faster dynamics (STDon). Visualization of this interphase in a difference STDoff-on spectrum has revealed IF more common than previously thought, with relevant IF figures for a wide variety of natural and synthetic polymers when STD > 0.4% at 750 MHz. This is the case for charged rigid polysaccharides like hyaluronic acid, carrageenan and CS, weak polyelectrolytes (PAA, PMAA, PPI dendrimer) and even uncharged polymers like PVP. In agreement with the spin diffusion mechanism, larger STD factors revealed for the larger MW and higher concentrations (aggregation and viscosity), lower temperatures, and lower magnetic fields. More intense STD were also obtained the closer the on-saturation to the polymer visible signals, and the larger the tsat and BW.
A fundamental property of the IF-STD experiment is that the signal is generated within a single state comprising polymer domains with different dynamics. As nuclei edited by IF-STD at the visible–invisible interphase are in close spatial proximity to the IF (tunable with tsat), they represent a convenient platform from which gaining an insight into the IF itself. For instance, combining IF-STD with a CPMG sequence has allowed for CS to determine T2 values for the visible–invisible interphase 4-fold lower than the average T2 probed by conventional CPMG for all visible nuclei. This result confirms that contrary to a reductionist visible–invisible dichotomy in polymers, there is a continuous distribution of nuclei with diverse dynamics in agreement with the proposed single state mechanism.
Acknowledgments
This work was supported by the Spanish Ministry of Science and Innovation (RTI2018-102212-B-I00), the Xunta de Galicia (ED431C 2018/30, and Centro singular de investigación de Galicia accreditation 2019–2022, ED431G2019/03), Axencia Galega de Innovación (IN845D 2020/09), and the European Union (European Regional Development Fund-ERDF).
Supporting Information Available
. The Supporting Information is available free of charge at https://pubs.acs.org/doi/10.1021/acsmacrolett.1c00628.
Materials, NMR methods, IF-STD spectra, and figures (PDF)
The authors declare no competing financial interest.
Supplementary Material
References
- Rabenstein D. L. Sensitivity enhancement by signal averaging in pulsed/Fourier transform NMR spectroscopy. J. Chem. Educ. 1984, 61, 909–913. 10.1021/ed061p909. [DOI] [Google Scholar]
- Kowalewski J.; Mäler L.. Nuclear Spin Relaxation in Liquids: Theory, Experiments, and Applications; CRC Press: Boca Raton, FL, 2006. [Google Scholar]
- Felip-León C.; Galindo F.; Miravet J. F.; Castelletto V.; Hamley I. W. Thermally Regulated Reversible Formation of Vesicle-Like Assemblies by Hexaproline Amphiphiles. J. Phys. Chem. B 2017, 121, 7443–7446. 10.1021/acs.jpcb.7b06167. [DOI] [PubMed] [Google Scholar]
- Prevette L. E.; Nikolova E. N.; Al-Hashimi H. M.; Banaszak Holl M. M. Intrinsic Dynamics of DNA-Polymer Complexes: A Mechanism for DNA Release. Mol. Pharmaceutics 2012, 9, 2743–2749. 10.1021/mp3002864. [DOI] [PMC free article] [PubMed] [Google Scholar]
- Shapiro Y. E. Structure and dynamics of hydrogels and organogels: An NMR spectroscopy approach. Prog. Polym. Sci. 2011, 36, 1184–1253. 10.1016/j.progpolymsci.2011.04.002. [DOI] [Google Scholar]
- Catoire L.; Goldberg R.; Pierron M.; Morvan C.; Hervé du Penhoat C. An efficient procedure for studying pectin structure which combines limited depolymerization and 13C NMR. Eur. Biophys. J. 1998, 27, 127–136. 10.1007/s002490050118. [DOI] [PubMed] [Google Scholar]
- Darke A.; Finer E. G.; Moorhouse R.; Rees D. A. Studies of hyaluronate solutions by nuclear magnetic relaxation measurements. Detection of covalently-defmed, stiff segments within the flexible chains. J. Mol. Biol. 1975, 99, 477–486. 10.1016/S0022-2836(75)80139-2. [DOI] [PubMed] [Google Scholar]
- Morris E. R.; Rees D. A.; Young G.; Walkinshaw M. D.; Darke A. Order-disorder transition for a bacterial polysaccharide in solution. A role for polysaccharide conformation in recognition between Xanthomonas pathogen and its plant host. J. Mol. Biol. 1977, 110, 1–16. 10.1016/S0022-2836(77)80095-8. [DOI] [PubMed] [Google Scholar]
- Ablett S.; Clark A. H.; Rees D. A. Assessment of the flexibilities of carbohydrate polymers by proton-NMR relaxation and line shape analysis. Macromolecules 1982, 15, 597–602. 10.1021/ma00230a075. [DOI] [Google Scholar]
- Novoa-Carballal R.; Riguera R.; Fernandez-Megia E. Disclosing an NMR-Invisible Fraction in Chitosan and PEGylated Copolymers and Its Role on the Determination of Degrees of Substitution. Mol. Pharmaceutics 2013, 10, 3225–3231. 10.1021/mp400267m. [DOI] [PubMed] [Google Scholar]
- Novoa-Carballal R.; Fernandez-Megia E.; Riguera R. Dynamics of Chitosan by 1H NMR Relaxation. Biomacromolecules 2010, 11, 2079–2086. 10.1021/bm100447f. [DOI] [PubMed] [Google Scholar]
- Novoa-Carballal R.; Riguera R.; Fernandez-Megia E. Chitosan hydrophobic domains are favoured at low degree of acetylation and molecular weight. Polymer 2013, 54, 2081–2087. 10.1016/j.polymer.2013.02.024. [DOI] [Google Scholar]
- Fernandez-Megia E.; Novoa-Carballal R.; Quiñoá E.; Riguera R. Optimal routine conditions for the determination of the degree of acetylation of chitosan by 1H-NMR. Carbohydr. Carbohydr. Polym. 2005, 61, 155–161. 10.1016/j.carbpol.2005.04.006. [DOI] [Google Scholar]
- Mayer M.; Meyer B. Characterization of Ligand Binding by Saturation Transfer Difference NMR Spectroscopy. Angew. Chem., Int. Ed. 1999, 38, 1784–1788. . [DOI] [PubMed] [Google Scholar]
- Meyer B.; Peters T. NMR Spectroscopy Techniques for Screening and Identifying Ligand Binding to Protein Receptors. Angew. Chem., Int. Ed. 2003, 42, 864–890. 10.1002/anie.200390233. [DOI] [PubMed] [Google Scholar]
- Unione L.; Galante S.; Díaz D.; Cañada F. J.; Jiménez-Barbero J. NMR and molecular recognition. The application of ligand-based NMR methods to monitor molecular interactions. MedChemComm 2014, 5, 1280–1289. 10.1039/C4MD00138A. [DOI] [Google Scholar]
- García-García P.; Moreno J. M.; Díaz U.; Bruix M.; Corma A. Organic-inorganic supramolecular solid catalyst boosts organic reactions in water. Nat. Commun. 2016, 7, 10835–10843. 10.1038/ncomms10835. [DOI] [PMC free article] [PubMed] [Google Scholar]
- Szczygiel A.; Timmermans L.; Fritzinger B.; Martins J. C. Widening the View on Dispersant-Pigment Interactions in Colloidal Dispersions with Saturation Transfer Difference NMR Spectroscopy. J. Am. Chem. Soc. 2009, 131, 17756–17758. 10.1021/ja905637y. [DOI] [PubMed] [Google Scholar]
- Neuhaus D.; Williamsson M. P.. The Nuclear Overhauser effect in Structural and Conformational Analysis; Willey-VCH: New York, 2000. [Google Scholar]
- Mensink M. A.; Nethercott M. J.; Hinrichs W. L. J.; van der Voort Maarschalk K.; Frijlink H. W.; Munson E. J.; Pikal M. J. Influence of Miscibility of Protein-Sugar Lyophilizates on Their Storage Stability. AAPS J. 2016, 18, 1225–1232. 10.1208/s12248-016-9937-7. [DOI] [PubMed] [Google Scholar]
- Fawzi N. L.; Ying J.; Torchia D. A.; Clore G. M. Kinetics of Amyloid β Monomer-to-Oligomer Exchange by NMR Relaxation. J. Am. Chem. Soc. 2010, 132, 9948–9951. 10.1021/ja1048253. [DOI] [PMC free article] [PubMed] [Google Scholar]
- Fawzi N. L.; Ying J.; Ghirlando R.; Torchia D. A.; Clore G. M. Atomic-resolution dynamics on the surface of amyloid-β protofibrils probed by solution NMR. Nature 2011, 480, 268–272. 10.1038/nature10577. [DOI] [PMC free article] [PubMed] [Google Scholar]
- Libich D. S.; Fawzi N. L.; Ying J.; Clore G. M. Probing the transient dark state of substrate binding to GroEL by relaxation-based solution NMR. Proc. Natl. Acad. Sci. U. S. A. 2013, 110, 11361–11366. 10.1073/pnas.1305715110. [DOI] [PMC free article] [PubMed] [Google Scholar]
- Vallurupalli P.; Bouvignies G.; Kay L. E. Studying “Invisible” Excited Protein States in Slow Exchange with a Major State Conformation. J. Am. Chem. Soc. 2012, 134, 8148–8161. 10.1021/ja3001419. [DOI] [PubMed] [Google Scholar]
- Chai M.; Niu Y.; Youngs W. J.; Rinaldi P. L. 3D NMR Studies of DAB-16 Dendrimer. Macromolecules 2000, 33, 5395–5398. 10.1021/ma000122b. [DOI] [Google Scholar]
- Pinto L. F.; Correa J.; Martin-Pastor M.; Riguera R.; Fernandez-Megia E. The Dynamics of Dendrimers by NMR Relaxation: Interpretation Pitfalls. J. Am. Chem. Soc. 2013, 135, 1972–1977. 10.1021/ja311908n. [DOI] [PubMed] [Google Scholar]
- Pinto L. F.; Riguera R.; Fernandez-Megia E. Stepwise Filtering of the Internal Layers of Dendrimers by Transverse-Relaxation-Edited NMR. J. Am. Chem. Soc. 2013, 135, 11513–11516. 10.1021/ja4059348. [DOI] [PubMed] [Google Scholar]
- Carr H. Y.; Purcell E. M. Effects of Diffusion on Free Precession in Nuclear Magnetic Resonance Experiments. Phys. Rev. 1954, 94, 630–638. 10.1103/PhysRev.94.630. [DOI] [Google Scholar]
- Meiboom S.; Gill D. Modified Spin-Echo Method for Measuring Nuclear Relaxation Times. Rev. Sci. Instrum. 1958, 29, 688–691. 10.1063/1.1716296. [DOI] [Google Scholar]
- Wu D. H.; Chen A. D.; Johnson C. S. An Improved Diffusion-Ordered Spectroscopy Experiment Incorporating Bipolar-Gradient Pulses. J. Magn. Reson., Ser. A 1995, 115, 260–264. 10.1006/jmra.1995.1176. [DOI] [Google Scholar]
Associated Data
This section collects any data citations, data availability statements, or supplementary materials included in this article.


